Environmental Research and Public Health
Article
Effects of Ventilation Improvement on Measured and Perceived Indoor Air Quality in a School Building with a Hybrid Ventilation System
Camilla Vornanen-Winqvist1,*, Heidi Salonen1, Kati Järvi1, Maria A. Andersson1, Raimo Mikkola1, Tamás Marik2, LászlóKredics2ID and Jarek Kurnitski1,3ID
1 Department of Civil Engineering, Aalto University, Rakentajanaukio 4, 02150 Espoo, Finland;
heidi.salonen@aalto.fi (H.S.); kati.jarvi@aalto.fi (K.J.); maria.a.andersson@helsinki.fi (M.A.A.);
raimo.mikkola@aalto.fi (R.M.); jarek.kurnitski@aalto.fi (J.K.)
2 Department of Microbiology, University of Szeged, Közép fasor 52, H-6726 Szeged, Hungary;
mariktamas88@gmail.com (T.M.); kredics@bio.u-szeged.hu (L.K.)
3 Department of Civil Engineering and Architecture, Tallinn University of Technology, Ehitajate tee 5, 19086 Tallinn, Estonia
* Correspondence: camilla.vornanen@aalto.fi; Tel.: +358-50-347-2755
Received: 18 June 2018; Accepted: 3 July 2018; Published: 5 July 2018 Abstract:Ventilation system design and operation may significantly affect indoor air quality (IAQ).
The aims of this case study were to investigate the functionality of a supply air fan-assisted hybrid ventilation system in a newly built school building with reported IAQ problems and to determine the effects of ventilation improvement on measured and perceived IAQ. The ventilation system function was researched simultaneously with IAQ measurements, with an analysis of total volatile organic compounds (TVOC), single volatile organic compounds (VOCs), and indoor mycobiota, and with questionnaires about perceived IAQ. At the baseline, an operational error of the ventilation system was found, which prevented the air from coming into the classrooms, except for short periods of high carbon dioxide (CO2) concentrations. After the ventilation operation was improved, a significant change in indoor mycobiota was found; the dominant, opportunistic human pathogenic species Trichoderma citrinoviride found in settled dust in the classroom before the improvement was no longer detected. In addition, the concentrations of CO2, TVOC, and some single VOCs, especially toluene and decamethylcyclopentasiloxane, decreased. The analysis of the questionnaire results indicated that the perceptions of unpleasant odors and stuffy air decreased, although a statistically significant improvement in perceived IAQ was not observed. The results provided evidence that the properly controlled hybrid ventilation system operating in mechanical supply mode provided adequate ventilation and was effective in decreasing the concentrations of some indoor-generated pollutants. With simple ventilation adjustments, microbiological exposure from building structures might be prevented.
Keywords:ventilation; hybrid ventilation; indoor air quality; mycobiota; indoor air questionnaire;
school building;Trichoderma citrinoviride
1. Introduction
In Finland, moisture damage and ventilation disadvantages are the most common problems as they are reported in more than 50% of school buildings [1]. A recent Finnish study found that 58% of Finnish schools suffer from insufficient ventilation [2]. School environments are often complex and involve several interconnected factors that affect the health of occupants [3–5]. Current evidence shows that classroom conditions are significantly associated with the respiratory symptoms of teachers [6].
Int. J. Environ. Res. Public Health2018,15, 1414; doi:10.3390/ijerph15071414 www.mdpi.com/journal/ijerph
Kielb et al. [7] found that one or more perceived symptoms were most strongly associated with reported dust and dust reservoirs, mold and moldy odors, and paint odors. Symptoms of sick building syndrome (SBS) were associated with perceptions of stuffy air, dry air, and electricity [8]. Further, teachers’ perceptions of neuro-physiological symptoms, e.g., headache, fatigue, and difficulties in concentrating, were significantly increased with every 100 ppm increase in maximum classroom CO2
concentrations [9].
According to epidemiological studies, in general, higher ventilation rates (up to 25–40 L/s per person) reduce negative health outcomes, and with minimum rates of ventilation (above 6–7 L/s), some (mainly acute) health outcomes can be avoided [10]. In a review study, Sundell et al. [11] reported that lower ventilation rates might increase the incidence of respiratory infections, asthmatic symptoms, inflammation, and short-term sick leave. Correspondingly, teachers working at schools with good perceived IAQ have decreased risk for short-term sick leave (one to three days) [12]. In addition, it is well documented that both thermal conditions and IAQ affect the performance of students [13].
Cellulolytic fungi that require high water content to survive, such asTrichodermaspecies, are well adapted to colonize water-damaged buildings. Members of this genus are often found on wet manufactured wood and gypsum boards from schools and public buildings [14,15]. Building materials contaminated with Trichoderma species emit high amounts of conidia into the indoor air [15].
Conidia and hyphal fragments containing toxic peptaibols have been shown to provoke histamine release and disrupt the membranes of exposed target cells [15,16]. Exposure to viable conidia emitted from potentially pathogenicTrichodermaspecies, such asT. longibrachiatumandT. citrinoviride, represents an additional health risk [14,17]. Measurement of cultivable conidia from pathogenic and toxigenic fungi in settled dust in schools is an easy method to determine the potential health risk associated with changes in ventilation and fluctuations in indoor air pressure [18]. House dust is a long-term reservoir of indoor fungi, therefore it is frequently collected to evaluate cumulative exposure and fungal composition [19–21].
Ventilation plays a major role in creating a healthy and pleasant indoor environment, especially in modern airtight buildings. Hybrid ventilation systems are developed to combine the benefits of natural and mechanical ventilation, in order to increase the use of sustainable technologies, reduce energy consumption and to create healthy, comfortable indoor environment [22,23]. Natural ventilation is often well adopted by the occupants but may be inadequate in some climates and buildings. In the case of hybrid ventilation, mechanical components compensate the shortcomings of natural ventilation.
Many comparative studies of natural, mechanical and hybrid ventilation systems have been published from the aspects of energy efficiency, thermal conditions, CO2levels, and system simulations [24–26].
However, there are no studies available about reported IAQ problems and microbiological exposure in school buildings with hybrid ventilation systems.
In Helsinki, Finland, only a few public school buildings have hybrid ventilation systems.
This study was conducted as part of the Finnish “EURA” and “TOXICPM” research projects (see acknowledgements) concerning IAQ and ventilation in new and renovated school buildings and microbial toxin transport mechanisms.
The aim of our study was to investigate the functionality of a hybrid ventilation system in a newly built school building with reported IAQ problems and to determine the effects of ventilation system improvement on measured and perceived IAQ. The effects of simple but essential improvement in the ventilation system were studied most of all from the point of approvable IAQ. The occurrence of indoor mycobiota before and after the improvements was investigated from an encompassing long-term dust sample. To our knowledge, except from our earlier intervention study of ventilation positive pressure [18], no comparative studies have been published before.
Int. J. Environ. Res. Public Health2018,15, 1414 3 of 18
2. Materials and Methods
2.1. Building Characteristics
The study was conducted in the building of a comprehensive school in Helsinki, Southern Finland, where children from the ages of 7 to 16 were educated. Approximately 700 students and 70 staff members worked in the school. It was built in 2009, and the owner of the building (City of Helsinki, Urban Environment Division, Buildings and Public Areas, Built Assets Management; later in the paper called as the Built Assets Management of City of Helsinki), had experienced difficulties in maintaining sufficient ventilation and good IAQ in the building. Since 2010, several IAQ-related investigations and repairs had been conducted. For example, according to numerous investigation reports and information from the Built Assets Management of City of Helsinki, flooring was replaced because the concrete slabs were moist, local moisture damage was repaired, ventilation was adjusted, and air leaks were sealed. At the time of this research, the occupants had reported severe IAQ-related symptoms and discomfort during the past few years in different sections of the building, especially in the one under study.
The building featured two separate ventilation systems: mechanical supply and extract ventilation with heat recovery in one section of the building, and fan-assisted natural ventilation (hybrid ventilation) in two identical sections. One section consisted of two floors. However, it should be noted that the building sections with different ventilation systems were not completely separated.
Air was mixed between the sections since the main entrance of the building is located in the mechanically ventilated section, which has to be crossed in order to reach the hybrid-ventilated sections.
This study focused on one hybrid-ventilated section of the building, which consisted of two equal areas in the first and second floor, was served by one air handling unit and occupied by approximately 30% of the school teachers and students. Occupants had reported the most severe symptoms and discomfort in the studied section, especially in the first floor. The studied section consisted of a first floor lobby surrounded by eight classrooms and toilets. The layout is presented in Figure1.
2. Materials and Methods
2.1. Building Characteristics
The study was conducted in the building of a comprehensive school in Helsinki, Southern Finland, where children from the ages of 7 to 16 were educated. Approximately 700 students and 70 staff members worked in the school. It was built in 2009, and the owner of the building (City of Helsinki, Urban Environment Division, Buildings and Public Areas, Built Assets Management; later in the paper called as the Built Assets Management of City of Helsinki), had experienced difficulties in maintaining sufficient ventilation and good IAQ in the building. Since 2010, several IAQ-related investigations and repairs had been conducted. For example, according to numerous investigation reports and information from the Built Assets Management of City of Helsinki, flooring was replaced because the concrete slabs were moist, local moisture damage was repaired, ventilation was adjusted, and air leaks were sealed. At the time of this research, the occupants had reported severe IAQ-related symptoms and discomfort during the past few years in different sections of the building, especially in the one under study.
The building featured two separate ventilation systems: mechanical supply and extract ventilation with heat recovery in one section of the building, and fan-assisted natural ventilation (hybrid ventilation) in two identical sections. One section consisted of two floors. However, it should be noted that the building sections with different ventilation systems were not completely separated.
Air was mixed between the sections since the main entrance of the building is located in the mechanically ventilated section, which has to be crossed in order to reach the hybrid-ventilated sections.
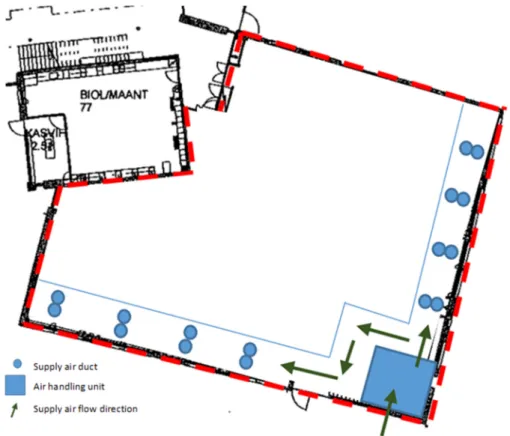
This study focused on one hybrid-ventilated section of the building, which consisted of two equal areas in the first and second floor, was served by one air handling unit and occupied by approximately 30% of the school teachers and students. Occupants had reported the most severe symptoms and discomfort in the studied section, especially in the first floor. The studied section consisted of a first floor lobby surrounded by eight classrooms and toilets. The layout is presented in Figure 1.
Figure 1. The studied building section (first floor) and locations of the supply air ducts and exhaust stack. Air flow direction is shown by arrows as an example in one classroom. Measurements were conducted mainly in Classrooms 1 and 2.
Figure 1.The studied building section (first floor) and locations of the supply air ducts and exhaust stack. Air flow direction is shown by arrows as an example in one classroom. Measurements were conducted mainly in Classrooms 1 and 2.
Supply air was taken into the building section by a supply air tower, where it was also filtered and brought to an air handling unit located in the basement underneath the building section. Supply air (assisting) fan was designed for on-demand use, but due to the prolonged IAQ problems, it was running constantly at full speed, designed for circumstances of CO2level exceeding 1200 ppm. The designed supply air rate was 8 L/s/person, and altogether 2000 L/s for the entire building section (two floors).
After the air handling unit, supply air entered a chamber with two corridors, where it was heated with radiators. The cross-section area of the corridor space was 2 m2. Each classroom of the building section (altogether, 16 classrooms on two floors) had its own supply air duct beginning from these underground corridors. The layout of the supply air corridors and their location in relation to the section of the building under study are shown in Figure2.
Int. J. Environ. Res. Public Health 2018, 15, x FOR PEER REVIEW 4 of 18
Supply air was taken into the building section by a supply air tower, where it was also filtered and brought to an air handling unit located in the basement underneath the building section. Supply air (assisting) fan was designed for on-demand use, but due to the prolonged IAQ problems, it was running constantly at full speed, designed for circumstances of CO2 level exceeding 1200 ppm. The designed supply air rate was 8 L/s/person, and altogether 2000 L/s for the entire building section (two floors).
After the air handling unit, supply air entered a chamber with two corridors, where it was heated with radiators. The cross-section area of the corridor space was 2 m2. Each classroom of the building section (altogether, 16 classrooms on two floors) had its own supply air duct beginning from these underground corridors. The layout of the supply air corridors and their location in relation to the section of the building under study are shown in Figure 2.
Figure 2. Location of the underground supply air chamber in relation to the studied building section (limited by a blue line): air handling unit, corridors, and terminal units of supply air ducts leading to the first- and second-floor classrooms. Direction of the supply air movement is marked with arrows.
Classroom supply air rates were adjusted by motorized dampers located at the beginning of the supply air ducts. The dampers were designed to be a minimum of 20% open in basic situations to provide base ventilation for the classrooms. Classroom-specific carbon dioxide (CO2) sensors controlled the dampers after the CO2 level exceeded approximately 500 ppm in order to increase the supply air rate on demand. The supply air intake was controlled by an automatic remote control system.
Air was brought to the classrooms through grilles under the window sills, where the radiators were also located. From the classrooms, air was transferred to the lobby via grilles in the partitions, and then extracted outdoors from the lobby via a large exhaust stack, as presented in Figure 3.
Figure 2.Location of the underground supply air chamber in relation to the studied building section (limited by a blue line): air handling unit, corridors, and terminal units of supply air ducts leading to the first- and second-floor classrooms. Direction of the supply air movement is marked with arrows.
Classroom supply air rates were adjusted by motorized dampers located at the beginning of the supply air ducts. The dampers were designed to be a minimum of 20% open in basic situations to provide base ventilation for the classrooms. Classroom-specific carbon dioxide (CO2) sensors controlled the dampers after the CO2level exceeded approximately 500 ppm in order to increase the supply air rate on demand. The supply air intake was controlled by an automatic remote control system.
Air was brought to the classrooms through grilles under the window sills, where the radiators were also located. From the classrooms, air was transferred to the lobby via grilles in the partitions, and then extracted outdoors from the lobby via a large exhaust stack, as presented in Figure3.
Int. J. Environ. Res. Public Health 2018, 15, x FOR PEER REVIEW 5 of 18
(a) (b)
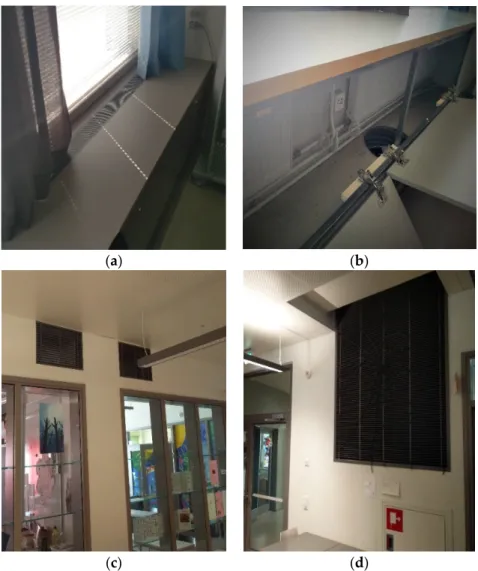
(c) (d)
Figure 3. (a,b) Supply air grill and duct in the classrooms; (c) transfer air grilles in the partitions between classrooms and the lobby and (d) exhaust stack in the lobby.
2.2. Functionality of the Hybrid Ventilation System
According to the building’s management, occupants had reported significant discomfort, stuffy air, and unpleasant odors, especially in the section of the building under study. Bad odors and displeasing IAQ were easily observed during the researchers’ first visits to the building. The causes of occupants´ symptoms and discomfort were not identified, even after several investigations, but were suspected to be impurities that infiltrated the building through air leakages.
Ventilation function was investigated and reported previously [27] using pressure difference measurements, tests, and observations of the dampers in the supply air corridor with varied CO2
concentration; air flow measurements in the classrooms; and pressure difference measurements in the classrooms with varied door positions and damper settings.
The ventilation system was found to be severely malfunctioning, since the supply air dampers were completely closed due to a remote control system error that was defectively treated. Supply air was enabled to enter the ducts and classrooms only during short periods when CO2 concentration exceeded 500 ppm. Thus, the CO2 concentrations were sustained at an acceptable level, but the classrooms still had no base ventilation. There was a complete lack of supply air in the classrooms when they were unoccupied. According to a MERMAID-study, ventilation operation for slightly longer than the occupancy period seemed to be the best compromise for IAQ and energy consumption [28].
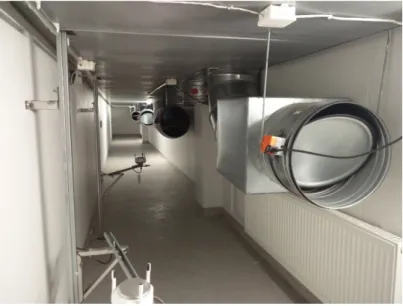
The underground supply air duct corridor and a duct damper that is opened as required for base ventilation are shown in Figure 4.
Figure 3. (a,b) Supply air grill and duct in the classrooms; (c) transfer air grilles in the partitions between classrooms and the lobby and (d) exhaust stack in the lobby.
2.2. Functionality of the Hybrid Ventilation System
According to the building’s management, occupants had reported significant discomfort, stuffy air, and unpleasant odors, especially in the section of the building under study. Bad odors and displeasing IAQ were easily observed during the researchers’ first visits to the building. The causes of occupants’
symptoms and discomfort were not identified, even after several investigations, but were suspected to be impurities that infiltrated the building through air leakages.
Ventilation function was investigated and reported previously [27] using pressure difference measurements, tests, and observations of the dampers in the supply air corridor with varied CO2
concentration; air flow measurements in the classrooms; and pressure difference measurements in the classrooms with varied door positions and damper settings.
The ventilation system was found to be severely malfunctioning, since the supply air dampers were completely closed due to a remote control system error that was defectively treated. Supply air was enabled to enter the ducts and classrooms only during short periods when CO2concentration exceeded 500 ppm. Thus, the CO2 concentrations were sustained at an acceptable level, but the classrooms still had no base ventilation. There was a complete lack of supply air in the classrooms when they were unoccupied. According to a MERMAID-study, ventilation operation for slightly longer than the occupancy period seemed to be the best compromise for IAQ and energy consumption [28].
The underground supply air duct corridor and a duct damper that is opened as required for base ventilation are shown in Figure4.
Int. J. Environ. Res. Public Health 2018, 15, x FOR PEER REVIEW 6 of 18
Figure 4. Supply air duct corridor and classroom-specific ducts’ terminal units in the basement.
Dampers are opened 20%, as designed.
After initial investigations, the proper remote control system adjustments were carried out by a competent company, and base ventilation was provided to the classrooms after an approximately two-year break.
Overall, the ventilation system was found to be complex and barely controllable [27]. The form of the supply air corridors (one straight and one angular) caused pressure loss and thus divided supply air unequally among the classrooms. Classrooms 1 and 2, the supply air ducts of which were located in the angular corridor and at the utmost from the air handling unit, seemed to have the least amount of supply air due to the pressure loss in the corridor. Furthermore, the classroom door positions affected the pressure relations throughout the whole building section. Thus, the hybrid ventilation system was shown to have some prerequisites for appropriate operation. Constant provision of the demanded supply air could be supported by some technical changes to the adjustments and control system.
2.3. Measurements in the School
In order to study the perceived and measured indoor air quality before (May 2016) and after (March 2017) the ventilation system improvements, a set of measurements were performed, mainly in Classrooms 1 and 2 where the occupants had reported the most severe symptoms and discomfort according to the Built Assets Management of City of Helsinki, and which were located most unfavorably in relation to the air handling unit. Classrooms 1 and 2 were next to each other, and could also be used as a combined space since there was a door in the partition. Additional measurements were conducted in the lobby and in some other classrooms in the section of the building under study. The measurement methods are presented in Table 1.
Table 1. Measurement methods, devices, and their accuracy, measurement place, and duration.
Measured Factor Device Accuracy Place Time
Supply air flow rate SWEMA 3000 md ±0.3% read value,
lowest ±0.3 Pa All classrooms 60 s average Pressure difference
across the envelope
KIMO CP101, logger Grant 1000
1.5% of
reading ±3 Pa Classrooms 1 and 2 Continuous, 1 week (May 2016) Envic dp-101s-pd2,
logger Grant 1000
3% of
reading ±0.2 m/s Classrooms 1 and 2 Continuous, 2 weeks (March 2017) Temperature (T) Rotronic CL11 ±0.3 °C Classrooms 1 and 2 Continuous (1–2 weeks)
Relative
humidity (RH) Rotronic CL11 ±3% (10 ... 95%) Classrooms 1 and 2 Continuous (1–2 weeks) Carbon dioxide (CO2) Rotronic CL11 ±(30 ppm +
5% of reading) Classrooms 1 and 2 Continuous (1–2 weeks) Figure 4. Supply air duct corridor and classroom-specific ducts’ terminal units in the basement.
Dampers are opened 20%, as designed.
After initial investigations, the proper remote control system adjustments were carried out by a competent company, and base ventilation was provided to the classrooms after an approximately two-year break.
Overall, the ventilation system was found to be complex and barely controllable [27]. The form of the supply air corridors (one straight and one angular) caused pressure loss and thus divided supply air unequally among the classrooms. Classrooms 1 and 2, the supply air ducts of which were located in the angular corridor and at the utmost from the air handling unit, seemed to have the least amount of supply air due to the pressure loss in the corridor. Furthermore, the classroom door positions affected the pressure relations throughout the whole building section. Thus, the hybrid ventilation system was shown to have some prerequisites for appropriate operation. Constant provision of the demanded supply air could be supported by some technical changes to the adjustments and control system.
2.3. Measurements in the School
In order to study the perceived and measured indoor air quality before (May 2016) and after (March 2017) the ventilation system improvements, a set of measurements were performed, mainly in Classrooms 1 and 2 where the occupants had reported the most severe symptoms and discomfort according to the Built Assets Management of City of Helsinki, and which were located most unfavorably in relation to the air handling unit. Classrooms 1 and 2 were next to each other, and could also be used as a combined space since there was a door in the partition. Additional measurements were conducted in the lobby and in some other classrooms in the section of the building under study.
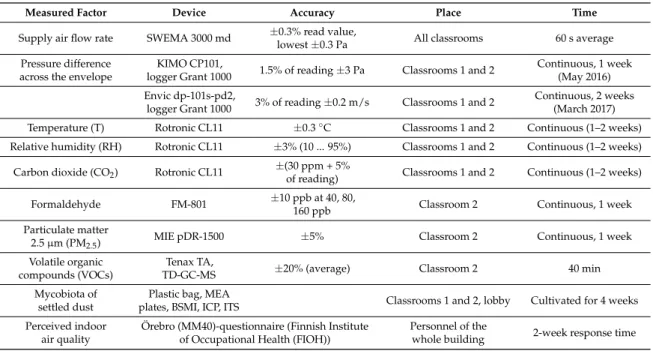
The measurement methods are presented in Table1.
Table 1.Measurement methods, devices, and their accuracy, measurement place, and duration.
Measured Factor Device Accuracy Place Time
Supply air flow rate SWEMA 3000 md ±0.3% read value,
lowest±0.3 Pa All classrooms 60 s average Pressure difference
across the envelope
KIMO CP101,
logger Grant 1000 1.5% of reading±3 Pa Classrooms 1 and 2 Continuous, 1 week (May 2016) Envic dp-101s-pd2,
logger Grant 1000 3% of reading±0.2 m/s Classrooms 1 and 2 Continuous, 2 weeks (March 2017) Temperature (T) Rotronic CL11 ±0.3◦C Classrooms 1 and 2 Continuous (1–2 weeks) Relative humidity (RH) Rotronic CL11 ±3% (10 ... 95%) Classrooms 1 and 2 Continuous (1–2 weeks)
Carbon dioxide (CO2) Rotronic CL11 ±(30 ppm + 5%
of reading) Classrooms 1 and 2 Continuous (1–2 weeks)
Formaldehyde FM-801 ±10 ppb at 40, 80,
160 ppb Classroom 2 Continuous, 1 week
Particulate matter
2.5µm (PM2.5) MIE pDR-1500 ±5% Classroom 2 Continuous, 1 week
Volatile organic compounds (VOCs)
Tenax TA,
TD-GC-MS ±20% (average) Classroom 2 40 min
Mycobiota of settled dust
Plastic bag, MEA
plates, BSMI, ICP, ITS Classrooms 1 and 2, lobby Cultivated for 4 weeks Perceived indoor
air quality
Örebro (MM40)-questionnaire (Finnish Institute of Occupational Health (FIOH))
Personnel of the
whole building 2-week response time
2.3.1. Air Flow Rates and Pressure Differences across the Building Envelope
Air flow rates were measured as instant measurements before and after the improvement.
Damper positions were controlled by increasing CO2concentrations in the classrooms.
Pressure differences across the building envelope were measured in Classrooms 1 and 2 continuously for one week before, and two weeks after the ventilation improvement. A plastic tube with a copper core was placed outside by a window that was not normally open. A measurement device and logger were placed inside near the window.
2.3.2. Indoor Air Quality (IAQ) Measurements
Temperature (T), relative humidity (RH), and CO2concentrations were measured in Classrooms 1 and 2 for a one-week period before, and a two-week period after the ventilation improvement.
Measurement devices were placed on the teacher’s desk in the front of the room, away from the teacher’s breathing zone when seated and as close to the horizontal central area of the room as possible.
Volatile organic compounds (VOCs) were measured in Classroom 2 before and after the ventilation improvement. VOC sampling and analysis were carried out according to the ISO 16000-6 standard [29].
Air samples were taken from the central area of an empty, closed room in the main working zone at a height of 1.5 m. Samples were collected in stainless steel tubes (Markes International Ltd., Llantrisant, UK) packed with Tenax TA (60/80 mesh) and Tenax TA-Carbograph 5TD using GilAir Plus air sampling pumps (Sensidyne, St. Petersburg, FL, USA) at a flow rate of 200 mL/min for 40 min.
Before ventilation improvement, VOC-analyses were conducted at Aalto University, and after improvement, they were conducted at the Finnish Institute of Occupational Health (FIOH) due to reorganization of the project resources. In the Aalto University analysis, total volatile organic compounds (TVOCs) and single compounds with concentrations over 1 µg/m3 were analyzed, while in the FIOH analysis, concentrations less than 1µg/m3were also covered. At Aalto University, the samples were desorbed using a thermal desorption unit (TD-100, Markes International Ltd.) and analyzed using a gas chromatograph (Clarus 580, Perkin-Elmer Ltd., Beaconsfield, UK) equipped with a Clarus 600T (Perkin-Elmer Ltd.) mass selective detector. VOCs were quantified by the scan (50–400m/z) mode. TVOC concentrations were determined from TVOC area (n-hexane to n-hexadecane) and calculated as toluene equivalents, and concentrations of the individual compounds were calculated either using pure reference compounds or as toluene equivalents. The concentrations
of single compounds were also determined from the chromatogram before and after the TVOC area.
In the case of such compounds, the quantitative results were as indicative.
Reference compounds (Indoor Air Standard, 50 components, 49148-U, Sigma-Aldrich, St. Louis, MO, USA) and the NIST 2011 Mass Spectral Library automated mass spectral deconvolution and identification system (AMDIS) were used for identification during the analysis at Aalto University, while at FIOH, where samples collected using Tenax TA-Carbograph 5TD steel tubes were analyzed, the Wiley database was also used. The detection limit was 0.2 µg/m3 (not included in sum concentration).
The formaldehyde concentration of indoor air was measured using an FM-801 formaldehyde meter (GrayWolf Sensing Solution, Sheldon, IA, USA). Fine particulate matter (PM2.5) was measured using a MIE pDR-1500 (Thermo Fisher Scientific, Franklin, MA, USA) nephelometer equipped with a PM2.5 size-selective inlet cyclone. Formaldehyde and PM2.5 were measured continuously for a one-week period before the ventilation in Classroom 2 was improved, in order to determine the indoor conditions while the ventilation system was dysfunctional. Measurement devices were placed in the back of the room at a height of 1.5 m and as close to the central area of the room as possible.
2.3.3. Characterization of Mycobiota in Indoor Dust
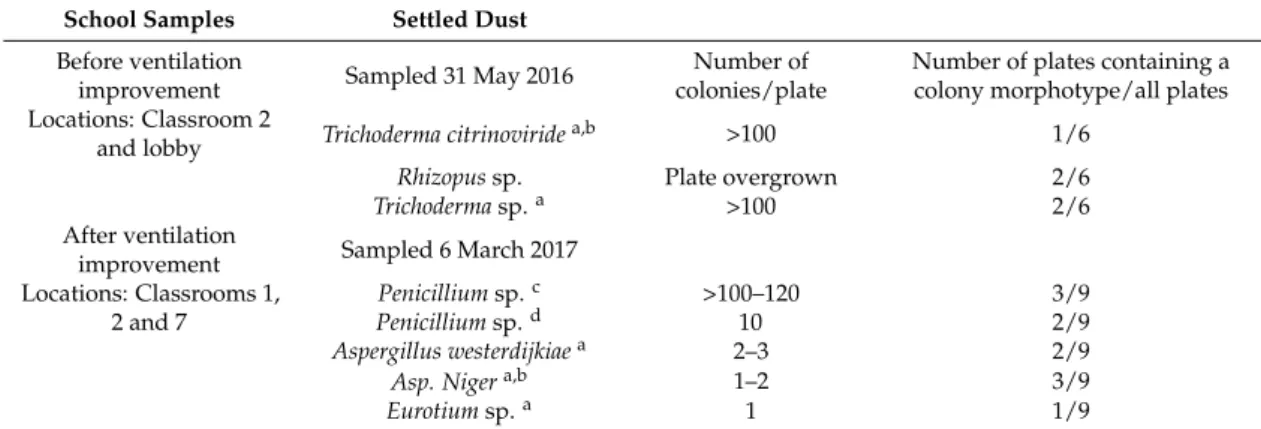
Mycobiota in indoor dust was obtained from the settled dust collected from Classrooms 1 and 2 and the lobby before the ventilation improvement (May 2016) and 10 months after the improvement (March 2017). These mycobiota were characterized in three stages, as described previously [18]:
sampling of dust, rapid toxicity screening of single colonies, and characterization and identification of the fungal isolates.
Dust samples were wiped into a clean plastic bag (Minigrip: Amerplast, Tampere, Finland) from ca. 30×30 cm2surfaces 1–2 m above floor level. The dust (ca. 10 mg) was spread with a sterile cotton swab onto malt extract agar (MEA) plates (malt extract 15 g: Sharlab, Barcelona, Spain; agar 12 g:
Amresco, Solon, OH, USA, in 500 mL of H2O). Culture plates were inoculated, sealed, and cultivated at 22◦C for four weeks.
For initial toxicity screening, 10–20 mg of biomass (wet weight) from each colony of the original culture plates was looped into 0.2 mL of ethanol and heated in a water bath for 10 min at 80◦C.
The obtained ethanolic lysates were exposed to porcine spermatozoa and kidney tubular epithelial cells (PK-15, Finnish Food Safety Authority, EVIRA, Helsinki, Finland). The lysate was considered toxic when 2.5 vol % decreased boar sperm motility or 5 vol % decreased proliferation of PK-15 cells by
>50% compared to the sham-exposed control. Boar sperm motility inhibition assay (BSMI) measuring motility inhibition (i.e., inability of resting sperm cells exposed for one day at room temperature to respond to induction of motility) was performed according to Andersson et al. [30]. The inhibition of cell proliferation (ICP) assay with PK-15 cells and determination of EC50concentrations followed the methods described by Bencsik et al. [31]. Colonies that displayed toxicity were pure-cultured and identified to the genus or species level.
Fungal colonies were grouped into eight morphotypes based on their morphology on MEA, ability to grow at 37◦C, light microscopy results for conidia and conidiophores, and responses in the two toxicity assays, BSMI and ICP. The isolates were compared to the reference strains from the HAMBI culture collection or identified according to the process described by Samson et al. [32].
A representative of the morphotype of toxigenicTrichodermaable to grow at 37◦C was identified by the sequence analysis of the ribosomal RNA gene cluster’s internal transcribed spacer (ITS) region [33].
2.3.4. Indoor Air Questionnaire
Indoor air-related symptoms and discomfort of the occupants were recorded with the standardized Indoor Air Questionnaire of FIOH twice during the research: in May 2016 (before the ventilation improvement) and in January 2017 (after 6 months of working in the building after the improvement).
The questionnaire was based on the Örebro Indoor Climate Questionnaire (MM40) [34].
In the questionnaire, respondents were asked to recall environmental problems that had occurred during the past three months. It consisted of four different sections: (1) work environment; (2) work arrangements; (3) allergy history of the employees; and (4) work-related symptoms. The reference data used in FIOH when evaluating the results of this questionnaire are based on the data collected from 122 workplaces in Finland [35,36]. Because of the selected type of the questionnaire as well as the available resources and existing permits, we decided to involve employees and to exclude students from the questionnaire survey.
Employees working throughout the school were requested to participate during the two weeks allotted for responses. The principal of the school was responsible for delivering the questionnaires to the employees, and FIOH collected and reported the answers. Since comparison with the mechanically ventilated section would be misleading, only the questionnaire results from the two hybrid-ventilated building sections are discoursed in this paper.
Potentially significant differences between the two questionnaires were analyzed at Aalto University by SPSS statistical software (SPSS Finland Oy, Espoo, Finland) with a chi-squared test.
3. Results and Discussion
3.1. Air Flow Rates and Pressure Differences across the Building Envelope
During the initial operation of the ventilation system, the base supply air flow rate in the classrooms was 0 L/s. After inspections and adjustments, the ventilation system was shown to provide sufficient air flow rates. In Classroom 2, the supply air rate was approximately 72–112 L/s (minimum-maximum), and 4.8–7.4 L/s/person when occupancy was estimated to be 15 persons.
According to national regulations [37], the minimum requirement is 6 L/s/person, which was met with maximum supply air rate even in the classrooms located most adversely in relation to the air handling unit.
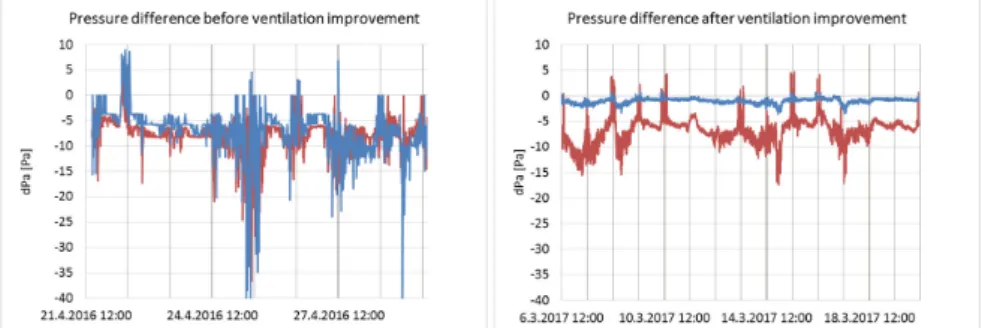
Pressure differences across the building envelope in Classrooms 1 and 2 before and after the ventilation improvement are shown in Figure5.
Int. J. Environ. Res. Public Health 2018, 15, x FOR PEER REVIEW 9 of 18
Potentially significant differences between the two questionnaires were analyzed at Aalto University by SPSS statistical software (SPSS Finland Oy, Espoo, Finland) with a chi-squared test.
3. Results and Discussion
3.1. Air Flow Rates and Pressure Differences across the Building Envelope
During the initial operation of the ventilation system, the base supply air flow rate in the classrooms was 0 L/s. After inspections and adjustments, the ventilation system was shown to provide sufficient air flow rates. In Classroom 2, the supply air rate was approximately 72–112 L/s (minimum-maximum), and 4.8–7.4 L/s/person when occupancy was estimated to be 15 persons.
According to national regulations [37], the minimum requirement is 6 L/s/person, which was met with maximum supply air rate even in the classrooms located most adversely in relation to the air handling unit.
Pressure differences across the building envelope in Classrooms 1 and 2 before and after the ventilation improvement are shown in Figure 5.
Figure 5. Pressure differences across the envelope in Classrooms 1 (red) and 2 (blue) before and after the ventilation improvement.
Before the ventilation improvement, pressure differences varied between −47.1 and 8.9 Pa and between −36.7 and 6 Pa (averages: −7.0 and −7.9 Pa) in Classrooms 1 and 2, respectively. Negative pressures might have enabled infiltration through the building envelope (e.g., from the crawl space or from the wall structures). The pressure differences were more stable after ventilation improvement, especially in Classroom 2, varying between −3.6 and 0.7 Pa (average: −1.0 Pa).
Fluctuations decreased also in Classroom 1, but less significantly, remaining in between −17.5 and 4.7 Pa (average: −6.8 Pa). Classroom 1 was the last one in the ventilation supply air corridor, therefore receiving less supply air, which explains higher negative pressure.
In momentary test measurements with several variations of supply air rate and door positions, a positive pressure difference of approximately 6–8 Pa across the envelope occurred in the lobby and in Classrooms 6 and 7 (see Figure 1). Overall, the classroom door positions and classroom-specific supply air rates affected the pressure difference conditions in each room of the building section, thus making the system unstable and difficult to control. This might have caused the variation in the one- week pressure difference measurement results in Classrooms 1 and 2 after ventilation improvement (Figure 5). The occupancy rate and opening of doors and windows in the studied classrooms during measurements are not known.
3.2. IAQ Measurements
The T, RH, and CO2 of indoor air before and after the ventilation improvement during the entire measurement period are presented in Figure 6.
Figure 5.Pressure differences across the envelope in Classrooms 1 (red) and 2 (blue) before and after the ventilation improvement.
Before the ventilation improvement, pressure differences varied between−47.1 and 8.9 Pa and between−36.7 and 6 Pa (averages:−7.0 and−7.9 Pa) in Classrooms 1 and 2, respectively. Negative pressures might have enabled infiltration through the building envelope (e.g., from the crawl space or from the wall structures). The pressure differences were more stable after ventilation improvement, especially in Classroom 2, varying between−3.6 and 0.7 Pa (average:−1.0 Pa). Fluctuations decreased also in Classroom 1, but less significantly, remaining in between−17.5 and 4.7 Pa (average:−6.8 Pa).
Classroom 1 was the last one in the ventilation supply air corridor, therefore receiving less supply air, which explains higher negative pressure.
In momentary test measurements with several variations of supply air rate and door positions, a positive pressure difference of approximately 6–8 Pa across the envelope occurred in the lobby and in Classrooms 6 and 7 (see Figure1). Overall, the classroom door positions and classroom-specific supply air rates affected the pressure difference conditions in each room of the building section, thus making the system unstable and difficult to control. This might have caused the variation in the one-week pressure difference measurement results in Classrooms 1 and 2 after ventilation improvement (Figure5). The occupancy rate and opening of doors and windows in the studied classrooms during measurements are not known.
3.2. IAQ Measurements
The T, RH, and CO2of indoor air before and after the ventilation improvement during the entire measurement period are presented in Figure6.
Int. J. Environ. Res. Public Health 2018, 15, x FOR PEER REVIEW 10 of 18
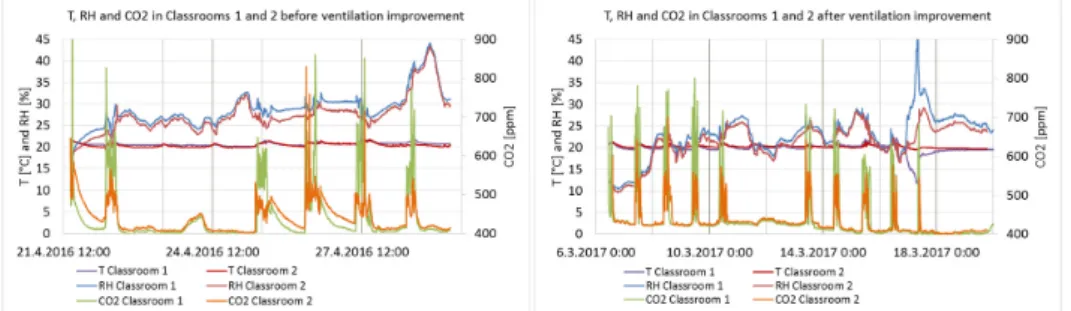
Figure 6. T, RH, and CO2 of indoor air in Classrooms 1 and 2 before and after the ventilation improvement.
The T, RH, and CO2 of indoor air during school occupancy hours from 8 a.m. to 5 p.m. with directional monthly outdoor temperatures are presented in Table 2. The outdoor data derived from the open access statistics of the Finnish Meteorological Institute, measured at a weather station approximately 6 km from the school.
Table 2. Minimum, maximum and average values of RH, T, and CO2 in Classrooms 1 and 2, during 8 days before and 14 days after the ventilation improvement during school occupancy hours from 8 a.m. to 5 p.m., and outdoor temperatures per month in question.
Classroom 1 Classroom 2 Outdoor, Per Month * RH (%) T (°C) CO2 (ppm) RH (%) T (°C) CO2 (ppm) T (°C) Before Min 18 20 394 16 20 402 −1.4
Max 40 22 1431 38 22 829 13.7
Average 29 21 488 27 21 458 4.9 After Min 11 12 394 10 20 400 −7.8
Max 46 22 801 29 21 700 11.9
Average 23 20 464 22 20 450 1.0
* Finnish Meteorological Institute.
The maximum CO2 concentrations according to the Finnish Classification are 750 ppm for Category I, 950 ppm for Category II, and 1200 ppm for Category III [38]. The stability of the conditions must be 90% for Categories I and II. Category I is defined as the best possible IAQ, Category II as good IAQ, and Category III as the minimum requirement according to the Finnish regulations. The importance of sufficient ventilation and low CO2 levels, especially in school environments, is widely recognized [3]. Lack of base ventilation in the classrooms before the ventilation improvement was not clearly reflected in the CO2 concentrations because of the temporary air dilution caused by the CO2 sensors. However, when tested by the independent two-sample t-test (2-tailed), the difference in CO2 concentrations before and after the ventilation improvement is statistically extremely significant at the 100% confidence interval (p = 0.000 in Classroom 1, 387 and 740 measurement points; p = 0.008 in Classroom 2, 387 and 718 measurement points). Temperatures were stable and at a target level, approximately 21 °C. The meteorological conditions were only slightly differing during the measurement periods.
TVOC concentration was higher before the ventilation improvement (71.5 μg/m3) compared to concentration after improvement (10 μg/m3); the decrease was 86%. Except for acetone (2 μg/m3 before and 7 μg/m3 after improvement), single VOC concentrations decreased: decanal and nonanal (2 μg/m3 before and 1 μg/m3 after improvement), benzaldehyde (2 and 0.9 μg/m3), acetic acid (2 and 0 μg/m3), and in particular toluene (25 and 6 μg/m3) and decamethylcyclopentasiloxane (15 and 0 μg/m3). Typical sources for these compounds include building materials, coverings, as well as cleaning and cosmetic products [39,40]. Although TVOC and VOC concentrations were well below the national action values mentioned in the Decree of the Ministry of Social Affairs and Health on Figure 6. T, RH, and CO2 of indoor air in Classrooms 1 and 2 before and after the ventilation improvement.
The T, RH, and CO2 of indoor air during school occupancy hours from 8 a.m. to 5 p.m.
with directional monthly outdoor temperatures are presented in Table2. The outdoor data derived from the open access statistics of the Finnish Meteorological Institute, measured at a weather station approximately 6 km from the school.
Table 2.Minimum, maximum and average values of RH, T, and CO2in Classrooms 1 and 2, during 8 days before and 14 days after the ventilation improvement during school occupancy hours from 8 a.m.
to 5 p.m., and outdoor temperatures per month in question.
Classroom 1 Classroom 2 Outdoor, Per Month *
RH (%) T (◦C) CO2(ppm) RH (%) T (◦C) CO2(ppm) T (◦C)
Before Min 18 20 394 16 20 402 −1.4
Max 40 22 1431 38 22 829 13.7
Average 29 21 488 27 21 458 4.9
After Min 11 12 394 10 20 400 −7.8
Max 46 22 801 29 21 700 11.9
Average 23 20 464 22 20 450 1.0
* Finnish Meteorological Institute.
The maximum CO2 concentrations according to the Finnish Classification are 750 ppm for Category I, 950 ppm for Category II, and 1200 ppm for Category III [38]. The stability of the conditions must be 90% for Categories I and II. Category I is defined as the best possible IAQ, Category II as good IAQ, and Category III as the minimum requirement according to the Finnish regulations.
The importance of sufficient ventilation and low CO2 levels, especially in school environments, is widely recognized [3]. Lack of base ventilation in the classrooms before the ventilation improvement was not clearly reflected in the CO2concentrations because of the temporary air dilution caused by the CO2sensors. However, when tested by the independent two-samplet-test (2-tailed), the difference in CO2concentrations before and after the ventilation improvement is statistically extremely significant
at the 100% confidence interval (p= 0.000 in Classroom 1, 387 and 740 measurement points;p= 0.008 in Classroom 2, 387 and 718 measurement points). Temperatures were stable and at a target level, approximately 21◦C. The meteorological conditions were only slightly differing during the measurement periods.
TVOC concentration was higher before the ventilation improvement (71.5µg/m3) compared to concentration after improvement (10µg/m3); the decrease was 86%. Except for acetone (2µg/m3 before and 7µg/m3after improvement), single VOC concentrations decreased: decanal and nonanal (2µg/m3 before and 1µg/m3 after improvement), benzaldehyde (2 and 0.9µg/m3), acetic acid (2 and 0µg/m3), and in particular toluene (25 and 6µg/m3) and decamethylcyclopentasiloxane (15 and 0 µg/m3). Typical sources for these compounds include building materials, coverings, as well as cleaning and cosmetic products [39,40]. Although TVOC and VOC concentrations were well below the national action values mentioned in the Decree of the Ministry of Social Affairs and Health on health-related conditions of housing and other residential buildings [41], some single VOC concentrations (toluene, decamethylcyclopentasiloxane) measured before the ventilation improvement exceeded the limit values recommended by FIOH [42]. If the recommended limit value is exceeded, it may indicate the existence of an exceptional source and the need for additional environmental investigations [42]. Altogether, the ventilation improvement had a positive effect on VOC concentrations.
The formaldehyde concentration was below 10 ppb (equivalent to approx. 12µg/m3), which is the detection limit of the meter. The PM2.5 concentration varied between 0 and 17.6 µg/m3 (average 3.8µg/m3), which is below the national limit value of 25µg/m3[41]. The occupancy rate was low during the measurements because the semester was ending, approximately 15 persons for 1–4 h per day. Since the role of human-based sources was minimal, the measurements present well the building- and ventilation-related conditions.
3.3. Characterization of Mycobiota in Indoor Dust
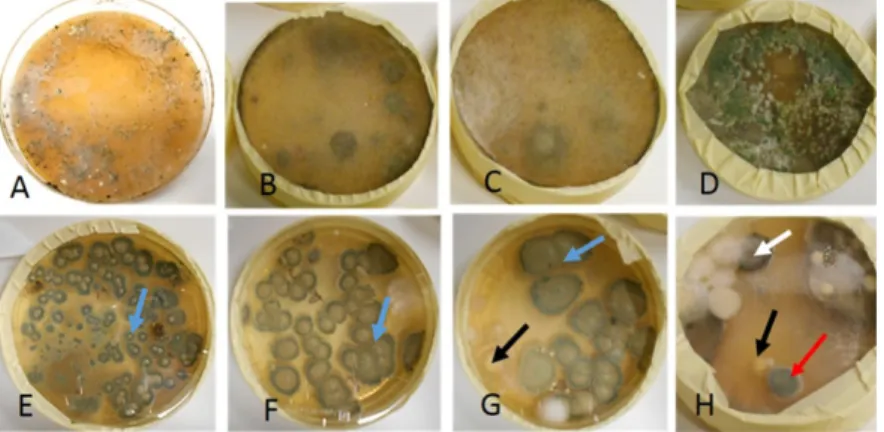
Diverse mycobiota cultivated in indoor settled dust was sampled before and after the ventilation improvement and visualized in Figure7.
Int. J. Environ. Res. Public Health 2018, 15, x FOR PEER REVIEW 11 of 18
health-related conditions of housing and other residential buildings [41], some single VOC concentrations (toluene, decamethylcyclopentasiloxane) measured before the ventilation improvement exceeded the limit values recommended by FIOH [42]. If the recommended limit value is exceeded, it may indicate the existence of an exceptional source and the need for additional environmental investigations [42]. Altogether, the ventilation improvement had a positive effect on VOC concentrations.
The formaldehyde concentration was below 10 ppb (equivalent to approx. 12 μg/m3), which is the detection limit of the meter. The PM2.5 concentration varied between 0 and 17.6 μg/m3 (average 3.8 μg/m3), which is below the national limit value of 25 μg/m3 [41]. The occupancy rate was low during the measurements because the semester was ending, approximately 15 persons for 1–4 h per day. Since the role of human-based sources was minimal, the measurements present well the building- and ventilation-related conditions.
3.3. Characterization of Mycobiota in Indoor Dust
Diverse mycobiota cultivated in indoor settled dust was sampled before and after the ventilation improvement and visualized in Figure 7.
Figure 7. Fungal colonies cultivated from settled dust sampled before (upper row) and after (lower row) the ventilation improvement. Panels (A–C,E–G) are cultures from dust samples collected from Classroom 2. Panel (D) is a culture from dust collected in the lobby, while Panel (H) is a dust culture from Classroom 1. The dust samples were cultivated on MEA and incubated for four weeks at room temperature. The plates in Panels (A,D) contained over 100 green, Trichoderma-like colonies. Colonies in Panel D overgrew the other fungal colonies within two weeks of incubation indicating potential mycoparasitism. The plates in Panels (B,C) were overgrown with Rhizopus-like colonies. The plates in the lower row (Panels (E–H)) contained mainly green Penicillium colonies (blue arrow). The plates in Panels (G,H) contained yellow Aspergillus colonies (black arrow), a black Aspergillus colony (white arrow), and a green Eurotium/Aspergillus colony (red arrow).
The toxic and pathogenic morphotype of the green colonies dominating the plate shown in Panel A of Figure 7 was identified as Trichoderma citrinoviride. The rhizoid morphotype in Panels B and C was nontoxic Rhizopus sp. unable to grow at 37 °C. The toxic Trichoderma sp. colonies in Panel D differed from T. citrinoviride due to a lack of ability to grow at 37 °C and association with globous conidia. The dominant morphotypes in Panels E–H were represented by a terverticilliate nontoxic Penicillium sp. and a nontoxic monoverticilliate Penicillium sp. Sporadic toxigenic, black, yellow, and light green colonies in Panels G and H were identified as fungi belonging to Aspergillus section Nigri, Aspergillus westerdijkiae, and Eurotium sp., respectively. Fungal colonies representing the dominant
Figure 7.Fungal colonies cultivated from settled dust sampled before (upper row) and after (lower row) the ventilation improvement. Panels (A–C,E–G) are cultures from dust samples collected from Classroom 2. Panel (D) is a culture from dust collected in the lobby, while Panel (H) is a dust culture from Classroom 1. The dust samples were cultivated on MEA and incubated for four weeks at room temperature. The plates in Panels (A,D) contained over 100 green,Trichoderma-like colonies.
Colonies in Panel D overgrew the other fungal colonies within two weeks of incubation indicating potential mycoparasitism. The plates in Panels (B,C) were overgrown withRhizopus-like colonies.
The plates in the lower row (Panels (E–H)) contained mainly greenPenicilliumcolonies (blue arrow).
The plates in Panels (G,H) contained yellowAspergilluscolonies (black arrow), a blackAspergillus colony (white arrow), and a greenEurotium/Aspergilluscolony (red arrow).