Comparison of thermal insulation performance of vacuum insulation panels with EPS protection layers measured with different methods
Ákos Lakatos
a,⇑, Zsolt Kovács
baUniversity of Debrecen, Faculty of Engineering, Department of Building Services and Building Engineering, H-4028 Debrecen Ótemet}o str. 2-4., Debrecen, Hungary
bINOX-THERM Kft, 1054 Budapest, Honvéd str. 8. 1. em 2, Hungary
a r t i c l e i n f o
Article history:
Received 27 August 2020 Revised 3 January 2021 Accepted 19 January 2021 Available online 2 February 2021
Keywords:
Hot box method U-value
Vacuum insulation panels Thermal insulation
a b s t r a c t
For reducing the energy use of buildings, the application of insulation materials can be a possible solution to improve energy efficiency. However, with the continuously tightening regulations, thicker and thicker insulations should be used (e.g., up to 20–25 cm in Hungary and about 40–50 cm in the Nordic countries) to fulfil the directives. In the past decades, developmental research started to focus on both decreasing the thickness and decreasing the thermal conductivity of materials parallels. With this research direction, the investigations of the new type of insulation materials took place. The use of materials having thermal conductivity with less than 0.020 W/mK spread over. These materials are the so-called super insulation materials. Besides Vacuum Insulation Panels (VIPs), aerogel-based materials belong to this group, too.
This paper will present laboratory tests executed on two altered types of protected Vacuum Insulation Panels: a one side and a 2 side protected VIP, also called Vacuum Insulation Sandwich (VIS). The first one, type ‘‘A” contains 20 mm thick laminated fumed silica, covered with 10 mm thick expanded poly- styrene on one side, while type ‘‘B” was the one where the 10 mm thick laminated fumed silica core was packed between two 10 mm thick EPS slabs. Firstly, thermal insulation performance was investi- gated by the so-called guarded hot-box method for U-value, where the samples were placed on a solid brick wall. Furthermore, the thermal insulation performance of protected VIPs was also tested with Hukseflux heat flux plates. To reveal the applicability limits caused by the thermal bridges infrared ther- mography images (IR) were taken, too. From the images and the measurement results, a theory was formed regarding the heat flow directions inside the encapsulated panels. The current article emphasizes the equivalent thermal conductivity for the assessment of the thermal protection performance of vacuum insulation panels. The paper states that by using VIPs at least, 70% reduction can be reached in the U- value compared to the value of the solid brick wall. Moreover, the paper points out that the use of EPS protection layer on both sides of the VIP has a promising effect by reducing the thermal bridges.
Furthermore, the VIP protected with EPS slabs on both sides results in less equivalent thermal conductivity.
Ó2021 The Author(s). Published by Elsevier B.V. This is an open access article under the CC BY license (http://creativecommons.org/licenses/by/4.0/).
1. Introduction
Nowadays, reducing significantly the energy consumption is an important issue for the building sector, but the reduction of energy use cannot neglect the thermal comfort requirements. Heating and cooling account for at least 40% of the final energy use of the Euro- pean Union. Moreover, it was predicted by the International Energy Agency (IEA) by the energy use of the countries all over the world could reach up the unwanted 50% until the year 2030[1–3]. That is why the application of thermal insulation materials in the build-
ings is very significant. Several types of insulation materials are available[4], but nowadays the use of super insulation materials (SIM) is also widespread, resulted in the development of the indus- try sector[5]. In cases where greater thickness (15~20 cm) cannot be used, materials with less thermal conductivity must be applied.
It is mentionable that there is no exact definition of SIMs but the IEA EBC Annex 65 ‘‘SIM” Subtask 1[6]defines the elements of these groups. According to this Annex, these materials are said to be the part of this group: (a) Vacuum Insulation Panels (VIP); (b) Advanced Porous Materials (APM), for example, different types of aerogels (monoliths or fibrous ones). Their most important prop- erty is the thermal conductivity, possibly less than 0.022 W/ mK [7]. These insulation materials are also called nanostructured materials, due to their nano-sized pore structure[6]. The applica- https://doi.org/10.1016/j.enbuild.2021.110771
0378-7788/Ó2021 The Author(s). Published by Elsevier B.V.
This is an open access article under the CC BY license (http://creativecommons.org/licenses/by/4.0/).
⇑Corresponding author.
E-mail address:alakatos@eng.unideb.hu(Á. Lakatos).
Contents lists available atScienceDirect
Energy & Buildings
j o u r n a l h o m e p a g e : w w w . e l s e v i e r . c o m / l o c a t e / e n b
tion limits of these mentioned materials are written in [8,9]but now the vacuum insulation panels will be in focus. VIPs are also said to be reasonable insulations. In these decades, VIPs have been used widely in the fields of building energetics and vehicle engi- neering as well as in industrial cases (refrigeration) caused by their notably low thermal conductivity. Recently manufactured samples can have less than 0.006 W/mK center of the panel (cop) thermal conductivity. However, unfortunately, VIPs have some undesirable properties as their aging is coupled with both their vulnerability and damageability. The process of manufacturing the vacuum panel thermal insulation is based on simple multi-step processes.
As a first step, the core material is compressed into a specific mold, which is used to displace all the air from the material. The thermal insulation performance of VIPs strongly depends on the core mate- rial. Generally, expanded perlite, glass wool, open-cell polyur- ethane foam, polystyrene foam, fumed or nano-silica powder are the most commonly used core materials. The next step in its pro- duction is to surround the material with a cover film (mechanical protective layer) designed to protect it from any dust or dirt. Then, they are dried slowly and then covered with an airtight aluminum foil and the two edges of which are glued together. The surface of the top layer should be wrinkled because if it is completely smoothed out it means that air has entered the system. In general, the bonding line is a critical point in vacuum panels, as molecules entering through the adhesive layer can degrade the degree of the vacuum. In addition to this, a so-called ‘‘getter” material is deliv- ered to the inside of the panel, which is primarily responsible for binding the incoming molecules[6]. The physical and structural properties of VIPs are clearly described by others. Alam and his col- league O’Flaherty in their papers highlighted that VIPs have rela- tively high costs and variability in their service time. One of the most important properties that they highlighted is the sensitivity of the outer layer to mechanical effects. Even the slightest damage can result in the reduction of the vacuum panel thermal insulation.
Risks of VIP damage, uncertain service life and thermal birding effect can be managed by careful handling, improved quality con- trol and improved designing of VIPs. Besides, Gaedtke and co- authors conclude from their research that VIPs could be a reason- able solution for reducing the thermal loss of refrigerated vehicles, too[10–12]. However, some applicability problems might appear during their lifetime e.g.: aging and thermal bridge effects see Ref.[13] by Wegger. Capozzoli with his colleagues also presents that vacuum panel thermal insulation has become a well-known material in the construction industry in recent years due to its energy-advantageous properties[14]. Vacuum panels are thermal insulation elements with predicted thermal conductivity of 0.0035–0.008 W/mK. From these values, it is clear that the low thermal conductivity is also an important criterion for the core material. Nevertheless, important properties for the core material are evacuability as well as pressure resistance. More investigations conducted by them on VIPs are presented in Ref.[15]. Authors in Ref.[16]Brunner and Simmler (2008) present the thermal bridge effects of different types of VIPs (staggered, non-staggered) as a result of laboratory measurements. They highlight that the thermal bridge effect characterizes the applicability limits of VIPs. Authors
in Ref.[17]Brunner and Ghazi Wakili (2014) propose that the mag- nitude of thermal bridges has a relationship with the thickness of the core material. It is further stated that an additional insulation layer can reduce this effect[18], but at the cost of additional thick- ness. Let me mention that it is also stated by Lorenzati and his col- leagues in Ref. [19]. A very interesting finding is presented by Johansson, after examining the service time of VIPs he emphasizes that VIPs are perfectly stable in the first five years[20]. Brunner and his colleagues made an extensive highlighting report on the future trends of insulation systems incorporating VIP’s [21].
MacLean in Ref.[22]and Berardi in Ref.[23]present that in cold climate countries Vacuum Insulate Panels could be a very good solution to reduce the thermal loss through the walls, resulted in an extreme, approximately50°C external temperature. Interest- ingly, Johansson, shows in real cases that by using VIPs for insulat- ing brick buildings about 64% reduction can be reached in the thermal transmittance [24]. This paper presents once thermal transmittance measurement results executed on two different types of sandwich (encapsulated/protected) panels: type ‘‘A” and type ‘‘B”. The first one contains 20 mm thick laminated fumed sil- ica and covered with 10 mm thick expanded polystyrene on one side, while type ‘‘B” was the one where the 10 mm thick laminated fumed silica core was packed between two 10 mm thick EPS. Singh also presents that fumed silica with opacifier are reasonable filling materials for VIPs[25]. Tenpierik in Ref.[26]highlights that the thermal bridges of the VIPs covered with expanded polystyrene can be decreased.
The main purposes of the current study are 1) to test the ther- mal insulation performance of sandwich panels with different methods; 2) to reveal the applicability limits caused by the thermal bridges; 3) to complete the thermal transmittance measurements with infrared thermography; 4) to state a theory regarding the heat flow directions inside the encapsulated panels; 5) to emphasize the equivalent thermal conductivity for the assessment of the thermal protection performance of vacuum insulation panels. In our opin- ion, previous papers did not focus strongly enough on how to reduce the edge thermal bridges perfectly in real applications. Dur- ing our tests, we applied complementary insulation with 2x2 cm thickness and wideness to reduce the thermal bridges by the junc- tions. Moreover, we would like to reveal the thermal insulation performance of two VIPs readily available on the market, under laboratory conditions. This paper complements previous research studies executed on VIPs. Here we show that laboratory experi- ments executed on materials to see the complex thermal insulation properties should be completed with calculations to know the application limits of the materials in proper building energetic examples. The results could be also good for designers, planners, developers and manufacturers.
2. Materials and methods 2.1. The tested material
As above mentioned, two encapsulated VIP sandwich panels were tested (seeFigs. 1a, 1b, 2a and 2b). The initial pressure inside Nomenclature
u heat flux [W/m2] P electric power [W]
A surface area [m2]
k thermal conductivity [W/mK]
U-value thermal transmittance [W/m2K]
T temperature [oK/oC]
h surface heat transfer coefficient [m2K/W]
R-value thermal resistance [m2K/W]
2
was 0.5 mbar, while the thickness of the laminate was 100mm, as the manufacturer declared. Both of them are available on the mar- ket for insulation materials and are purchasable to anyone. For the measurements, four pieces of each (A respective B) were used with 600600 mm2base area and were placed on the test wall as a 2x2 matrix (12001200 mm2). The reason for this was the following:
from the manufacturer, 4 pieces of ‘‘A” and ‘‘B” types of VIPs were ordered, with 600 mm600 mm base area of each. Due to the pos- sible uncertainty during the manufacturing of the samples 4 pieces of them were ordered not only one sample with 1200 mm 1200 mm. With the measurements where both the heat fluxes and the temperatures were measured at different points from the average values, we could reach the thermal prop- erties for the whole wall covered with VIPs [27]. As it is well known, besides the pronounceable physical vulnerability of the VIPs, their fixing is another negative attribution, due to the poten- tial additional thermal bridges. Thermal bridges between the edges (sides) of the panels cause hard problems both to planners and to implementers. In our case for reducing the heat loss through the 2D thermal bridges by the edges, the joint lines were covered with a 2 cm thick EPS layer with 2 cm width in a cross form. Here it has to be mentioned that the encapsulated panels were fixed on the wall only by using a conventional EPS glue with its EPS covered side. For this, we used a pre-mixed, one-component, cement- based, mineral, adhesive mortar for fixing. Our glue did not get in contact with the laminated side of the panel. But, here it has to be further mentioned that the glue might have influenced the performance of laminate, these kinds of results were presented by Garnier et al.[28]. But for reducing these effects we glued only the EPS side. The sandwich panels were prepared by the manufac- turer. Yrieix further stated that interactions between laminate and core and the thickness could have significance in service time[29].
Moreover, it is also stated by Pons and colleagues that laminate has a very important role in reducing the water vapor transport in VIPs and it is an unmissable part of it[30].
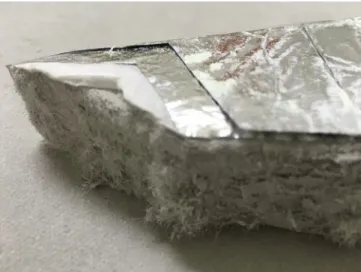
Figs. 3a and 3b present the tested material without the EPS cover layers. Above the core material first the non-woven textile for the handling and the laminate for the low aging and the low thermal bridge effect is visible, while in the microscope image from the core can be seen. The core material is fumed silica, which is, also called pyrogenic silica and contains silicon, oxygen and iron [27]. InFig. 3b the glass fibers and the fumed silica grains and nodes are also visible.
2.2. The test methods used
2.2.1. Determination of steady state thermal transmittance
The basics of the measurement orders are entirely presented in our previous papers [31–33], but now we will give a detailed explanation. To understand the appliances we should emphasize the key points of the procedures. The measurements both with the hot box method and with the Hukseflux apparatus were exe- cuted in the Building Physics Laboratory of the University of Debre- cen. The results from the data logging were taken after the system reaching the thermal equilibrium, steady state stage[31–33]. For measuring the thermal insulation performance of the materials an isolated (adiabatic) twin chamber was used. The walls of the chamber were built from and separated to two sides (warm-cold) with EPS with about compressive strength 200 (KPa). The thickness of the surrounding walls was 30 cm while the dividing wall’s thick- ness between the cold and the warm side was 50 cm (seeFig. 4).
The chillers (three separated cryogenics) were able to cool down the (cold) room to 250 K. A portable radiator at the warm side was used to increase the temperature. These two rooms were sep- arated, and in the middle of the separating EPS divider with 0.35 m Fig. 1a.Type A” VIP (photo image).
Fig. 1b.Type A” VIP (sketch).
Fig. 2a.Type B” VIP (photo image).
over the ground and with 0.35 m under the ceiling, a window could be found filled with solid brick. The thickness of this was 0.25 m and it’s base area was A = 1.44 m2. The wall was covered with 0.015 m thick interior plaster on both sides. In our case, the type
‘‘A‘‘ insulation covered this brick wall firstly, and later ‘‘B” type of VIPs were tested.
2.2.2. Thermal transmittance measurements through hot box method During the measurements with the guarded hot box method, we followed the directions of the ISO 8990:1994, (Thermal insula- tion, determination of steady-state thermal transmission proper- ties, calibrated and guarded hot box standard), where the temperatures are measured with calibrated Pt-100 thermocouples.
The calibration of the Pt sensors was executed by the Energotest ltd in Hungary. Moreover, measuring the electric energy of both the heater and the ventilator is measured by two certified electric meters by the electricity supplier. With this equipment about ± 5%
uncertainty can be expected[34]. The measurement set-up can be seen on the left hand side ofFig. 4. For this measurement method, one of the key points is the temperature measurements. For the exact measurement of the wall temperatures, 4x4 = 16 pieces of calibrated Pt-100 thermocouples were used, while for registering the air temperature further 4 sensors were used. Here it has to be mentioned that this temperature measurement order was the same at both sides (warm and cold, seeFig. 5a).
The temperatures were registered with data loggers and the results were analyzed with box chart statistic procedure further- more, on the results descriptive statistics were executed, too. As it is visible, the air was circulated at both sides with a fan. More- over, the hot box on the warm side was heated with a conventional light bulb, and the energy used for the heating was measured with a calibrated and certified electronic meter. For measuring the used energy of the ventilator at the warm side, another meter was applied. From the differences of the measured surface (in 16 points at both sides) and air temperatures (in 4 points at both sides) DTwall(=Tinternal,surface-Texternal,surface) andDTair(=Tinternal,air-Texternal, air) (in K) were calculated after reaching the equilibrium (in steady-state stage). The temperature data were registered with Pt-100 thermocouples. From the energy measured by the meters (in kWh) and from the operating time (t in h) an average power (P in W) can be calculated. All the measurement orders were the same as written in the latest papers of the authors[30–33].
2.2.3. Thermal transmittance measurements through direct heat flux measurements
The situation for measuring the heat flux passing through the wall directly is visible on the right hand side ofFig. 4. During this kind of test row the hot box was pulled down from the wall and the fans both at the warm and the cold sides were turned off. Hukse- flux (HF) HFP01 heat flux plate with a ceramics-plastic composite body and having 8104m2sensing area, measured the amount of the heat passing through the wall. This equipment works according to regulations of the ISO 9869-1:2014 (thermal insula- tion building elements, in-situ measurement of thermal resistance
and thermal transmittance, Part 1: Heat flow meter method stan- dard.) For the measurements, two heat flux sensors were fixed on the wall, but to collect heat flux data from the entire wall, their positions were changed during the measurements (see Fig. 5 a and b). Furthermore, two pairs of (Pt-100) temperature sensors belong- ing to this equipment were used for measuring the temperatures at both the cold and the warm sides. First, the position of these sen- sors was modified during the equilibrium state. Once, their posi- tion both on the cold and the warm side was on the wall at three different arrangements (seeFig. 5b), so we could reach the surface temperatures of the wall as the average of the (3x2 = ) 6 tempera- ture values. Secondly, the temperature sensors were removed from the wall and were used to measure the air temperatures, without interconnection with the wall and at the cold side, the same posi- tions and arrangements were used. Here has to be mentioned that the Hukselfux equipment was calibrated by the manufacturer.
Under ideal conditions, measurements of heat flux in building phy- sics may attain uncertainties in the ±6% range[30–33].
InFig. 5cone can see the cold side of the test wall covered with the 4 pieces of VIPs, furthermore, the 2x2 cm (thick and wide) EPS stripes for lower 2D thermal bridges are also visible.
By using both methods (hot box and Hukseflux equipment) the thermal resistance (R-value, in m2K/W) of the wall can be esti- mated by using the following equations,
Rwall m2K=W
¼DTwallA=P¼DTwall=U ð1Þ where/is the measured heat flux and Rwallrepresents the thermal resistance of the wall structure. If we use the air temperature differ- ences instead of the wall’s surface temperature differences, we will reach the next equation:
Rtot m2K=W
¼DTairA=P¼DTair=U
¼ð1=hiÞ þðRwallÞ þð1=heÞ ð2Þ where Rtotis the total R-value moreover, hiand he(in m2K/W) are the internal and external surface heat transfer coefficients, respec- tively. As above mentioned P (in W) was the average measured power in the case of the HB method, while with the HF method/ (W/m2) as the heat flux was directly measured by the HF plates.
Moreover, A = 1.44 m2is the base area of the test wall. Furthermore, from the above-calculated values one can calculate the overall ther- mal transmittance (U-value in W/m2K) as:
U W=m2K
¼1=Rtot ð3Þ
To find the effective thermal conductivity of a layer (insulation) on a base wall, the following equation can be used:
klayerðW=mKÞ ¼dlayer= RlayerþbrickwallRbrickwall
ð4Þ
where dlayer(m) is the thickness of the covering (insulation) layer, Rlayer+brickwall is the resistance of the insulated brick wall, while the resistance of the pure brick wall is Rbrickwall.
Fig. 2b.Type B” VIP (sketch).
4
3. Results and discussion
3.1. Thermal transmittance results from the guarded hot box method Thermal transmittance measurements were executed firstly, by the hot box method. The temperature values were registered after the steady state stage. In Tables 1a and 1b, the measurement results as well as the calculated values are presented. Firstly, from Eq. 1–2, the resistance of the covered and uncovered walls was cal- culated first, by using the wall surface temperatures (Rwall) and then from air temperatures (Rtot). In these tables, data belonging both to the single brick base wall and the insulated wall are high- lighted. From the total thermal resistances, the U-values were esti- mated by Eq.(3). In Table 1athe calculated percentile (relative) errors belonging to the temperature measurements are high- lighted, too. Firstly, the surface temperature of the wall was mea- sured at 16 points, while in parallel the temperature of the air was measured at 4 points with the Pt-100 sensors on both sides. Both the average of each temperature and their absolute deviances from the mean values, belonging to the wall surface and air, were calcu- lated and half of the absolute deviances from this value were also given. Then the ratio of these two gave the estimated errors in percent.
Fig. 3a.VIP core with the layers (non-woven fabric and (silvery) laminate).
Fig. 3b.VIP core Microscope image (in M~40x). The core consists of pyrogenic silica, fibers and opacifier.
Fig. 4.Measurement order for the hot box method (HB) (left) and the Hukseflux equipment (HF) (right).
Fig. 5a.The PT 100 temperature sensors for the HB method and heat flux sensors with the thermocouples (on the heated side of the wall).
From the thermal resistance of the brick wall and the covered ones we have found the resistance of the encapsulated (protected) panels (type ”A” and ‘‘B”), as:
Rprotected VIP m2K=W
¼RBrickwallþprotected VIP RBrick wall ð5Þ
Rprotected VIP m2K=W
¼REPSþRVIP coreþlaminate ð6Þ
where REPS W=m2K
¼dEPS=kEPS ð7Þ
By using the thicknesses of the EPS (1 cm and 2 cm) as well as measured thermal conductivity (0.037 W/mK) the equivalent thermal conductivity of the VIP core with the laminate (VIP envel- ope) can be found both from the air and the wall temperatures. Let me mention here that besides the VIPs, EPS slabs were also ordered from the manufacturer, with a 3030 cm base area. Furthermore, the thermal conductivity of the EPS samples was measured by Holometrix type Lambda 2000 heat flow meter and the results were presented earlier in a paper of the Authors[27].
From Eq. (5) and (6)we can deduce the resistance of the VIP core with the laminate,as:
RVIP coreþlaminate W=m2K
¼Rprotected VIP REPS ð8Þ
Moreover, by using the next equation
kVIP coreþlaminateðW=mKÞ ¼dVIP coreþlaminate=RVIP coreþlaminate ð9Þ the equivalent thermal conductivities were reached to be 0.0125 and 0.0094 W/mK belonging to type ‘‘A” and type ‘‘B”
respectively (see Table 1b), for the case of VIP core + laminate including the edge effect. Let me mention that the edge effect was counted in the thermal conductivity. Moreover, as it was men- tioned above that besides the 2x2 cm (thick and wide) EPS stripes for lower 2D thermal bridges were also used by the edges.
3.1.1. Descriptive statistics on the measured values from the hot box method
On the measured temperature results, descriptive analysis was executed with a box chart statistic procedure to graphically depict the temperature (numerical) data through their quartiles. The data statistics were executed by the box chart statistical analysis plug- in of a data analysis software. During this statistical analysis mean values, standard deviances, sum, minimum and maximum values, and also the median, the first quartile and the third quartile were also plotted. InFigs. 6a to 6cthe results of the statistical analysis are plotted. From the figures, one can see only minimal statistical deviations among the temperature rows.
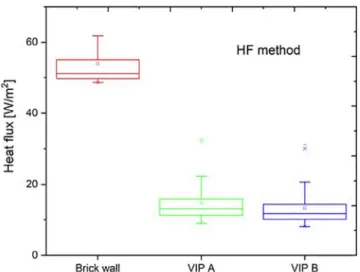
3.2. Thermal transmittance results with the Hukseflux equipment Similarly, as presented in section 3.1. the measurements were also executed with the Hukseflux equipment after removing the hot box from the heated side (seeFig. 4). Moreover, in this case the air circulation was applied neither at the heated nor at the cold side. FromTable 2ait is visible that the measured heat fluxes after covering the brick wall with both VIPs are reduced significantly, while the wall temperature differences were increased with the use of the panels. We showed greater insulation capability by the use of type A” VIP. The average of each temperature (wall, air) from the measured values as well as the averages of the heat fluxes were calculated. Moreover, from the deviances of the average values, half of the absolute deviances from these values were also added.
The order and the positions of the heat flux plates (presented in Fig. 5b.Three positions of the pair of temperature sensors and the pair of HF
sensors under one steady state measurement (on the heated side of the wall) at measuring phases a) and b) 3a) is at the point thermal bridge and later at 3b) at the linear thermal bridge.
Fig. 5c.The sketch of the cold side of the test wall.
Table 1a
Measurement results with the hot box method (HB) part 1 on U-Value.
UW/m2 DTwall[K] er. % DTair[K] er.% Rwall[m2K/W] Rtot[m2K/W] U [W/m2K]
Brick wall 67.26 28.4 2.7 38.8 3.6 0.42 0.58 1.73
The resistance of Brickwall + protected VIPs
with ‘‘A” 15.55 35.9 2.6 38.5 3.3 2.31 2.48 0.40
with ‘‘B” 18.00 36.1 2.8 39.3 3.6 2.00 2.18 0.46
6
Fig. 5b) were the same on the wall for all three cases (brick, A and B). The row titles inTable 2a, ‘‘ from wall temperatures” and ‘‘from air temperatures” relate to the temperature measurements, because in this case the two HF Pt-100 temperature sensors should be moved (fixing up on the wall and removing from the wall) (see Table 2b).
By using equations(1) to (4)similar calculations (as above men- tioned) were executed, too. After performing the subtractions among the resistances as well as eliminating the resistance part of the EPS, for the equivalent thermal conductivity 0.0089 and 0.0069 were reached for type ‘‘A” and type ‘‘B” panels respectively,
and for the case of VIP core + laminate including the edge effect (as above), see Eq. 5–8.
3.2.1. Descriptive statistics on the measured values with the Hukseflux equipment
Descriptive statistics through box chart analysis were done on the measured data reached by the measurements of the Hukseflux equipment. Here, besides the temperature data the measured heat fluxes (in W/m2) by the HF sensors were analyzed too. The results of the statistical analysis are highlighted throughFigs. 7a to 7d. The significant reduction of heat fluxes is also visible inFig. 7d.
3.3. Comparison of the measurement results
From the above presented two methods applied to the two dif- ferent types of encapsulated VIP’s the most important results were chosen for the comparisons: resistances, U-values and equivalent thermal conductivities. InFigs. 8a and 8bthe thermal resistances and thermal transmittances were plotted. We have to mention here that figures show interesting results. As one expects, higher thermal resistance, as well as less U-value, was deduced for the case ‘‘A”, where the encapsulated VIP contained 2 cm core. How- ever, some differences can be found based on the measurement results belonging to the methods (HF or HB). To see it more clearly percentile changes of the U-values were calculated reached from the values reached by both methods and the results are presented inTable 3.
For the percentile change (decrease) in the U-values by applying the ‘‘A” type panel on the brick wall about 77%, while applying the
‘‘B” type panel on the brick wall about 73% were reached by both methods. These results gave justifications and reliability for the Table 1b
Measurement results with the hot box method (HB) part 2.
Resistance [m2K/W] Thermal conductivity [W/mK]
Protected VIP VIP core + laminate incl. edge effect
Rwall, from wall temperatures
Rtot, from air temperatures
from wall temperatures
from air temperatures
from wall temperatures
from air temperatures
Average
with ‘‘A” 1.89 1.90 0.0159 0.0158 0.0123 0.0122 0.01225
from wall temperatures
from air temperatures
from wall temperatures
from air temperatures
from wall temperatures
from air temperatures
with ‘‘B” 1.58 1.60 0.0190 0.0187 0.0095 0.0093 0.0094
Warm air Warm wall Cold wall Cold Air
-25 -20 -15 -10 17.5 20.0 22.5 25.0
Temperature [o C]
Brick wall, HB method
Fig. 6a.Box chart statistics of the temperature data belonging to the brick wall with the hot box method.
Warm air Warm wall Cold wall Cold air
-25 -20 -15 -10 20.0 22.5 25.0
VIP A, HB method
Temperature [o C]
Fig. 6b.Box chart statistics of the temperature data belonging to the brick wall covered with type A” panel with the hot box method.
Warm air Warm wall Cold wall Cold air
-25 -20 -15 -10 20.0 22.5 25.0
Temperature [o C]
VIP B, HB method
Fig. 6c.Box chart statistics of the temperature data belonging to the brick wall covered with type B” panel with the hot box chamber method.
results. Let me further mention that these laboratory measurement results show a good match with the results of Johansson presented in Ref. [24], which were drawn from a real case experiment.
Although minor differences were proved from the results, the final changeable results were the same. After averaging the results of the calculated equivalent thermal conductivity reached by the dif- ferent methods (HB and HF) 0.0105 and 0.008 W/mK were reached for type ‘‘A” and type ‘‘B” respectively. Interestingly, less equivalent thermal conductivity was reached for the 1 cm thick core (see Fig. 9). However, the difference between these values is only 20%, but as a base of this, we wanted to understand the result better.
3.4. Visualization with infrared thermography
As it is presented by other publications, we also have to men- tion that infrared thermography examinations are very important in building energetics[32,33,35,36]. Infrared thermographs were taken with TESTO 882 type thermo-camera at the cooled side. Both wall structures (Brick + type ‘‘A” VIP and Brick + type ‘‘B” VIP) were Table 2a
Measurement results with the Hukseflux equipment Part 1, Heat flowUand temperature differences.
U[W/m2] st. dev. ± DT [K] st. dev. ±
Brick from wall temperatures 54 1.8 27.5 0.1
Brick from air temperatures 1.8 40.3 0.5
with ‘‘A” from wall temperatures 13 1.6 39.3 0.2
with ‘‘A” air temperatures 1.6 42.4 0.5
with ‘‘B” from wall temperatures 15.2 1.9 37.5 0.2
with ‘‘B” air temperatures 1.9 42.0 0.5
Table 2b
Measurement results with the Hukseflux equipment part 2.
Resistance including brick wall [m2K/W]
U [W/m2K] The resistance of protected VIP [m2K/W]
Brick from wall temperatures 0.509 Thermal conductivity [W/mK]
Brick from air temperatures 0.746 1.340 Protected VIP VIP core + laminate incl. edge effect average
with ‘‘A” from wall temperatures 3.023 2.514 0.0119 0.0089
with ‘‘A” air temperatures 3.257 0.307 2.511 0.0119 0.0089 0.0089
with ‘‘B” from wall temperatures 2.462 1.953 0.0154 0.0070
with ‘‘B” air temperatures 2.754 0.363 2.009 0.0149 0.0067 0.0069
Fig. 7a.Box chart statistics of the temperature data belonging to the brick wall from the measurements with the Hukseflux equipment.
Fig. 7b.Box chart statistics of the temperature data belonging to the brick wall covered with type A” panel from the measurements with the Hukseflux equipment.
Fig. 7c.Box chart statistics of the temperature data belonging to the brick wall covered with type B” panel from the measurements with the Hukseflux equipment.
8
analyzed with this equipment after reaching the steady state stage.
On the left hand side ofFig. 10a one can see the thermography image taken of the brick wall covered with type ‘‘A” VIP. Besides the thermographs, one can also see the histograms and the original image of the wall. From the images, one can see first the earlier mentioned and applied 2 cm thick and 2 cm high EPS for reducing the edge thermal bridge. Secondly, one can further see that in this case this solution does not give a final solution. Both the vertical and the horizontal histograms show deviances from the13.5°C
‘‘background” (wall) temperature.
InFig. 10b, one can see the thermography images of the brick wall covered by the type ‘‘B” VIP. We can conclude that less deviance is observable both from the graph and from the temper- ature histograms. The ‘‘background” temperature is about14.5°C and only two points jump out with about12.5°C. We can con- clude that the thermal bridge effect is less here than in the upper case. For the explanation of the thermal bridge effect, a theoretical model was created. Firstly, the thermal bridge effect has to be defined here. Generally one speaks about thermal bridges if heat is transmitted from a higher temperature part to a lower temper- ature part, some energy bypasses the body of the material and goes through the fastest paths. Through thermal bridges the heat flow increases. Both inFigs. 10a and 10bthe 2x2 cm (thick and wide) EPS stripes for lower 2D thermal bridges are also visible.
In Figs. 11a and 11b one can see the predicted heat flows through the encapsulated VIPs. At the warm sides signed with (T1), the heat turns in the EPS layer of both samples. At the bound- ary of the core and EPS the heat penetrates first into the core, but a certain amount of it with a fast surface heat diffusion bypasses the core due to the great resistance differences. Notably, the difference in the heat transfer process appears here. While the heat passes through quickly on the surface of the VIP of type ‘‘A” sample, in the case of type ‘‘B” sample the heat should penetrate to the EPS cover again. From this, we can conclude that, although the thermal resistance with applying type ‘‘A” sample is greater, the type ‘‘B”
construction is much better from the aspects of thermal bridges.
Moreover, here it has to be emphasized that the difference between the U-values is about 15–18% for the benefit of type A.
It is also well presented by Jin-Hee Kim [36] that thermal bridges should be a problem with the application of VIPs. When VIPs are placed on the wall, thermal bridges form and reduce the thermal insulation capability of the layer. Thermal bridges by VIPs might occur through the covering laminate, or it’s metal and plastic parts. These authors (Kim et al.) further report a similar effect regarding the VIPs thermal bridges, which was also stated by Kwon and colleagues[37]. Mao and his co-authors present the thermal bridge effects influenced by the size[38]. Similar results are pre- sented by Sprengard and his colleagues suggesting that the ther- mal bridging effects can be significantly reduced by applying cap (protective) layers as EPS or other weaker insulation materials on the surfaces of the VIP[39,40]. To reduce thermal bridges the use of EPS stripes could be a good solution [40,41]. It is stated that the use of polystyrene layers as cover layers is also efficient not only for protection but for reducing edge thermal bridges, a similar statement was made by Biswas and his colleagues[41,42].
3.5. Cost analysis
Considering the market prices, rapid cost analysis has to be taken into account, too. While the price of the type ‘‘A” VIP is 95 Euro/m2, then the price of the type ‘‘B” panel is 90 Euro/m2, which means that the price difference is only 5.5%. However, we have to mention that the VIP covered with EPS at both sides, could be a solution on both sides of the wall because the EPS can prevent the VIP from damage, but we suggest using type ‘‘A” as internal insulation.
Fig. 7d.Box chart statistics of the measured heat fluxes by the two plates of the Hukseflux equipment.
Fig. 8a.Thermal resistances.
Fig. 8b.U-values.
4. Conclusions
Super insulation materials can be a reasonable solution to reduce the thermal energy use of buildings. Vacuum insulation panels are a type of this group. By using these types of insulations, a relatively low U-value can be reached with less wall thicknesses.
Although, the scientific literature is abundant with researches car- ried out on VIPs, newer and newer test results and theoretical explanations should be provided continuously. Literature papers put a great effort to minimalize the center of panel thermal con-
ductivity, however, the main aim should be to reveal the properties and effects of the complete panel, containing the laminate (VIP envelope) and all the EPS layers. Vacuum insulation panels must be tested globally. Besides, the measurement of thermal conductiv- ity with heat flow meter equipment and thermal transmittance measurements of structures are also key points in respect of cor- rect characterization of thermal insulation materials.
The main conclusions obtained in this paper are:
The thermal insulation performance of two different types of encapsulated VIPs was tested after fixing them on a solid brick wall.
From the results, U-values were estimated.
Applicability limits were given regarding the two VIPs.
Thermal bridge effects were explored with infrared thermogra- phy and revealed that the supplementary insulation of the junc- tions can be the right solution for reducing the thermal bridges.
Regarding the thermal bridges, a theory for the heat transfer through the complex sandwich panel was given. As a result, we suggest for application the type ‘‘A” panel.
Equivalent thermal conductivities were given for the VIPs with- out the EPS covering layer: after averaging the results of the cal- culated equivalent thermal conductivity reached by the different methods (HB and HF) 0.0105 and 0.008 W/mK were reached for the type ‘‘A” and the type ‘‘B” respectively.
By using VIPs at least, a 70% reduction can be reached in the U- value compared to the value of the solid brick wall.
Several papers report about the center of panel thermal conduc- tivity of VIPs, but from the application point of view, the most important thing is to know its equivalent thermal conductivity, because this value refers to the U-value.
Table 3
The percentile changes in the U-values.
U-value HB method [W/m2K] Percentile change [%] U-Value HF method [W/m2K] Percentile change [%]
Brick 1.73 1.34
Brick + A VIP 0.4 76 0.30 77
Brick + B VIP 0.46 73 0.37 72
Fig. 9.The calculated equivalent thermal conductivities of the VIP core with the laminate.
Fig. 10a.The infrared thermography images and histograms of the wall with type ‘‘A” insulation, as well as the related photography.
10
CRediT authorship contribution statement
Ákos Lakatos:Conceptualization, Data curation, Formal analy- sis, Funding acquisition, Investigation, Methodology, Supervision,
Validation, Visualization, Writing – original draft, Writing – review
& editing, Measurement. Zsolt Kovács: Investigation, Measurement.
Declaration of Competing Interest
The authors declare that they have no known competing finan- cial interests or personal relationships that could have appeared to influence the work reported in this paper.
Acknowledgements
This paper was supported by the János Bolyai Research Scholarship of the Hungarian Academy of Sciences, grant number: Ákos Laka- tos/BO/269/20.
The authors would say special thanks to Dr. Samuel Brunner from Empa – Swiss Federal Laboratories for Materials Science and Technology, for the consultations regarding the vacuum insu- lation panels and for detailed feedback on our manuscript.
References
[1]U. Berardi, A.A. Gallardo, Properties of concretes enhanced with phase change materials for building applications, Energy and Buildings 199 (2019) 402–414.
[2]F. Kalmár, T. Kalmár, Study of human response in conditions of surface heating, asymmetric radiation and variable air jet direction, Energy and Buildings 179 (2018) 133–143.
[3]T. Nussbaumer, K. Ghazi Wakili, Ch. Tanner, Experimental and numerical investigation of the thermal performance of a protected vacuum-insulation system applied to a concrete wall, Applied Energy 83 (2006) 841–855.
[4]L. Aditya, T.M.I. Mahlia, B. Rismanchi, H.M. Ng, M.H. Hasan, H.S.C. Metselaar, O.
Muraza, H.B. Aditiya, A review on insulation materials for energy conservation in buildings, Renewable and Sustainable Energy Reviews 73 (2017) 1352–
1365.
[5]L. Török, Industry 4.0 from a few aspects, in particular, in respect of the decision making of the Management, /Will the new industrial revolution Fig. 10b.The infrared thermography images and histograms on the wall with type ‘‘B” insulation.
Fig. 11a. Heat flow through type ‘‘A” protected VIP (not to scale).
Fig. 11b.Heat flow through type ‘‘B” encapsulated VIP.
change the traditional management functions, International Review of Applied Sciences and Engineering 11 (2) (2020) 140–146.
[6] U. Heinemann, B. Adl-Zarrabi, S. Brunner, G. Foray, P. Johansson, J. Kono, E.
Kücükpinar, B.Milow, D. Quénard, C. Sprengard, H. Wallbaum, B. Yrieix, IEA Annex 65 International Energy Agency (IEA) – Energy in Buildings and Communities (EBC) Annex 65 Long-Term Performance of Super-Insulating- Materials (SIM) in Building Components and Systems” - Report of Subtask I:
State of the Art and Case Studies; IEA, 03 January 2020; download via, https://
www.iea-ebc.org/projects/project?AnnexID=65 on 23.08.2020 .
[7]U. Berardi, C. Sprengard, An overview of and introduction to current researches on super insulating materials for high-performance buildings, Energy and Buildings 214 (2020) 109890.
[8]Á. Lakatos, I. Deák, U. Berardi, thermal characterization of different graphite polystyrene, International Review of Applied Sciences and Engineering 9 (2) (2018) 163–168.
[9]Á. Lakatos, Investigation of the thermal insulation performance of fibrous aerogel samples under various hygrothermal environment: Laboratory tests completed with calculations and theory, Energy and Buildings 214 (2020) 109902.
[10] M. Alam, H. Singh, M.C. Limbachiya, Vacuum Insulation Panels (VIPs) for building construction industry–A review of the contemporary developments and future directions,
[11], Applied Energy 88 (2011) 3592–3602.
[12]M. Gaedtke, S. Wachter, S. Kunke,S. Sonnick, M. Radle, H. Nirsch, M. Krause,, Numerical study on the application of vacuum insulation panels and a latent heat storage for refrigerated vehicles with a large Eddy lattice Boltzmann method, Heat and Mass Transfer 56 (2020) 1189–1201.
[13] F. O’Flaherty, M. Alam, Thermal and sound insulation performance assessment of vacuum insulated composite insulation panels for building façades, Advances in Building Energy Research (2018) 1–21,https://doi.org/10.1080/
17512549.2018.1520645.
[14]E. Wegger, B.P. Jelle, A. Sveipe, S. Graynnig, A. Gustavsen, R. Baetens, J.V. Thue, Aging effects on thermal properties and service life of vacuum insulation panels, Journal of Building Physics 35 (2) (2011) 128–167.
[15]A. Capozzoli, S. Fantucci, F. Favoino, M. Perino, Vacuum insulation panels:
Analysis of the thermal performance of both single panel and multilayer boards, Energies 8 (2015) 2528–2547.
[16]S. Fantucci, S. Garbaccio, A. Lorenzati, M. Perino, Thermo-economic analysis of building energy retrofits using VIP - Vacuum Insulation Panels, Energy and Buildings 196 (2019) 269–279.
[17]S. Brunner, H. Simmler, In situ performance assessment of vacuum insulation panels in a flat roof construction, Vacuum 82 (7) (2008) 700–707.
[18]S. Brunner, K. Ghazi Wakili, Hints for an additional aging factor regarding the thermal performance of vacuum insulation panels with pyrogenic silica core, Vacuum 100 (2014) 4–6.
[19]E. Lucchi, F. Roberti, T. Alexandra, Definition of an experimental procedure with the hot box method for the thermal performance evaluation of inhomogeneous walls, Energy and Buildings 179 (15) (November 2018) 99–
111.
[20] A. Lorenzati, S. Fantucci, A. Capozzoli, M., Perino Experimental and numerical investigation of thermal bridging effects of jointed Vacuum Insulation Panels, Energy and Buildings 111 (2016) 164–175.
[21]P. Johansson, B. Adl-Zarrabi, A.S. Kalagasidis, Evaluation of 5 years’
performance of VIPs in a retrofitted building façade, Energy and Buildings 130 (2016) 488–494.
[22]S. Brunner, K. Ghazi Wakili, T. Stahl, B. Binder, Vacuum insulation panels for building applications—Continuous challenges and developments, Energy and Buildings 85 (85) (2014) 592–596.
[23]D. MacLean, P. Mukhopadhyaya, J. Korn, S. Mooney, Design details and long- term performance of VIPs in Canada’s North, Energy Procedia 111 (2017) 481–
489.
[24]U. Berardi, M. Nikafkar, S. Wi, S. Kim, Experimental verification of the theoretical aging of vacuum insulated panels, Journal of Industrial and Engineering Chemistry 90 (2020) 300–304.
[25] P. Johansson P, C.E. Hagentoft, A.S. Kalagasidis,, Retrofitting of a listed brick and wood building using vacuum insulation panels on the exterior of the façade: Measurements and simulations, Energy and Buildings 73 (2014) 92–
104.
[26] H. Singh H, M. Geisler, F. Menzel,, Experimental investigations into thermal transport phenomena in vacuum insulation panels (VIPs) using fumed silica cores, Energy and Buildings 107 (2015) 76–83.
[27] M. Tenpierik, H. Cauberg, Encapsulated vacuum insulation panels: Theoretical thermal optimization. Building Research and Information (38) 2010 660–669.
[28] Zs. Kovács, S. Szanyi, I. Budai, Á. Lakatos,, Laboratory Tests of High- Performance Thermal Insulations, Smart Innovation, Systems and Technologies 163 (2020) 73–82.
[29]G. Garnier, S. Marouani, B. Yrieix, C. Pompeo, M. Chauvois, L. Flandin, Y.
Brechet, Interest and durability of multilayers: from model films to complex films, Polymers for Advanced Technologies 22 (6) (2011) 847–856.
[30]B. Yrieix, B. Morel, E.J.E. Pons, VIP service life assessment: Interactions between barrier laminates and core material, and significance of silica core ageing, Energy and Buildings 85 (2014) 617–630.
[31]E. Pons, B. Yrieix, L. Heymans, F. Dubelley, E. Planes, Permeation of water vapor through high performance laminates for VIPs and physical characterization of sorption and diffusion phenomena, Energy and Buildings 85 (2014) 604–616.
[32]Á. Lakatos, Investigation of the moisture induced degradation of the thermal properties of aerogel blankets: Measurements, calculations, simulations, Energy and Buildings 139 (2017) 506–516.
[33]Á. Lakatos, Comprehensive thermal transmittance investigations carried out on opaque aerogel insulation blanket, Materials and Structures 50 (2) (2017) 1–12.
[34]U. Berardi, Á. Lakatos, Thermal bridges of metal fasteners for aerogel-enhanced blankets, Energy and Buildings 185 (2019) 307–315.
[35] ISO 8990:1994, Thermal insulation — Determination of steady-state thermal transmission properties — Calibrated and guarded hot box
[36]L. Moga, Thermal performance of insulated glazing units established by infrared thermography, IOP Conference Series: Materials Science and Engineering 586 (1) (2019) 012006.
[37] J.H. Kim, S.M. Kim, J.T. Kim, Simulation performance of building wall with vacuum insulation panel. International High- Performance Built Environment Conference – A Sustainable Built Environment Conference, Series (SBE16), iHBE 2016, Procedia Engineering 180 (2017) (2016) 1247–1255.
[38] J.W.P.Kwon, G.J.Kim, J.H.Kim, J. Tae., The Study on Thermal Performance Evaluation of Building Envelope with VIPs, Korea Institute of Ecological Architecture and Environment 16 (1) (2016) 5–10.
[39]S. Mao, A. Kan, N. Wang, Numerical analysis and experimental investigation on thermal bridge effect of vacuum insulation panel, Applied Thermal Engineering 169 (2020).
[40]C. Sprengard, A.H. Holm, The thermal bridging effects are only reduced by covering layers made of insulating materials on the surfaces of the VIP, Energy and Buildings 85 (2014) 638–643.
[41]L. Moga, I. Moga, Analytic study of thermal bridges met at high performance energy efficient buildings, International Multidisciplinary Scientific GeoConference Surveying Geology and Mining Ecology Management, SGEM 18 (6.4) (2018) 621–626.
[42]K. Biswas, A. Desjarlais, D. Smith, J. Letts, J. Yao, T. Jiang, Development and thermal performance verification of composite insulation boards containing foam-encapsulated vacuum insulation panels, Applied Energy 228 (2018) 1159–1172.
12