Occurrence of pharmaceuticals in the Danube and drinking water wells: Ef fi ciency of riverbank fi ltration
*Attila Csaba Kondor
a, Gergely Jakab
a,b,c,*, Anna Vancsik
a, Tibor Filep
a,
J ozsef Szeber enyi
a, Lili Szab o
a,b, G abor Ma asz
d, Arp ad Ferincz
e, P eter Dobosy
f, Zolt an Szalai
a,baGeographical Institute, Research Centre for Astronomy and Earth Sciences, MTA Centre for Excellence, Buda€orsi út 45., Budapest, H-1112 Hungary
bDepartment of Environmental and Landscape Geography, E€otv€os Lorand University, Pazmany Peter setany 1/C., Budapest, H-1117, Hungary
cInstitute of Geography and Geoinformatics, University of Miskolc, Egyetemvaros, Miskolc, H-3515, Hungary
dMTA-Centre for Ecological Research, Balaton Limnological Institute, Klebelsberg Kuno u. 3., Tihany, H-8237, Hungary
eDepartment of Aquaculture, Szent Istvan University, Pater K. u. 1., G€od€oll}o, H-2100, Hungary
fMTA-Centre for Ecological Research, Danube Research Institute, Karolina út 29., Budapest, H-1113, Hungary
a r t i c l e i n f o
Article history:
Received 13 March 2020 Received in revised form 8 May 2020
Accepted 28 May 2020 Available online 8 June 2020
Keywords:
Drinking water Danube
Organic micropollutants Persistency
Riverbankfiltration
a b s t r a c t
Surface waters are becoming increasingly contaminated by pharmaceutically active compounds (PhACs), which is a potential risk factor for drinking water quality owing to incomplete riverbankfiltration. This study examined the efficiency of riverbankfiltration with regard to 111 PhACs in a highly urbanized section of the river Danube. One hundred seven samples from the Danube were compared to 90 water samples from relevant drinking water abstraction wells (DWAW) duringfive sampling periods. The presence of 52 PhACs was detected in the Danube, the quantification of 19 agents in this section of the river was without any precedent, and 10 PhACs were present in>80% of the samples. The most frequent PhACs showed higher concentrations in winter than in summer. In the DWAWs, 32 PhACs were quan- tified. For the majority of PhACs, the bankfiltration efficiency was>95%, and not influenced by con- centrations measured in the river. For carbamazepine lidocaine, tramadol, and lamotrigine, low (<50%) filtration efficiency was observed; however, no correlations were observed between the concentrations detected in the Danube and in the wells. These frequently occurring PhACs in surface waters have a relatively even distribution, and their sporadic appearance in wells is a function of both space and time, which may be caused by the constantly changing environment and micro-biological parameters, the dynamic operating schedule of abstraction wells, and the resulting sudden changes inflow rates. Due to the changes in the efficiency of riverbankfiltration in space and time, predicting the occurrence and concentrations of these four PhACs poses a further challenge to ensuring a safe drinking water supply.
©2020 The Authors. Published by Elsevier Ltd. This is an open access article under the CC BY license (http://creativecommons.org/licenses/by/4.0/).
1. Introduction
Along with treated and untreated wastewater, numerous phar- maceutically active compounds (PhACs) are also discharged into rivers as a result of the communal consumption of pharmaceuticals, presenting an increasing ecological risk all over the world (aus der Beek et al., 2016;Couto et al., 2019;Jakab et al., 2020;K€onig et al.,
2017; Loos et al., 2009;Quesada et al., 2019; White et al., 2019;
Zhou et al., 2019). The presence of certain PhACs (e.g. the antiepi- leptic drug carbamazepine (CBZ), the non-steroidal anti-inflam- matory drug (NSAID) diclofenac (DCL), or illicit drugs) has already been detected in drinking water (Bradley et al., 2014;Davoli et al., 2019;Jones et al., 2005;Kleywegt et al., 2011;Leung et al., 2013;
Mendoza et al., 2014;Padhye et al., 2014;Sun et al., 2015). River- bankfiltration systems (RFS) and aquifers along polluted rivers are even more exposed to anthropogenic contamination. RFS is a nat- ural water filtration system between river and shallow ground- water where surface water infiltrates through alluvial sediments to drinking water abstraction wells (Ascott et al., 2016;Bradley et al., 2014). Although RFS can attenuate the groundwater pollution with
*This paper has been recommended for acceptance by Eddy Y. Zeng.
*Corresponding author. Geographical Institute, Research Centre for Astronomy and Earth Sciences, MTA Centre for Excellence, Buda€orsi út 45., Budapest, H-1112 Hungary.
E-mail address:jakab.gergely@csfk.mta.hu(G. Jakab).
Contents lists available atScienceDirect
Environmental Pollution
j o u r n a l h o m e p a g e : w w w . e l s e v i e r . c o m / l o c a t e / e n v p o l
https://doi.org/10.1016/j.envpol.2020.114893
0269-7491/©2020 The Authors. Published by Elsevier Ltd. This is an open access article under the CC BY license (http://creativecommons.org/licenses/by/4.0/).
different biological, physical, and chemical processes, this medium is highly exposed to anthropogenic influences (Hiscock and Grischek, 2002; van Driezum et al., 2019). Certain inorganic and organic micropollutants (eg. PhACs) can contaminate aquifers and they can reach drinking water wells where shallow drinking water aquifers are closely connected to rivers (Hamann et al., 2016;
Heberer, 2002;Hollender et al., 2018). Although no legal limiting values exist for the pharmaceutical contamination levels of natural and drinking water, the monitoring of PhACs in surface water has become increasingly important in the past few years due to the potential risks to environmental and human health (Reis-Santos et al., 2018;Sui et al., 2015). As a result, in addition to certain an- tibiotics, hormones, such as E1 (estrone), E2 (17-Beta-estradiol), EE2 (17-Alpha-ethinylestradiol), and DCL, are also present on the watch list of the European Union, following with the Water Framework Directive (Barbosa et al., 2016;Castiglioni et al., 2018).
The Danube is the largest river in the EU with a total length of 2780 km. Its catchment area covers 801,000 km2 with approxi- mately 81 million inhabitants in 19 countries (Schmedtje et al., 2005), and it is exposed to a huge amount of anthropogenic contamination (Kirschner et al., 2017). In Slovakia, Hungary and Serbia, the largest cities along the Danube, like capitals Bratislava, Budapest and Belgrade use much more than 50% of riverbankfil- trated water for their drinking water supply (Storck et al., 2015).
Several surveys (Joint Danube Surveys in 2001, 2007, and 2013;
JDS1, JDS2, JDS3) have been conducted by theInternational Com- mission for the Protection of the Danube River(ICPDR) to study the pharmaceutical contamination of the entire length of the river.
Within the framework of the latest survey (JDS3 in 2013), the presence of several hundred molecules was studied along the entire length of the Danube, and dozens of pharmaceutical com- pounds were detected in the water (Ginebreda et al., 2018;Neale et al., 2015). Surveys have also been conducted along shorter sec- tions of the Danube, revealing differing dynamics of certain sub- stances (Chit¸escu et al., 2015; Chit¸escu and Nicolau, 2015; Letic et al., 2015; Milic et al., 2018; Petre et al., 2016;Radovic et al., 2015;Varga et al., 2010). The water discharge of the Danube at Hungary varies 1000e10,000 m3 s1 with a maximum at early spring owing to snowmelt and a minimum at early fall. As the amount of the treated wastewater input is stable, the varying water discharge can trigger considerably concentration changes in the river owing to dilution, possibly affecting even the bankfiltration efficiency (Ascott et al., 2016).
River water is primarily treated by passing the water through the geological layer to the wells. Certain contaminants are adsorbed by the sediments, and the most effective form of treatment, micro- biological degradation, also occurs during this process. However, water treatment can never be perfect (Heberer, 2002). The effi- ciency of a filtration system may be influenced by several envi- ronmental factors; therefore, it can change rapidly in both space and time (Henzler et al., 2014). The most critical factors are believed to be the properties of the sediment/soil, hydrogeological settings, temperature, travel times and distances, dissolved organic com- pounds and oxygen content, pH, and the properties of the target molecule (Petrovic et al., 2009). Tests aiming to determine the ef- ficiency of RFS have been mainly carried out in a laboratory envi- ronment as model experiments on artificial soil columns or asfield model experiments (Bertelkamp et al., 2016;Henzler et al., 2014);
however, no universal conclusions have been reached (Abdelrady et al., 2019; Oberleitner et al., 2020). Measurements taken by Maeng et al. (2010)in Lake Tegel revealed that increased CBZ levels in the lake water did not result in a CBZ increase in the wells, which indicates that the riverbank filtration efficiency can change over time. In the case of smaller rivers, travel time and, in particular,
travel distance play a crucial role in reducing contaminant con- centrations (Hamann et al., 2016;Huntscha et al., 2013;Kruc et al., 2019;Oberleitner et al., 2020). As a general trend, it was established that certain persistent PhACs, such as CBZ (JDS3;van Driezum et al., 2019; Kovacevic et al., 2017), penetrate the oxidative alluvial aquifers along the Danube as well, while others are prevented from doing so as a result of varying affinity for adsorption and biodeg- radation.Nagy-Kovacs et al. (2018)found equal distributions of CBZ and DCL in the Budapest section of the Danube, butfiltration effi- ciency was significantly different in the north and south sections under similar hydrogeological conditions (north: CBZ: 20%, DCL:
32%; south: CBZ: 4%, DCL 44%, respectively). The authors also pointed out that due to the different pumping operational sched- ules, it was not possible to determine whether the travel distance or the travel time was more responsible for the attenuation under conditions of water abstraction in large quantities. Consequently, a further study offluctuations of in situfiltration efficiency in space and time measured in abstraction wells could have far-reaching scientific implications.
The present study was completed within the framework of a research project conducted over several years and supported by the Hungarian government with the aim of analyzing pharmaceutical contamination in the Budapest Metropolitan Region. It was hy- pothesized that the efficiency of riverbankfiltration was not related to the PhAC concentrations measured in the river. The research of the Central-Hungarian section of the Danube was conducted i) to determine the pharmaceutical contamination of the Danube and the abstraction wells operating along its banks, and its main spatiotemporal features through an analysis based on significantly more samples and pharmaceuticals than before and ii) to deter- mine the efficiency of riverbankfiltration systems in the removal of individual PhACs and identify the compounds presenting the highest threat to the security of the drinking water supply.
2. Materials and methods 2.1. Study area
The study was performed along the Hungarian section of the Danube, stretching almost 100 river kilometers (rkm) in the Budapest Metropolitan Region (BMR) (Fig. 1). The average water discharge of the river at Budapest is 2300 m3s1. The study was carried out at a permanent low discharge without relevant seasonal fluctuations. In this section of the river, about 7.2 m3s1of treated wastewater is discharged into the Danube directly or indirectly, which is less than 1% of the total waterflow. Three big wastewater treatment plants (WWTPs) are responsible for the 80% of the dis- charged wastewater, which together transfer approximately 500,000 m3day1of treated wastewater into the river. The average discharge of the North-Pest WWTP is 180,000 m3day1; the ca- pacity of the Central WWTP is 250,000 m3day1; and the capacity of the South-Pest WWTP discharging treated wastewater into the Rackeve-Soroksar branch of the Danube is 80,000 m3day1. The treated wastewater also enters directly the river from 15 WWTP effluents (more than 70% of the total discharge) or its subsidiaries from more than 100 smaller WWTPs or communal wastewater disposal systems (HCSO, 2019; WMD, 2010). According to the Catchment Management Plan of Hungary, more than 90% of the discharged communal wastewater is treated in the WWTPs (WMD, 2010; WMD, 2016). The impact of untreated wastewater on the water quality of the Danube is no longer particularly significant.
The two large drinking water treatment plants operating in the area provide riverbankfiltration-treated drinking water to more than two million people in Budapest and its vicinity. This means
that more than 90% of the volume of the drinking-water supply in BMR is riverbank-filtrated water. The Budapest Waterworks oper- ates 756 drinking water abstraction wells (DWAWs), mainly in the area of Szentendre Island and Csepel Island, with an average water production of 456,000 m3day1. The Danube Regional Waterworks, on average, produces 161,000 m3day1from the wells along with the upstream of the Budapest section of the Danube. The majority of the wells are located quite close to the Danube (<200 m), whereas the range is 16.5e813 m. Waterfiltration is done by the geological layer, which mainly consists of Pleistocenefluvial gravels and sands of the Pleistocene on the basement of impermeable tard clay. The thickness of the gravels and sand varies between 90 and 130 m, constructing a homogeneous filtration material in the studied area (Karman et al., 2014). Owing to the geological cir- cumstances, thefiltering system is oxidative (Szalai, 1998;Szalai et al., 2004). The vast majority of the water extracted from the wells (>95%) comes from the Danube (Deak et al., 1992).
2.2. Sampling
To determine the degree of pharmaceutical contamination of the Danube, 107 water samples were collected along the 96 river kilometer section between 1700 rkm and 1600 rkm during five sampling periods (Period I: 29e30. 06. 2017; Period II: 21e22. 02.
2018; Period III: 04. 05. 2018; Period IV: 30. 08. 2018; Period V: 19.
11. 2019). Checking seasonal variations in the concentration of PhACs, three sampling campaigns (Periods I, III, and IV) were car- ried out during the summer, and two other samplings (II and V) were carried out during the winter. Dilution of wastewater by the runoff may occur during extremely heavy rains orflashfloods, but no such phenomenon was observed during the investigation thus the WWTPs produced their average contribution prior to the sampling periods. Samples were taken from a boat, 5 m from the bank, and 200 mm below the surface as grab samples; before each sampling, original nitrile latex gloves were worn during the handling of the water samples. Each sampling was taken at low water levels, and there were noflood events during the research period.
To determine the contamination level of the DWAWs, 90 un- treated samples were collected from wells producing RFS-treated water duringfive sampling periods (Period I: 14. 07. 2017; Period II: 07. 03. 2018; Period III: 14e15. 05. 2018; Period IV: 10e13. 09.
2018; Period V: 26e29. 11. 2018). The sampling of the wells was conducted as close to ten days following the sampling of the Danube as it was possible, taking into account the mean 10e12 day travel time from the river to the wells (Karman et al., 2014). Sam- ples were taken from the wells’sampling taps as grab samples.
Water samples were collected directly from the river and the drinking well taps, respectively. For the performance of a general water chemistry analysis, samples were collected in 500 ml brown Fig. 1.Sampling area in Budapest Metropolitan Region, Hungary. Location of the study site in Europe (A); sampling sites in the northern (B) and southern (C) water resources; green squares represent the Danube sampling sites; red dots represent the drinking water abstraction wells sampling sites; wastewater treatment plants are marked with roman nu- merals: I: North-Pest; II: Central; III: South-Pest. (For interpretation of the references to colour in thisfigure legend, the reader is referred to the Web version of this article.)
borosilicate glass containers after they were rinsed 2 to 3 times. To measure the organic material content, a 50 mL sample was taken into a white borosilicate container, and 500mL of 2 M hydrochloric acid (VWR International, Pennsylvania, USA) was added to it. For the PhACs test, 2.5 L of water was collected in brown borosilicate glass containers with teflon faced caps (Thermo Fisher Scientific) as grab samples and 2 mL HPLC purity formic acid (VWR International, Pennsylvania, USA) was added to it. For the elemental analysis 15 ml water sample was taken from the Danube river with an original plastic syringe and transferred into polypropylene centri- fuge tubes free from metal pollutants through a 0.45mm syringe filter, and then 100mL of high-purity cc. nitric acid (VWR Interna- tional, Pennsylvania, USA) was added to the sample. In the case of drinking water wells, samples for elemental analysis were taken via well tapsfirst in the original polypropylene plastic bottle having 50 mL volume (VWR International, Pennsylvania, USA), and after that, the same sampling procedure was repeated.
Each sample was immediately cooled in a closed container until it arrived to the laboratory less than 4h.
2.3. Chemical analysis 2.3.1. General water chemistry
Temperature, conductivity, pH, dissolved oxygen concentration, and turbidity were measured in the river, using a portable Hanna Multi Meter (Hanna Instrument, USA), and turbidimeter (VWR In- ternational, USA). The other physico-chemical parameters were determined in the lab. Total organic carbon (TOC) and total nitrogen (TN) concentrations were measured by applying a Multi N/C 3100 TCeTN analyzer (Analytik Jena, Germany). The concentrations of anions (fluoride, chloride, sulfate, bromide, nitrate) and cations (ammonium, calcium, magnesium, sodium, potassium) were determined with a Dionex ICS 5000þdual channel ion chroma- tography system (Thermo Fischer Scientific, USA). Phosphate, ni- trite, alkalinity, and total hardness were measured by standard titrimetric and spectrophotometric methods (Eaton et al., 2005).
The heavy metal concentration of the samples was determined using a PlasmaQuant MS Elite inductively coupled plasma mass- spectrometer (Analytik Jena, Germany).
2.3.2. PhAC analysis
Sample preparation processes and instrumental analysis have been reported earlier (Jakab et al., 2020;Maasz et al., 2019). Briefly, prior to sampling filtration (GF/F 0.7 mm glass microfibrefilter,
#516e0345, VWR) the corresponding mass-labelled internal stan- dards (IS) were added to the samples used for quantification. Drug residues were concentrated on Strata XeCW (#8BeS035eFCH, Phenomenex) solid-phase extraction (SPE) cartridges using an automata SPE system (AutoTrace 280, Thermo Scientific). The extraction was carried out within the 20h of the sampling. Ensuring the needed sensitivity derivatization of steroid agents was con- ducted using dansyl-chloride. The SFC-MS/MS system used for multiple-reaction-monitoring mode quantitation consisted of a WATERS Xevo TQ-S Triple Quadrupole mass spectrometer and a WATERS ACQUITY UPC2 system. MassLynx software (V4.1 SCN950) was used for recording data in triplicate, whereas the evaluation was carried out with TargetLynx XS software. All the SFC-MS/MS tests were conducted on an ACQUITY UPC2 BEH analytical col- umn (#186007607, Waters). The 111 quantified PhACs, analytical parameters of SFC-MS/MS method, limit of detection (LOD), limit of quantification (LOQ), and validation values are listed inTable S1.
Using method blank samples, we ensured that the environmental samples were free from laboratory contamination. The analytical methods were validated and verified in each sampling period applying further quality assurance-quality control samples (QA/
QC). All extracts were analyzed<30 days.
2.4. Data analysis
To estimate spatial and temporal changes in concentrations, descriptive statistics, such as mean, standard deviation, and coef- ficient of variation (CV) were used. Data distribution was analyzed by the Shapiro-Wilk test. Since the individual variables did not exhibit normal distribution patterns, the correlation between the variables was quantified using the Spearman correlation coefficient with a 95% significance level. The seasonal differences in PhAC concentrations owing to their non-normal distribution were analyzed by the Mann-WhitneyUtest with a 95% significance level.
The efficiency of riverbankfiltration was determined for PhACs, which were identified in at least one-third of the samples collected from the Danube. To establish the efficiency of riverbankfiltration, PhAC concentrations measured in the bankfiltrates were compared to those found in the Danube. Filtering out the distorting effects of point source pollution the average contamination level of three relevant water samples (nearest samples from the Danube to the well of which at least one was collected upstream, above the well) was compared to the concentrations measured in the well.
The efficiency of the riverbank filtration system (ERFS) was calculated for each PhAC based on the frequency of occurrence (fro) and the concentration (con) as follows (eqs.(1) and (2)):
ERFSfro¼
1
Pfrowell PfroDanube
100; (1)
ERFScon¼
1
Pconwell PconDanube
100; (2)
where ERFSfro denotes the efficiency of the riverbank filtration system based on the frequency of occurrence; fro denotes the fre- quency of occurrence of a PhAC; ERFScondenotes the efficiency of the riverbankfiltration system based on a comparison of the total PhAC concentrations measured in the Danube and bankfiltrates;
and con denotes the concentration of a PhAC.
Filtration efficiency calculated based on measuring point cou- ples had no normal distribution in the case of any of the com- pounds. Hence, to compare thefiltration efficiency of individual wells and the water aquifers north and south of Budapest, a median-based comparison of independent samples was performed instead of a parameterized test (eq.(3)). Where the concentration measured in a well exceeded the concentration in the Danube, the filtration efficiency was assumed to be 0%:
ERFSmp¼Me
1 Conwell Conr;Danube
! 100
!
; (3)
where ERFSmp denotes the efficiency of the riverbank filtration system based on measuring pairs; conwelldenotes the concentra- tion of a certain PhAC in a given well; and conr, Danubedenotes the average concentration of a certain PhAC, calculated from the results of three relevant Danube samples. Statistical calculations were carried out using IBM SPSS Statistics for Windows (version 22, IBM Corp., Armonk, NY, USA).
3. Results and discussion
3.1. Measured concentrations in the danube water samples
General water chemistry parameters and heavy metal content in the 107 Danube samples (Kondor et al., 2020) e considering
seasonal fluctuations as well e did not differ significantly from previously published data (Ionescu et al., 2015; Simeonov et al., 2011; Takic et al., 2012). Fifty-two of the monitored 111 PhACs were detected over a LOQ (Table 1). Based on these results, direct traces of poorly treated or untreated wastewater can be barely detected. Eight PhACs occurred only once, while 44 compounds were detected in several samples. The detection of 19 PhACs in the investigated section of the Danube was without precedent. Among these, the antipsychotic agent tiapride, the anxiolytic cinolazepam (CNL), and the cardiovascular drugs perindopril and propafenone occurred with frequencies greater than 50%. The antidepressant
lacosamide was also detected in one-third of the samples. Alto- gether 15 PhACs were found in at least half of the samples and 10 compounds occurred with frequencies greater than 80%. CBZ, lidocaine (LID), lamotrigine (LTG), tramadol (TRA), and DCL, which are on the EU watch list, were consistently detected in the river. The antiepileptic drug CBZ has already been identified as a potential environmental risk in the Danube (Shao et al., 2019). Moreover, the cardiovascular drug bisporolol (BSP) was identified in every sam- ple, and the occurrence of metoprolol (MTP) and perindopril was over 90%.
Previous analyses (Fick et al., 2017;JDS1;JDS2;JDS3;Ginebreda
Table 1
Concentrations of all pharmaceutically active compounds (PhACs) found to exceed their limit of quantification (LOQ) value in Danube (MIN: measured minimum value, MAX:
measured maximum value, Mean: average of the measured values>LOQ).
Pharmacological classification PhACs Frequency of detection Frequency of occurrence LOQ MIN MAX MEAN SD
N % ng L1
Alkaloids atropinea 2 1.9 0.05 0.18 4.31 2.24 n.a.
caffeine 50 46.7 10 10.3 3400 591 758
theophyllina 20 18.7 10 16.3 119 45.9 31
Antipsychotics, antidepressants amitriptillin 2 1.9 0.1 0.50 0.73 0.61 n.a.
bupropiona 2 1.9 0.5 0.56 0.60 0.58 n.a.
citalopram 103 96.3 0.1 0.18 15 1.61 1.85
clozapine 71 66.4 0.1 0.43 64.7 2.84 8.44
metoclopramide 1 0.9 0.2 1.05 1.05 1.05 n.a.
mirtazapine 39 36.4 0.1 0.14 18.9 1.49 3.01
quetiapine 25 23.4 0.1 0.32 6.29 0.94 1.14
tiapridea 73 68.2 0.1 0.97 308 21.5 42.4
trazodone 52 48.6 0.05 0.16 3.52 1.26 1.06
Antiepileptics carbamazepine (CBZ) 106 99.1 0.1 26.08 498 77.2 60
lacosamidea 34 31.8 0.5 0.81 60.32 8.45 11.71
lamotrigine (LTG) 92 86 5 13.9 2780 171 287
Anxiolytics alprazolam 25 23.4 0.1 0.12 4.3 0.38 0.83
cinolazepam(CNL)a 82 76.6 0.1 0.38 45.07 2.9 5.98
diazepam 13 12.1 0.1 0.11 0.22 0.15 0.04
nitrazepam 1 0.9 0.1 1.87 1.87 1.87 n.a.
nordiazepam 27 25.2 0.1 0.1 0.98 0.18 0.16
oxazepam (OXA) 88 82.2 0.1 0.45 7.13 2.65 1.34
temazepam 26 24.3 0.1 0.21 0.60 0.37 0.09
zolpidem 20 18.7 0.01 0.02 0.62 0.28 0.14
Cardiovascular drugs bisoprolol(BSP)a 107 100 0.5 0.54 70.1 3.80 7.52
esmolola 1 0.9 0.1 0.11 0.11 0.11 n.a.
losartan 78 72.9 0.1 0.30 109 4.2 12.6
metoprolol (MTP) 105 98.1 0.1 0.91 233 11.4 23.6
perindoprila 99 92.5 0.1 0.51 81.5 5.16 11.3
propafenonea 61 57.0 0.5 0.51 32.4 2.57 4.46
propranolol 35 32.7 0.1 0.14 8.08 0.58 1.33
trimetazidinea 9 8.4 20 20.5 275 57.7 81.8
verapamila 10 9.3 0.05 0.06 0.47 0.15 0.13
warfarina 24 22.4 0.1 0.12 0.69 0.27 0.13
Dissociative anaesthetics, psychedelic drugs, and their metabolites
benzoylecgonine 47 43.9 0.1 0.14 43.9 3.55 6.97
cocaine 43 40.2 0.05 0.06 24.3 1.28 3.78
ketamin 44 41.1 0.5 0.56 111 8.72 17.3
Hormones levonorgestrela 1 0.9 1 9.82 9.82 9.82 n.a.
E1 45 42.1 0.05 0.09 2.33 0.39 0.32
aE2 1 0.9 0.05 0.17 0.17 0.17 n.a.
bE2 10 9.3 0.05 0.11 0.4 0.24 0.1
E3 8 7.5 0.05 0.06 0.25 0.12 0.08
EE2 1 0.9 0.05 0.10 0.10 0.10 n.a.
Local anaestethics bupivacainea 7 6.5 0.1 0.16 0.29 0.22 0.05
lidocaine (LID) 106 99.1 0.1 2.45 298 13.6 28.6
ropivacaina 7 6.5 0.1 0.11 0.20 0.14 0.03
tetracainea 1 0.9 0.1 3.69 3.69 3.69 n.a.
NSAID’s diclofenac (DCL) 94 87.9 0.5 1.71 115 22.5 22.9
naproxena 6 5.6 0.1 2.80 92.2 26.4 33.7
paracetamol 1 0.9 20 34.4 34.4 34.4 n.a.
Opioids, morphine derivatives methadonea 14 13.1 0.02 0.43 16.2 1.77 4.15
pethidinea 10 9.3 0.1 0.14 0.53 0.33 0.13
tramadol (TRA) 92 86.0 0.1 1.44 262.4 23 30.7
n.a. not applicable.
aFirst time detection in the affected section of the Danube (asterisk: PhACs detected for thefirst time from the affected section of the Danube. Italic: Frequency of occurrence
>80%.
et al., 2018;Loos et al., 2010;Petrovic et al., 2014; etc.) showed that the pharmaceutical contamination of the BMR section of the Dan- ube (see Fig. 1., section A) did not differ from that of the sur- rounding areas, but the population density of the BMR and the quantity of untreated wastewater discharged into the Danube had an impact on the water quality of the river. Based on the data of general chemistry and heavy metals however, the untreated wastewater had only low impact on the water quality of the Danube in the sampling period. Although the comparison of results with earlier researchfindings seems inappropriate due to differences in sampling methods, locations (e.g. sampling close to the riverbank vs. streamline), and sampling periods, some points should be highlighted. In the three samples collected from the affected sec- tion of the Danube,JDS3 (2015)did not detect the presence of the beta-blocker BSP, which was found in all samples in our research, and the presence of citalopram occurred with over 95% frequency.
The presence of perindopril, occurring with a frequency of over 90%, had not even been studied before. Compared to the results of JDS3, higher concentrations of several persistent PhACs were detected, which may be the result of sampling close to the river- bank. While the concentrations of two antiepileptic drugs (CBZ and LTG) were lower in the JDS3 study (CBZ: 32.3 ng L1, LTG: 60 ng L1; Ginebreda et al., 2018), in the present research, high frequency of occurrence was accompanied by high average concentration levels.
Although LID was identified at lower concentrations compared to these other substances, it had more than three times the concen- tration established during the JDS3 (4.27 ng L1). The average concentration of the frequently occurring MTP, TRA, and DCL were nearly the same as thefindings of previous studies; it was over 10 ng L1. Only in the case of oxazepam (OXA) was a lower contamination level detected than that detected by JDS3 (6.63 ng L1). DCL exhibited an exceptionally high frequency of occurrence among the PhACs on the EU watch list. It had an average concentration of 22.5 ng L1 in 94 positive samples, while the average concentration of the hormone E1 (estrone), which was detected in 46 samples, was 0.4 ng L1. The compound detected in the largest amount was caffeine, but there were differences be- tween concentrations in samples obtained at different sampling locations.
Bertelkamp et al. (2016) pointed out that due to its high adsorption capacity, organic matter is able to filter out large quantities of PhACs. However, in the present study, the quantity of dissolved organic substances proved to be unrelated to the PhAC concentrations most frequently measured in the Danube. Besides highlighting the different adsorption affinities of certain molecules (Petrovic et al., 2009), this also sheds light on the lowfiltering ca- pacity of dissolved organic matter and the highfiltering capacity of those in a solid phase (Szabo et al., 2020).
The coefficient of variation (CV) was influenced by three sam- ples taken at different times in different places, which were much more contaminated than the rest (samples ID 7, 37, and 100, see Kondor et al., 2020). One of these samples (sample ID 37 from sampling site 22, seeFig. 1) was collected close to the effluent of a WWTP, while the other two were taken farther away from the large wastewater treatment plants (sample ID 7 from sampling site 23:
more than 25 km downstream, and sample ID 100 from sampling site 13: approx. 10 km upstream). The general water chemistry properties of these samples were not different from those of other samples, but for certain compounds (e.g. LTG, CBZ, MTP etc.), much higher contamination was detected, while the PhAC compositions of the three samples were also different. Presumably, these samples became contaminated as a result of local riverbank pollution or untreated wastewater discharge. These three samples represent only 2.8% of the total number of samples, this also suggests that the
role of untreated wastewater was negligible in the sampling period.
Excluding these samples, only the CV value of perindopril was over 100%, and it remained under 50% for LTG, CBZ, and LID. These re- sults indicate a homogeneous distribution of frequently occurring contaminants in both space and time, which, in the case of a river of this size, is only influenced by certain local factors, such as un- treated wastewater discharge, relatively close to the bank. The samples revealed significantly lower concentrations in summer compared to the winter for LID, TRA, MTP, OXA, DCL, citalopram, BSP, and perindopril; however, the seasonal concentration did not differ for CBZ and LTG. This is in accordance with the results of Varga et al. (2010), who also reported lower concentrations of contaminants in winter in the Danube, supposing a lower degree of biological- and photo-degradation. Even though the present study focuses on treated wastewater contribution, there are additional possible sources to increase the PhACs concentrations such as direct load from baths (Jakab et al., 2020), damaged sewers, farms, and boats. However, their impact is very limited for DWAWs.
3.2. Drinking water abstraction wells
The nitrate-ammonium composition measured in the well wa- ter samples (Kondor et al., 2020) proved that thefiltering system is still oxidative. Although 32 of the targeted 111 PhACs were quan- tified in the 90 DWAW samples, most of the micropollutants only occurred in a few samples or in an extremely low concentration (Table 2,Kondor et al., 2020). Twelve of the components occurred only once, and in the cases of 20 PhACs the average of the con- centrations over LOQ did not exceed 1 ng L1. Only four PhACs were over the 50% frequency of occurrence value. The most persistent PhAC was CBZ. Like the Danube samples, it was detected in more than 90% of the drinking water samples, and its average concen- tration was quite similar to the concentrations measured in surface water. LTG occurred in more than half of the samples over LOQ, and in the positive samples, it was present with almost the same con- centration as in the water of the Danube. The average concentration of LID remained two orders of magnitude below concentrations measured in surface waters, and the concentration of TRA remained one order of magnitude below that value. Due to the low LOQ value applied during the study, the frequency of the other three PhACs was over 10%: the anxiolytic benzodiazepine CNL and OXA were frequent, and the appearance of benzoylecgonine, which is the stable metabolite of cocaine, indicates that the spread of cocaine use can present a threat to drinking water supply security (Campestrini and Jardim, 2017; Mendoza et al., 2014). In inter- preting the findings, we must also consider the fact that the possible synergistic effects of compounds that enter the ground- water in low concentrations but belong to similar pharmaceutical categories also present a risk factor.
The CV of CBZ was similar in the DWAW and Danube samples. In contrast, the CV of TRA in the wells was higher, while the CV values of LTG and LID were lower than those calculated in the Danube.
Each PhAC that revealed seasonal changes in the Danube and was found in the DWAW samples (LID, CBZ, TRA) also provided seasonal dynamics in the well waters. Even though in well waters, higher PhAC concentrations were found in summer. LTG in DWAWs, as in the case of the Danube did not show seasonal changes. These re- sults suggest that the efficiency of riverbankfiltration greatly varies among PhACs, and for the most persistent ones (LID, CBZ, TRA, LTG) it is not affected by concentrations in the Danube. As an alternative, the results would imply an additional permanent water and contamination source to the DWAW, however, former stable isotope results (Karman et al., 2014) and the chemical parameters and heavy metal concentrations of the present study refute this
hypothesis.
3.3. Efficiency of riverbankfiltration system
Among the twenty-two PhACs detected in at least one-third of the Danube samples, 15 compounds were almost completely removed from DWAWs by riverbank filtration (ERFScon, ERFSfro
>90%), including the frequently occurring BSP and DCL (Kondor et al., 2020). This is in line with the hypothesis of the study.
Although the degradable DCL had been detected by some authors in high concentrations along the Danube and also infiltered water (Kovacevic et al., 2017;Nagy-Kovacs et al., 2018.), the present study did not confirm thosefindings. This PhAC was detected in DWAWs only randomly and in low concentrations, which is similar to the findings of other studies (van Driezum et al., 2019;Hamann et al., 2016;Kruc et al., 2019).
CBZ usually penetrated the riverbank (Table 3). Thefiltration efficiency of CBZ was still higher than the values previously pub- lished for the same section of the Danube byNagy-Kovacs et al.
(2018). In the case of LTG neither the ERFScon nor the ERFSfro reached 50%. In the case of LID and TRA, the ERFSconand the ERFSfro were widely separated. In the case of LID, the compound penetrated the RFS in more than 80% of the cases, but its magnitude decreased by one order. TRA penetrated filtration in 70% of the cases, but almost 90% of the compound was removed by riverbankfiltration.
In the case of three PhACs (OXA, benzoylecgonine, CNL) that occurred less frequently in DWAWs, ERFScon and ERFSfro were separated from each other; while the former was nearly 95%, the latter did not reach 90%. However,filtration efficiency does not
necessarily mean that a given PhAC has been completely eliminated because it often remains in the natural environment for surpris- ingly long periods of time in the forms of different metabolites, such as lamotrigine (LTG) or OXA, which can be detected even after several years (Chefetz et al., 2019;Klaminder et al., 2015).
While the presence of CBZ in drinking water is already widely known, there is less information available about the persistence of LID, TRA, and LTG. In the case of the four most frequently occurring PhACs in drinking water, the ERFS is only partly similar to the values found in the literature. In our research, higher concentrations were found in the Danube riverbankfiltrates than identified by earlier research. This may be partly attributed to the fact that, in the pre- sent study, higher concentrations were measured in the Danube as well.
To further refine the interpretation of the results, for the PhACs occurring most frequently in the Danube and in riverbankfiltrates, filtration efficiency was calculated in pairs based on the quotient of the given DWAW and the related PhAC concentration in the Danube (the average contamination of the three relevant Danube samples, see Section2.4). Efficiency was calculated for a given compound at a given time in every DWAW sample, and then the median of the entire dataset was taken. In the cases of LID and CBZ, the ERFSmp~ ERFScon, but the CV values varied. For LTG and TRA, the values of ERFSmp>ERFScon, and the CV values were also higher for the former. These results indicate that thefiltration efficiency of wells for LID was similar in time and space (the values were not too dispersed). In the cases of the other PhACs, efficiency was rather different for various individual compounds and locations. Although the highest contamination values were measured in wells near the Table 2
Concentrations of all pharmaceutically active compounds (PhACs) found to exceed their limit of quantification (LOQ) value in well water (MIN: measured minimum value, MAX: measured maximum value, Mean: average of the measured values>LOQ).
Pharmaceutical classification PhACs Frequency of detection Frequency of occurrence (FRO) LOQ MIN MAX MEAN SD
N (%) ng L1
alkaloids drotaverin 1 1.1 0.1 0.84 0.84 0.84 n.a.
caffeine 8 8.8 10 10.21 22.07 16.9 4.10
antidepressants citalopram 5 5.5 0.1 0.13 0.58 0.28 0.20
quetiapine 4 4.4 0.1 0.15 6.05 2.08 2.69
mirtazapine 3 3.3 0.1 0.39 3.84 1.62 1.92
bupropion 2 2.2 0.5 0.65 2.39 1.99 n.a.
clozapine 2 2.2 0.1 0.37 0.91 0.64 n.a.
metoclopramide 1 1.1 0.2 1.79 1.79 1.79 n.a.
tiapride 1 1.1 0.1 0.52 0.52 0.52 n.a.
trazodone 1 1.1 0.05 0.12 0.12 0.12 n.a.
risperidone 1 1.1 0.1 5.55 5.55 5.55 n.a.
paliperidone 1 1.1 0.1 1.1 1.1 1.10 n.a.
antiepileptics carbamazepine (CBZ) 85 94.4 0.1 0.49 176 47.6 37.9
lamotrigine(LTG) 48 53.3 5 5.18 849 126 130
anxiolytics cinolazepam (CNL) 19 21.1 0.1 0.17 1.13 0.5 0.23
oxazepam (OXA) 13 14.4 0.1 0.23 1.58 0.69 0.44
alprazolam 5 5.5 0.1 0.12 0.3 0.17 0.07
nordiazepam 4 4.4 0.1 0.11 0.38 0.19 0.13
diazepam 3 3.3 0.1 0.16 0.25 0.19 0.05
temazepam 1 1.1 0.1 0.15 0.22 0.22 n.a.
zolpidem 1 1.1 0.01 0.04 0.04 0.04 n.a.
cardiovascular drugs verapamil 7 7.7 0.05 0.24 4.78 1.35 1.86
perindopril 5 5.5 0.1 0.22 1.11 0.52 0.34
losartan 3 3.3 0.1 0.15 0.66 0.37 0.26
metoprolol (MTP) 1 1.1 0.1 0.73 0.73 0.73 n.a.
bisoprolol (BSP) 1 1.1 0.5 0.66 0.66 0.66 n.a.
DAPSHM benzoylecgonine 13 14.4 0.1 0.13 1.20 0.39 0.37
cocaine 1 1.1 0.05 0.27 0.27 0.27 n.a.
ketamin 2 2.2 0.5 0.63 1.15 0.89 n.a.
local anaesthetics lidocaine (LID) 74 82.2 0.1 0.11 6.1 0.97 0.97
NSAID’s diclofenac (DCL) 1 1.1 0.5 1.55 1.55 1.55 n.a.
Opioids, morphine derivatives tramadol (TRA) 62 68.8 0.1 0.12 26.72 2.62 3.78
Italic: Frequency of occurrence>50%.
n.a. not applicable.
Danube, the efficiency of riverbankfiltration did not show a strong correlation with the distance of the wells from the river (r<0.04) (Figs. S1eS4). All this suggests that in the case of alluvial porous aquifers, a few hundred meters is not enough distance for complete filtration.
The efficiency of riverbankfiltration was also analyzed in terms of the differences between northern and southern water resources of BMR. Although there was a relevant difference between the two areas in terms of sample numbers (n¼68 (N); n¼22 (S)), in the case of CBZ the efficiency of filtration was higher in the south (ERFScon¼39.8%, ERFSmp¼58.5%), than the ERFScon¼4% deter- mined byNagy-Kovacs et al. (2018)on the same water resource, which also refers to the variability of ERFS. In the water resources in the north, ERFScon was 23.6%, and ERFSmp was 28.1, which was similar to the data published before (ERFScon¼20%,Nagy-Kovacs et al., 2018).
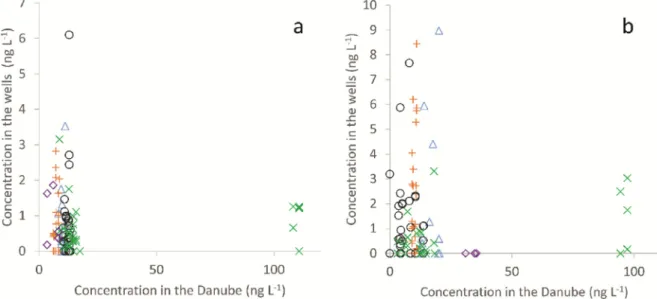
For compounds penetrating riverbankfiltration most frequently, the relationship between the extent of contamination detected in the wells and concentrations measured in the Danube was also studied. It was concluded that there was no linear correlation be- tween the concentrations measured in the two water sources neither in the case of LID nor in the case of TRA, and bankfiltration efficiency was not influenced by concentrations measured in the river (Fig. 2). Consequently, the concentration of these compounds occurred entirely randomly in the DWAWs, independent of the contamination levels in the surface water. Thus, it is increasingly difficult to forecast the emergence of these contaminants in drinking water resources.
The usually lowfiltration efficiency corresponding to relatively stable CBZ concentrations in the Danube in one sampling period
was random in a given area. However, it had some correlation with the Danube; higher surface contamination levels were linked to higher DWAW concentrations, although the correlation was not linear (R¼0.4). This tendency was also present in the case of LTG, but it was less pronounced (Fig. 3). The ERFS for both CBZ and LTG was independent of concentrations detected in the river.
The fate, mobility, and persistence of pharmaceuticals is highly determined by changing local biotic and abiotic environmental factors, such as the pH, temperature, intensity of sunlight, composition of sediments, and microbial activities, which can alter the transformation or adsorption of molecules in natural media (Pal et al., 2010; Li et al., 2014; Patel et al., 2019). The adsorption, however, is the main process controlling the concentration, mobility, toxicity, and the fate of PhACs in the environment and especially in the soil (Yamamoto et al., 2016). The main driver of PhACs sorption in the soils and sediments is rather the soil organic matter (Lambert, 1968) than clay minerals (Szabo et al., 2020).
Besides the quantity, the source, the degree of decomposition, spatial dispersion, and the chemical properties of organic matter also affect the adsorption (Cornelissen et al., 2005; Jakab et al., 2018;Ping and Lou, 2019).
CBZ is known to be a persistent and very stable PhAC (Yamamoto et al., 2009; Tixier et al., 2003), which was further confirmed by thefindings of the present research. It was detected in high concentrations in the Danube and bankfiltrates, indicating low, but sporadically changingfiltration efficiency (Table 3). Even though the biotic (microbial) and abiotic (photo-) degradation of TRA is also found to be small (Bergheim and Giere, 2012), its con- centration decreased in the DWAWs. This indicates that not only the biotransformation of a given PhAC is an essential factor in the Table 3
Efficiency of riverbankfiltration system (ERFS) (%), and literature values for certain pharmaceutically active compounds (PhACs) in the case offiled investigations of bank filtrates.
PhACs Detected average concentrations of PhACs in riverbankfiltrates (ng L1)
Removal rate in %
Current study Riverbankfiltrates along the Danube
Other riverbank filtrates
ERFSconin current study
ERFSfroin current study
ERFS in literature
Carbamazepine BDLe176.06 2e57b) 23e37c) 24e29e)
63.6e179d) 2.89e313i) 15e21k) 0e282l)
27.2 5.6 65.4b)
0e51.8d) 4e20e)
<10h),a)
<25k) 0e44j)
<50e100l)
Lidocaine BDLe6.10 NA 15f)
BDLe2.1k) BDLe214i)
94.6 17.8 incompletef)
80e95k)
Tramadol BDLe8.98 NA BDLe73.7d)
31f) 0e281i) BDLe15j) 3.1e8.8k)
87.9 29.5 3.2e100d)incompletef)
37.5e100j) 0e30k) 0e100l)
Lamotrigine BDLe849.19 NA BDLe54d)
10e48j)
41.3 40 0e100d)
0e43j) BDL¼below detection limit; NA¼not available; Italic: redox dependent.
g(Benotti et al., 2012).
a(Hamann et al., 2016).
b(Kovacevic et al., 2017).
c (Krakko et al., 2019).
d (Kruc et al., 2019).
e(Nagy-Kovacs et al., 2018).
f (Rúa-GomezePüttmann 2012a)
h(Laws et al., 2011).
i(Bradley et al., 2014).
j(Hollender et al., 2018).
k(Huntscha et al., 2013).
l(Oberleitner et al., 2020).
evaluation offiltration efficiency, but the adsorption of the mole- cules is also believed is a principle parameter affecting pharma- ceutical mobility in porous media. The organic matter is considered to be the most important component in the adsorption of hydro- phobic organic pollutants (Chiou et al., 1979;Li et al., 2014;Bielska et al., 2018). Thus, the small decrease in the concentration of CBZ and LTG indicates that the sediment and rock in which the PhACs passed through likely to have low organic matter content.
It was also documented that mineral surface (Martínez- Hernandez et al., 2014) greatly influence the sorption of com- pounds, especially for the ionized molecules. Therefore, it is crucial to clarify whether the given PhAC is present in an ionized or non- ionized form at a given pH because several pharmaceutical mole- cules are weak bases or acids (Newton and Kluza, 1978;Raymond and Born, 1986). LID and TRA are present in an ionized form in the natural waterse TRA is used as tramadol-HCl, LID used as
lidocaine-HCl. This means that one hand, it is highly degradable due to its hydrophilicity (Rúa-Gomez and Püttmann, 2012b), and, on the other hand, they can bind to the mineral phases with elec- trostatic interaction between the particle surface and ionized compounds. Since the sediment surface was predominantly nega- tively charged, it could bind the positively charged TRA and LID with electrostatic forces or with ligand exchange surface complexation onto Al and/or Fe-oxides/hydroxides of the sediment.
It was demonstrated by Martínez-Hernandez et al. (2014), who found that the sorption of cationic species onto the sediment was slightly higher than that of anionic species, while the sorption of neutral species was very low.
In addition, ERFS is likely influenced by the operational schedule of high yield DWAWs. For each frequent PhAC, not only spatial differences can be detected;filtration efficiency may vary over time for a given well, regardless of the seasons (Kondor et al., 2020).
Fig. 2.Measured lidocaine (a) and tramadol (b) concentrations in the Danube and the drinking water abstraction wells. Colors refer to the sampling period as follows: blue triangle:
07/03/18; orange cross: 14/05/18; black circle: 10/09/18; green x: 26/11/18; purple diamond: 14/07/17. (For interpretation of the references to colour in thisfigure legend, the reader is referred to the Web version of this article.)
Fig. 3.Measured carbamazepine (a) and lamotrigine (b) concentrations in the Danube and the drinking water abstraction wells. Colors refer to the sampling period as follows: blue triangle: 07/03/18; orange cross: 14/05/18; black circle: 10/09/18; green x: 26/11/18; purple diamond: 14/07/17. (For interpretation of the references to colour in thisfigure legend, the reader is referred to the Web version of this article.)