ORIGINAL RESEARCH published: 17 October 2019 doi: 10.3389/fenrg.2019.00111
Edited by:
Liandong Zhu, Wuhan University, China
Reviewed by:
Richa Arora, Lovely Professional University, India Yu-Shen Cheng, National Yunlin University of Science and Technology, Taiwan Md. Asraful Alam, Zhengzhou University, China
*Correspondence:
Kornél L. Kovács kovacs.kornel@bio.u-szeged.hu
Specialty section:
This article was submitted to Bioenergy and Biofuels, a section of the journal Frontiers in Energy Research
Received:30 May 2019 Accepted:30 September 2019 Published:17 October 2019
Citation:
Wirth R, Böjti T, Lakatos G, Maróti G, Bagi Z, Rákhely G and Kovács KL (2019) Characterization of Core Microbiomes and Functional Profiles of Mesophilic Anaerobic Digesters Fed With Chlorella vulgaris Green Microalgae and Maize Silage.
Front. Energy Res. 7:111.
doi: 10.3389/fenrg.2019.00111
Characterization of Core
Microbiomes and Functional Profiles of Mesophilic Anaerobic Digesters Fed With Chlorella vulgaris Green Microalgae and Maize Silage
Roland Wirth1, Tamás Böjti1, Gergely Lakatos2, Gergely Maróti2, Zoltán Bagi2, Gábor Rákhely1,3and Kornél L. Kovács1,4*
1Department of Biotechnology, University of Szeged, Szeged, Hungary,2Biological Research Center, Institute of Plant Biology, Hungarian Academy of Sciences, Szeged, Hungary,3Biological Research Center, Institute of Biophysics, Hungarian Academy of Sciences, Szeged, Hungary,4Department of Oral Biology and Experimental Dental Research, University of Szeged, Szeged, Hungary
Microalgal biomass is an alternative feedstock for biogas production although its C/N ratio is usually lower than optimal, therefore co-fermentation is recommended. Biogas production from photoautotrophically grown Chlorella vulgaris (C. vulgaris) biomass (240 mL CH
4g oTS
−1) and co-fermentation with maize silage (330 mL CH
4g oTS
−1) has been studied in semi continuous laboratory biogas fermenters. Maize silage control yielded 310 mL CH
4g oTS
−1. The microbial community and the read-based functional profiles, derived from these data, were examined during the process by using next-generation metagenome Ion Torrent sequencing technology. The read-based core microbiome consisted of 92 genera from which 60 abundant taxa were directly associated with the microbial methane producing food chain. The data-set was also analyzed in a genome-based approach. Sixty-five bins were assembled, 52 of them belonged in the core biogas producing genera identified by the read-based metagenomes. The read-based and genome-based approaches complemented and verified each other. The functional profiles indicated a variety of glycoside hydrolases.
Substantial rearrangements of the methanogen functions have also been observed.
Co-fermentation of algal biomass and plant biomass can be carried out for an extended period of time without process failure. The microbial members of the inoculum are well-conserved, feedstock composition changes caused mostly relative abundance alterations in the core microbiome.
Keywords: biogas, microalgae, metagenome, core microbiome, functional characteristics, binning, co-fermentation
INTRODUCTION
Biomass utilization for alternative energy recovery is commonly considered to be a major
contribution to the renewable energy production targets (Holm-Nielsen et al., 2009; Rehl and
Müller, 2011; Mao et al., 2015; Hijazi et al., 2016). Primary biomass, produced by photosynthesis,
currently comprise predominantly terrestrial plants (Gunaseelan, 1997; Schenk et al., 2008).
Microalgae may represent an alternative to terrestrial crops, because they have higher photosynthetic efficiency and faster growth rates, and they can be cultivated in various aqueous media, like sea, brackish water, or wastewaters (Posten and Schaub, 2009; Debowski et al., 2013; Posadas et al., 2014;
Guldhe et al., 2017; Chen et al., 2018). Benefits of a microalgal biomass include versatility of utilization for energy purposes such as biohydrogen, bioethanol, biodiesel, and biogas production (Posten and Schaub, 2009; Harun et al., 2010; Klassen et al., 2016; Uggetti et al., 2016), and complex biorefinery applications (Yen et al., 2013). The main technological disadvantages, i.e., requirement for large land area and efficient harvesting, are addressed in ongoing research (Estime et al., 2017; Ummalyma et al., 2017).
Microalgal biomass is a promising feedstock for anaerobic digestion (AD), as it is usually rich in lipids, carbohydrates, and proteins, and does not contain recalcitrant lignin (Yen et al., 2013; Ward et al., 2014). The generated biogas yields are typically 10–20% lower, but the methane content is 7–13% higher than that from maize silage (Mussgnug et al., 2010). Successful AD of algal biomass depends on the efficient deconstruction of the cell wall (Córdova et al., 2018). Physical, mechanical, chemical, and thermal pre-treatment methods have been tested to enhance digestion efficiency (Alzate et al., 2012; Lam and Lee, 2012; Passos et al., 2013, 2014, 2018; Lavriˇc et al., 2017). These methods could improve biogas yield, but the energy input is quite high (Carrere et al., 2016). Hydrolytic enzymes have also been proven effective in microalgal biomass pre-treatment (Demuez et al., 2015; Mahdy et al., 2015), although the economy of the process is frequently jeopardized (Vergara-Fernández et al., 2008). Another tool to make the microalgal biomass a suitable AD feedstock is to adjust the carbon to nitrogen ratio (C/N) to a range between 20 and 30 (Yadvika et al., 2004). Low C/N ratios, i.e., <10–15, which are characteristic of microalgal biomass, result in increased levels of free ammonia, i.e., >0.15 g NH
3-N L
−1or >3–4 g NH
+4L
−1, that may become inhibitory (Khalid et al., 2011; Kwietniewska and Tys, 2014). Co-digestion is a straightforward strategy to overcome this obstacle (Mahdy et al., 2015; Wirth et al., 2015a,b;
Rétfalvi et al., 2016; Wang W. et al., 2016).
The microbiological events taking place in the AD reactors fed with microalgae are not fully understood. Early studies used Denaturing Gradient Gel Electrophoresis (DGGE) and identified Methanosaeta sp. and acetoclastic methanogenesis as the main route to biogas formation (Lakaniemi et al., 2011;
Zamalloa et al., 2012). The same conclusion was reached by analyzing the methyl-coenzyme M reductase α -subunit gene (mcrA) by high-throughput amplicon sequencing (Ellis et al., 2012). Amplicon sequencing has limitations arising from possible PCR bias, choice of primers, variable copy numbers in bacterial genomes, sequence variation in closely related taxa, and lack of information about the functions of microbes (Becker et al., 2000;
Vˇetrovský and Baldrian, 2013; Oulas et al., 2015; Campanaro et al., 2018b). Development of high-throughput molecular tools and bioinformatics allowed the investigation of total DNA and could provide a more detailed picture of the microbiome. Ion Torrent PGM
TMwas used to explore the microbial composition of Spirulina AD at alkaline conditions (Nolla-Ardèvol et al., 2015b). A broad range of active membrane proteins were
identified, which were responsible for starch degradation, sugar uptake, metabolism of peptides and osmoprotectants. Bacterial community alterations were observed during the co-digestion of microalgae with used cooking oil, mill residue, and maize silage (Rétfalvi et al., 2016). Similar changes were reported in the AD of Scenedesmus obliquus and microalga-bacteria mix (Wirth et al., 2015a,b). Co-digestion of algal biomass with terrestrial plant biomass apparently facilitated the hydrolytic step.
Search for core microbiota, i.e., the microbial community present throughout the time span of the process and independently of the feeding regime, has gained increasing attention in studying complex systems in microbial ecology (Nagai et al., 2010; Xia et al., 2011; Jami and Mizrahi, 2012;
Schären et al., 2017). Core Operational Taxonomic Units (OTUs), based on 16S rRNA gene amplicon libraries have been reported as being present in diverse anaerobic communities (Rivière et al., 2009; Huse et al., 2012; Rui et al., 2015; Calusinska et al., 2018).
Core microbial communities can be more precisely identified by the combination of read-based and binning metagenome techniques (Nolla-Ardèvol et al., 2015a; Campanaro et al., 2016, 2018a; Heintz-Buschart et al., 2016; Stolze et al., 2016; Treu et al., 2016; Zhu et al., 2018). Metagenomics studies also allow for the extrapolation to ecological functional networks (Schlüter et al., 2008; Wirth et al., 2012; Campanaro et al., 2016; Stolze et al., 2016), although this is of limited information, because the abundances of genes coding for enzymes do not necessarily reflect biological activity (De Vrieze et al., 2016).
We have demonstrated earlier (Wirth et al., 2015a,b) that an algal-bacterial mixed biomass is a suitable substrate for biogas generation. In the present study we report on biogas production from photoautotrophically grown Chlorella vulgaris microalgal biomass. Although microbiologically pure algal biomass is certainly more expensive biogas substrate than an algal-bacterial mixture, it was selected for this study so that the bacterial components, other than the constituents of the microalgal phycosphere, would not distort the core AD microbiome.
To our best knowledge, there are no data about the core microbiota digesting microalgal biomass in semi Continuously Stirred Tank Reactor (CSTR) type laboratory biogas fermenters.
Therefore, our aim was to determine the response of the core biogas producing microbial community in time to the feedstock, i.e., Chlorella algal biomass. The microbial community and the metagenomics-based functional profile, derived from these data, were monitored during the process by using high- throughput sequencing technology (Ion Torrent PGM
TM). The AD parameters and microbial communities in the anaerobic reactors fed with C. vulgaris, maize silage (internal control in the experiment), or the mixture of the two feedstocks were compared.
MATERIALS AND METHODS Feedstock Composition
Biomass of C. vulgaris was obtained from Lisi (Xi’an) Biotech
INC (Shaanxi, Xi’an, China). C. vulgaris had been cultivated in
photobioreactors, under natural light illumination at ambient
temperature. The protein content was 58.50% and the bacterial
count was <100,000 cfu g
−1, according to the specifications of
Wirth et al. Biogas From Chlorella Co-fermentation
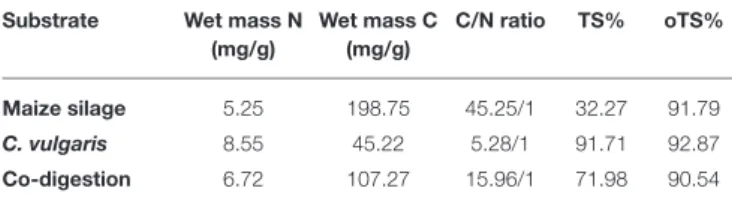
TABLE 1 |Characterization of the feedstocks used in the experiment.
Substrate Wet mass N (mg/g)
Wet mass C (mg/g)
C/N ratio TS% oTS%
Maize silage 5.25 198.75 45.25/1 32.27 91.79
C. vulgaris 8.55 45.22 5.28/1 91.71 92.87
Co-digestion 6.72 107.27 15.96/1 71.98 90.54
N, nitrogen content; C, carbon content; TS, total solid content; oTS, organic total solid content.
the producer. We have confirmed the cfu value by plating the lyophilized material on complex medium (Luria-Bertani agar).
The biomass was stored at 4
◦C until utilization.
Maize silage was obtained from the mesophilic biogas facility
“Zöldforrás Ltd.,” located near the city of Szeged, Hungary. The inoculum sludge was originated from the same place. The plant uses pig slurry and ensilaged plant biomass (maize silage and sweet sorghum mixture) as feedstock. The main parameters of the microalgal biomass and maize silage feedstocks are presented in Table 1.
Anaerobic Digestions
Anaerobic digestions were carried out in three of 5 L CSTRs (Kovács K. L. et al., 2013) in fed-batch operational mode.
The experimental design and time course followed the scheme described previously (Wirth et al., 2015a,b). In short, the apparatus can be fed continuously or intermittently via a piston- type delivery system, the fermentation effluent is removed through an air-tight overflow. The reactors are equipped with a spiral strip mixing device driven by an electronic engine. An electronically heated jacket surrounds the cylindrical stainless steel body, electrodes for the measurement of pH and redox potential are inserted through the reactor wall, in sealed sockets.
The device can be drained at the bottom. The evolved gas leaves the fermentor through the top plate, where ports for gas sampling and the delivery of liquids by means of syringes through silicone rubber septa are also installed. Gas volumes are measured with thermal mass flow devices (DMFC SLA5860S, Brooks). Following the 1 month “start-up” incubation the three reactors were fed as follows: one fermentor received C. vulgaris biomass at a loading rate of 1 g oDM L
−1day
−1(oDM = organic dry matter), one reactor was supplied with a mixture of C. vulgaris + maize silage (0.5 g oDM L
−1day
−1each) and the third one with maize silage (1 g oDM L
−1day
−1). After the “start-up” phase the accumulated gas volume was recorded in every 4 h. The composition of the evolved biogas was measured with a gas chromatograph (6890N Network GC System, Agilent Technologies) equipped with a 5Å molecular sieve column (length 30 m, I.D. 0.53 megabore, film 25 µm). Ultrapure Ar was used as carrier gas, the detection limit for CH
4and CO
2was about 30 ppm. The determination of digestion parameters, i.e., organic dry matter, C to N ratio, NH
+4- N and volatile organic acids/total inorganic carbon was done as previously described (Wirth et al., 2015a,b).
Organic Acid Analysis
Samples for organic acid analysis were taken from the liquid phase of the reactors. The samples were centrifuged
(16,000 g for 10 min,) and the supernatant was filtered through polyethersulfone (PES) centrifugal filter (PES 516-0228, VWR) at 16,000 g for 20 min. The concentrations of volatile organic acids were determined with HPLC (Hitachi LaChrome Elite) equipped with refractive index detector L2490. The separation was performed on an ICSep ICE-COREGEL − 64H column. The temperature of the column and detector was 50 and 41
◦C, respectively. The eluent was 0.01 M H
2SO
4(0.8 mL min
−1).
Acetate, propionate and butyrate were determined (detection range 0.01–10 g L
−1), the latter two were present in traces relative to acetate and therefore they are not included in the results.
DNA Isolation for Metagenomics Study
The composition of the microbial community was investigated six times during the experimental period, i.e., at the starting point and at the end of weeks 1, 5, 9, 12, and 16 (n = 16). For total community DNA isolation 2 mL of samples were used. DNA extractions were carried out using a slightly modified version of the Zymo Research Fecal DNA kit (D6010, Zymo Research, Irvine, USA). The lysis mixture contained 100 µL of 10% CTAB (cetyltrimethylammonium bromide) to improve the efficiency (Wirth et al., 2015a,b). After lysis (bead beating was performed by Vortex Genie 2, bead size: 0.1 mm; beating time: 15 min, beating speed: max), the Zymo Research kit protocol was followed.
The quantity of DNA was determined in a NanoDrop ND- 1000 spectrophotometer (NanoDrop Technologies, Wilmington, USA) and a Qubit 2.0 Fluorometer (Life Technologies, Carlsbad, USA). DNA purity was tested by agarose gel electrophoresis and on an Agilent 2200 TapeStation instrument (Agilent Technologies, Santa Clara, USA).
Next Generation Sequencing and Data Handling
The recommendations of the Ion Torrent PGM
TMsequencing platform were closely followed (Life Technologies, USA). The preparation of sample libraries was made by Life Technologies IonXpress fragment plus library protocol (4471269), Ion device library quantitation kit (4468802) and Step One Real Time PCR (Applied Biosystems) were used to quantify the samples.
The emulsion was done with OneTouch 2 and Ion OneTouch ES devices by using the Ion PGM Template OT2 200 kit (4480974). Barcoding was carried out by IonXpress barcode kit (4471250). Sequencing was performed with Ion PGM 200 Sequencing kit (4474004) on Ion Torrent PGM 316 chip. The characteristic fragment parameters are summarized in Supplementary Table 1. The sequence reads covered the metagenomes sufficiently as demonstrated by the rarefaction curves (Supplementary Figure 1).
The primary sequences produced by Ion Torrent PGM
TMwere further analyzed by the Diamond software, applying the default LCA (Lowest Common Ancestor) algorithm (Buchfink et al., 2014). Diamond filtering parameters were set as follows: Blast Mode: BlastX, Min Score: 50, Max Expected: 0,01, Top Percent:
10, Min Support: 1. NCBI nr and EMBL-EBI InterPro databases
were used for taxonomic and functional alignment (Federhen,
2015). The data were analyzed by Megan6 (Huson et al., 2007, 2011, 2016).
Availability of Data and Material
Sequences are available on MG-RAST under the study name:
“Anaerobic digestion of C. vulgaris microalgal biomass” (ID:
mgp20184). Data are also available on NCBI Sequence Read Archive (SRA) under the submission number: PRJNA544905.
Statistical Analysis of Metagenomics Data
Megan6 (version 6.8.18) was used to investigate microbial community and export data for statistical calculations. UPGMA (Unweighted Pairwise Grouping Method with Arithmetic mean) with Bray-Curtis method was employed to cluster the samples (Bray and Curtis, 1957).
For microbial and functional core calculation the interactive web tool MetaCoMET (Metagenomics Core Microbiome Exploration Tool) was used (Biom formatted data were exported by Megan6). Default parameter sets were fixed at absolute read count threshold: 100, with the persistence Venn diagram type (additional settings: between group relative abundance:
0.8, samples in group relative: 0.8) (Wang Y. et al., 2016).
The functional profiles of the reactors, fed with the various feedstocks, were investigated using metagenomics data and EMBL-EBI InterPro database (Schlüter et al., 2008; Wirth et al., 2012; Campanaro et al., 2016, 2018a; Stolze et al., 2016; Finn et al., 2017; Maus et al., 2017).
Statistical Analysis of Metagenomic Profiles (STAMP; version 2.1.3 Parks and Beiko, 2010; Cai et al., 2016) was used to compute the abundance differences in the case of whole microbiome and core taxa (http://kiwi.cs.dal.ca/Software/STAMP). Dissimilar taxa were identified with two-sided White’s non–parametric t-test (White et al., 2009) at 0.95 confidence intervals and the results with q-value (corrected p-value) of <0.05 were retained.
Metagenomic Binning
Galaxy Europe server was employed to pre-process the raw reads, i.e.,: sequence filtering, mapping, quality checking (https://usegalaxy.org/) (Goecks et al., 2010; Afgan et al., 2016). Low-quality reads were filtered by Prinseq (minimum length: 60; minimum score: 15; quality score threshold to trim positions: 20; sliding window used to calculated quality score: (1) (Finn et al., 2011). Following quality check with FastQC (http://www.bioinformatics.babraham.ac.uk/
projects/fastqc/) (Supplementary Table 4) the good quality reads were co-assembled with Megahit (minimum contig length:
2500; minimum k-mer size: 21; maximum k-mer size: 141) (Li et al., 2015). After simplifying the header of contig FASTA file using the Anvi’o script “reformat-fasta,” Bowtie2 was employed to map back the filtered reads to the contigs (Langmead and Salzberg, 2012). Then we used Anvi’o V5, following the default “metagenomics” workflow (Eren et al., 2015). Briefly, in the first step a contig database was generated, where open reading frames were identified by Prodigal and each contig k-mer frequencies were computed (Hyatt et al., 2010). Then Hidden Markov Model (HMM) of single-copy genes were aligned by HMMER (Finn et al., 2011; Campbell et al., 2013;
Rinke et al., 2013; Simão et al., 2015) (Seemann T, https://
github.com/tseemann/barrnap). We used InterProScan v5.31- 70 on Pfam and Kaiju on NCBI nr database for functional and taxonomic annotation of contigs (Finn et al., 2014; Jones et al., 2014; Menzel et al., 2016; Agarwala et al., 2018). The outputs were imported into the contig database by using the
“anvi-import” command. BAM files, made by Bowtie2, were employed for profiling contig database. This gave sample-specific informations about the contigs, i.e., mean coverage. The sample- specific information was merged together using the “anvi- merge” command. Three automated binning programs, namely CONCOCT, METABAT 2, and MAXBIN 2, were employed to reconstruct microbial bins from the contigs (Alneberg et al., 2013;
Kang et al., 2015; Wu et al., 2015). We also used the Anvi’o human-guided binning and interactive “anvi-refine” option (Delmont et al., 2018). The binning results were directed to the contig database by using “import-collection” command. Anvi’o interactive interface and “anvi-summarize” script was employed to visualize the data (Supplementary Table 4). The manual binning collection consisted of 65 bins accounting for 15,763,220 nucleotides, which represented 32% of all nucleotides stored in the profile database. Minimum Bin size was 8 kb. For average nucleotide identity (ANI) calculation the OrthoANIu algorithm was used (https://www.ezbiocloud.net/tools/ani) (Yoon et al., 2017). Figure finalization was made by open-source vector graphics editor Gimp 2.10.8 (https://www.gimp.org/).
RESULTS AND DISCUSSION Process Parameters During AD
During the anaerobic degradation of the various substrates, temperature (37 ± 0.5
◦C), mixing speed (10 rpm min
−1) and pH (7.5–8.3) were continuously monitored by a software (Kovács K. L. et al., 2013). The redox potential was below − 500 mV throughout the experiment. By the end of the “start-up”
period the residual biogas production ceased completely. Gas production data were collected during weeks 1 through 16 in every 4 h and the cumulative CH
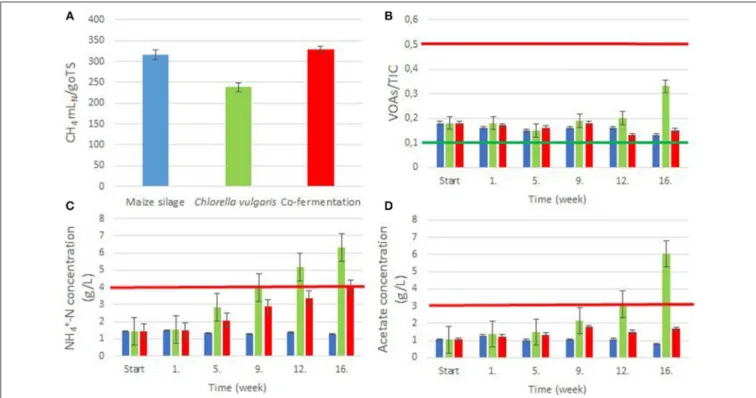
4productions are plotted in Supplementary Figure 5. Figure 1A shows the CH
4yields.
The CH
4content in the evolved gas from C. vulgaris and from maize silage was 57–67 and 50–52%, respectively, these were comparable with previously reported data (Amon et al., 2007; Mussgnug et al., 2010), although in the case of C. vulgaris we measured somewhat lower CH
4than in a previous study (Mussgnug et al., 2010). Co-digestion of C. vulgaris and maize silage yielded an intermediate CH
4value of 57–59%.
The VOAs/TIC (Volatile Organic Acids/Total Inorganic Carbon) ratio is a reliable indicator of a stable digestion process (Lienen et al., 2013). The optimal ratio ranges between 0.1 and 0.5 (Leite et al., 2015). Most of our values fell within this range, due to the low organic loading rate (OLR), indicating a stable and balanced operation in all three reactors, although toward the end of the experimental period the VOAs/TIC in the reactor digesting C. vulgaris alone started to increase (Figure 1B).
The amount of NH
3-N, conveniently measured as NH
+4-N, is
also a critical indicator of stability of the biogas-forming process
(Yenigün and Demirel, 2013). Levels above 4 g NH
+4-N L
−1,
Wirth et al. Biogas From Chlorella Co-fermentation
FIGURE 1 |Biogas digestion process parameters. The feedstocks: blue columns: maize silage; green columns: Chlorella biomass; red columns: maize silage+ Chlorella biomass.(A)Specific CH4yields from the various biomasses.(B)Weekly measured VOAs/TIC ratios. The area between the green and red lines indicates the optimum range.(C)Weekly measured NH+4concentrations. The red line indicates the inhibitory concentration.(D)Weekly measured acetate concentrations. The red line indicates the inhibitory concentration.
corresponding to about 0.15 g NH
3-N L
−1under the current experimental conditions, apparently have a negative effect on the methanogenic community (Chen et al., 2008; Nielsen and Angelidaki, 2008). The inhibitory concentrations reported in earlier studies varied, depending on feedstock, inoculum, environmental conditions, and acclimation (Chen et al., 2008;
Yenigün and Demirel, 2013; Gonzales-Fernandez et al., 2018).
In the reactor fed with C. vulgaris, the NH
+4-N content tended to increase, and by week 9, approached, and later exceeded the limiting inhibitory concentration (week 12: 5.16 g NH
+4-N L
−1or 0.26 g NH
3-N L
−1) (Figure 1C and Supplementary Figure 3).
It is noteworthy that co-digestion showed balanced digestion and approached the limiting NH
+4-N values (3.99 g NH
+4-N L
−1or 0.15 g NH
3-N L
−1) only in week 16. The acetate concentrations (Figure 1D) exhibited a tendency similar to that of VOAs/TIC (Figure 1B). The acetate concentration in the C. vulgaris reactor reached the inhibitory limit of 3 g L
−1(Siegert and Banks, 2005) by week 12. Ammonia and acetate accumulation was due to the low C/N ratio of the microalgal biomass, although the pH remained stable in the C. vulgaris reactor because of the high TIC.
The hierarchical clustering indicated good correlation with ammonia and acetate concentrations suggesting that these parameters prominently affected the development of the microbial communities (Supplementary Figure 3). Co-digestion efficiently prevented ammonia and acetate accumulation corroborating earlier observations (Yen and Brune, 2007; Wirth et al., 2015a,b).
The Core Microbial Community
Although we detected substantial alterations in the AD microbial
communities fed with the various feedstocks, it is intriguing
to see which members of the inoculum community persisted
throughout the time span of the experiment in spite of the
distinct feeding regimes. A mixed algal-bacterial biomass is
the obvious choice of microalgal biomass production for large-
scale biogas generation due to trivial economic feasibility
reasons. It is, however, difficult to separate the bacterial
community introduced with a mixed algal-bacterial biomass
from the community introduced with the inoculum and
adapted to this particular substrate. That is why in this
study we used microbiologcally pure C. vulgaris biomass
substrate to properly establish the core community participating
in the process. The core microbiome exploration tool was
employed (MetaCoMET) in search for this core microbial
community (Rivière et al., 2009; Rui et al., 2015). In the
read-based metagenomics database the “genus” taxonomic rank
was chosen to identify the key players because the depth
of the sequencing allowed the taxonomic resolution at this
level (Supplementary Figure 1). In addition to the read-based
evaluation, we analyzed the same sequencing data-set by three
binning programs to determine the genome-based taxa involved
in the biogas forming process. Due to the high complexity
of the AD microbial community and the drawbacks of short-
read sequencing technology, only a limited number of taxa can
be recovered by binning. The read-based and genome-centric
approaches are complementary in providing a more reliable picture of the AD microbial community.
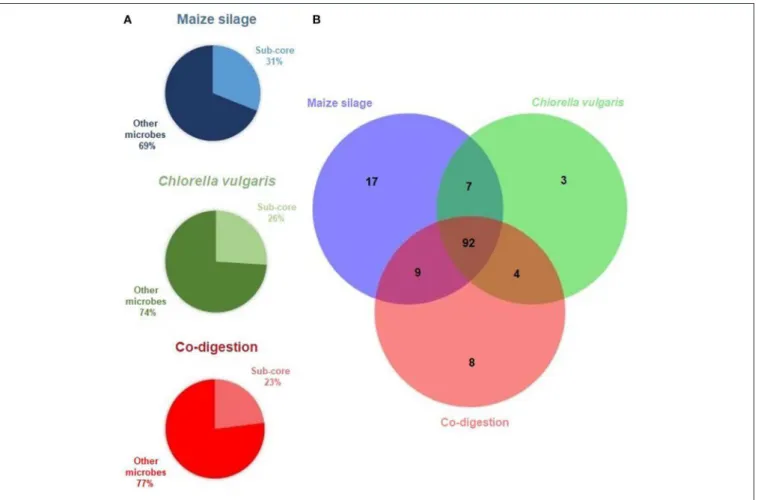
We identified first the sub-cores, i.e., the genera present above threshold abundance (0.8%) at all 5 time points (and in the inoculum) in the reactor fed with each feedstock (Figure 2A).
This distinguished 125 genera in the maize silage AD (31% of all genera detected in this reactor), 106 genera in the C. vulgaris AD (26% of all microbes in this reactor), and 113 genera in the co-digestion reactor (23% of the total microbes in this reactor).
The core community overlapping in all reactors, i.e., the collection of genera found in all 16 metagenomes above threshold, comprised differently abundant 92 genera (Figure 2B and Supplementary Table 2). The composition of the core microbiome is shown in Figure 3. The high number of genera preserved in the core community suggests that the inoculum has a remarkable impact on the evolution of the microbial community in the AD reactor (De Vrieze et al., 2014; Han et al., 2016; Liu et al., 2017; Mahdy et al., 2017; Gonzales-Fernandez et al., 2018).
In the following discussion we combine the read-based metagenomics data with binning results (Figure 4). This
information was used to position the various core genera all along the AD process from polymer hydrolysis to biogas evolution. The assembly of the elements of the “core puzzle” is summarized in Figure 5. Sixty genera from the read-based core taxa could be associated with various stages of AD. From the 65 bins 52 could be related with the methane producing microbial food chain.
It should be noted that 42 of these bins are listed in Figure 5 because bins identified under the same name but distinguishable as separate bins are listed only once.
It general, it is noteworthy that the read-based sequence analyses are complemented adequately by the genome-based approach. The former established a good picture of the participating microbial community at genus level, while the latter indicated several species identification, but also numerous
“uncultured” or partly “unknown” bins. This confirmed that the AD community is only partly understood in details (Campanaro et al., 2018a,b).
The core genera involved in polymer hydrolysis were searched for first (green box in Figure 5). Diversity characterized the order Clostridiales. This is in accordance with previous observations (Wirth et al., 2015a,b) (Supplementary Figure 2).
FIGURE 2 |The results of core microbiome calculation.(A)The Venn diagram presents the sub-core habitat associations within the anaerobic digesters. The sub-cores, i.e., genera present at the 6 sampling times are included in the diagram, and in the intersection of the sub-cores representing the core, i.e., genera shared among all samples.(B)Sub-cores: taxa shared in the communities of the specific feedstock digestion at all 6 time points. Other microbes: genera present in some but not in all 6 samples of the given feedstock.
Wirth et al. Biogas From Chlorella Co-fermentation
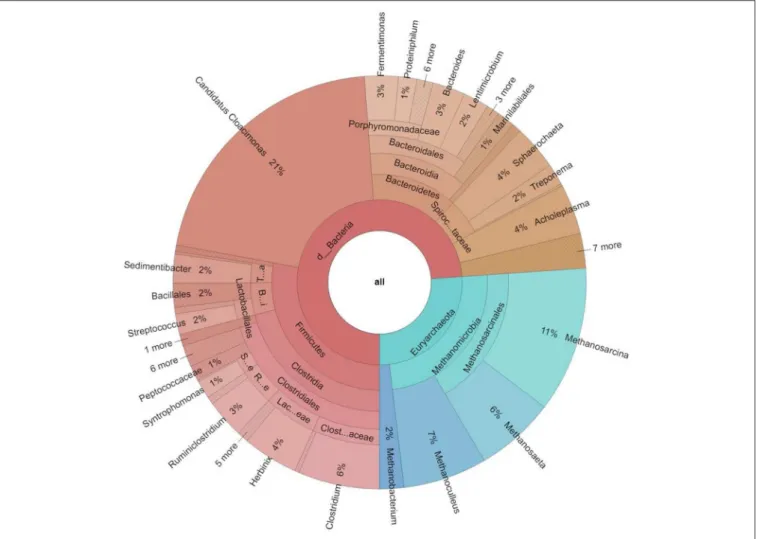
FIGURE 3 |Taxonomic distribution of the core microbiome, i.e., the taxa present in all 16 metagenomes at domain, phylum, class, order, family and genus levels. The
% abundances indicate the mean averages of all samples investigated. Only the genera present in≥1% abundance are listed on the outermost circle. In the domain Bacteriathe generaCandidatus CloacimonasandClostridiumprevailed, amongArchaea Methanosarcina,Methanoculleus,andMethanosaetapredominated.
From the members of class Clostridia nine bins were detected:
three Unknown Clostridia (Bin 1, Bin 18, and Bin 30), Unknown Clostridium (Bin 23), four Clostridium sp. (CAG:1024, CAG:221, CAG:288, CAG:349 as Bin 3, Bin 24, Bin 35, and Bin 49, respectively) and Clostridium stercorarium (Bin 28) (Figure 4). These bins contain a wide variety of putative glycoside hydrolases and genes coding for hydrogen production (Supplementary Table 4). The possible end products from polysaccharide degradation are volatile fatty acids (VFAs) (Lin et al., 2007; Wirth et al., 2012) (Figure 5).
The genome fragment of Herbinix luporum (Bin 25) is predicted to possess cellulose degrading activity, genes coding for endoglucanase and cellobiohydrolase (Koeck et al., 2015).
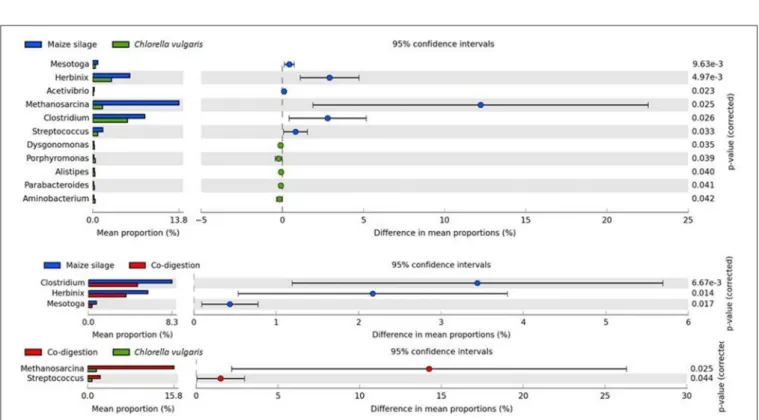
The genera Clostridia and Herbinix showed the largest variances among Bacteria when the substrates maize silage and C. vulgaris biomasses were compared (Figure 6). These hydrolytic genera were considerably more abundant in the reactors supplied with maize silage and a similar trend was apparent in the co- digestion reactor.
The genus Bacteroides is known to possess hydrolytic properties (Pobeheim et al., 2010; Campanaro et al., 2016).
Binning uncovered eleven Bacteroidetes genome fragments (Bins 6, 7, 9, 10, 13, 14, 43, 44, 54, 55, and 56) containing genes for hydrolyzing enzymes (Supplementary Table 4). The genera Clostridium and Bacteroides have been also implicated in the efficient deconstruction of microalgal cell wall (Yen and Brune, 2007; Wirth et al., 2015a).
Ruminiclostridia are able to degrade cellulose and
hemicellulose, and ferment various sugars to VFAs
(Ravachol et al., 2015). Ruminiclostridium thermocellum
(Bin 27) and an unknown Ruminococcaceae (Bin 2)
were identified in the genome-based evaluation. Their
membrane sugar transporter and phosphotransferase
enzyme coding genes may place them among the
hydrolyzing bacteria. Fermentimonas and Lentimicrobium
genera are also among the abundant hydrolyzer core
microbes (Figure 5). Fermentimonas caenicola (Bin 21)
and Lentimicrobium saccharophilum (Bin 8) assembled
FIGURE 4 |Anvi’o interactive display of automated binning based manual assembly results. The dendogram in the center display the hierarchical clustering of contigs based on its sequence compositions. The layers from inside out are: (1) The parent layer that marks the splits originated from the same contigs with gray bars (split size 20,000 bps, e.g., Bin 2). (2) The Kaiju taxonomic layer shows the taxonomy for each open reading frame detected in a given split. (3) The length layer, shows the actual length of a given split. (4) GC-content layer. (5) Ribosomal RNA layer. (6) Gray layers represent a sample and each black bar is the coverage of a given split in a given sample. Orange bars represent SNVs detected, and blue bars shows the number of reads mapped in samples. CONCOCT, MAXBIN 2, METABAT 2 shows the automated binning and MANUAL layer the automated based manual binning results. Each bins and the corresponding taxa are listed around the figure.
genome fragments fit into this picture (Figure 4 and Supplementary Table 4).
The genus Prevotella is a highly diverse taxon comprising various functional niches in different systems through their remarkable metabolic versatility (Matsui et al., 2000; Purushe et al., 2010). Unknown Prevotella (Bin 45) and the two Peptococcaceae bacterium 1109 (Bin 41, 42) and the Coprobacillus sp. CAG:826 (Bin 58) represents this group in the genome-based evaluation (Figures 4, 5).
Genera Paenibacillus, Pseudomonas, Terrisporobacter, Actinomyces, Geofilum, Lachnoclostridium, Cryseobacterium, Oscillibacter, Acetivibrio, and Parabacteroides were found in lower abundances among core microbes (Nelson et al., 2011;
Shida et al., 2012; Lee et al., 2013; Yan et al., 2013; Cho et al.,
2015; Pap et al., 2015; Sun et al., 2016; Gagliano et al., 2017;
Lemos et al., 2017; Nakajima et al., 2017; Neshat et al., 2017; Tian et al., 2017) (Supplementary Table 2).
The core genus, Candidatus Cloacamonas belongs in the
WWE1 candidate division (Pelletier et al., 2008) and has been
found primarily in AD reactors operating with pig slurry (Kröber
et al., 2009; Wirth et al., 2012). This genus predominated by
a large margin in our three digesters (Supplementary Table 2,
Figure 3). Automated binning and subsequent manual assembly
resulted in 2 medium quality (Bins 11 and 65) and one low
quality genome fragment (Bin 12) associated with this group
(Bowers et al., 2017) (Figure 4). Tetranucleotide frequency
and single copy gene content positively placed the two
bins of CC. acidaminovorans separately on the clustering
Wirth et al. Biogas From Chlorella Co-fermentation
FIGURE 5 |The distribution of the core microbial genera along the biogas producing microbial chain of events. The identified core microbes are arranged according to their known physiological roles in the steps of the anaerobic degradation process. Binning results are applied to make more detailed food chain. For detailed explanation see text. SAOB, syntrophic acetate oxidizing bacteria; SPOB, syntrophic propionate oxidizing bacteria. The genera are listed as their mean abundance order in the boxes.
FIGURE 6 |Significant differences in core microbial communities. Significances were determined with two-sided White’s non–parametrict-test at 0.95 confidence.
dendogram, confirmed by all three binning software (Figure 4).
Moreover, average nucleotide identity calculation showed that Bin 11 and Bin 65 were only 68% similar to each other (Supplementary Table 4) (Yoon et al., 2017). Therefore, these two bins identified two separate CC. acidaminovorans-like species. The presence of Candidatus Cloacimonas sp. SDB (Bin 12) confirmed this observation. Bins 11 and 65 both contain genes coding for enzymes participating in the Embden-Meyerhof pathway. In addition, they may produce proteases for biomass degradation and can be involved in a syntrophic metabolism with methanogens (Supplementary Table 4) (Pelletier et al., 2008;
Kröber et al., 2009). In addition to Candiadatus Cloacimonas, a broad diversity of genera took part in acidogenesis/acetogenesis (yellow box in Figure 5) (Hofstad et al., 2000; Bosshard et al., 2002; Sundh et al., 2003; Zhilina et al., 2004; Makarova et al., 2006; Ueki et al., 2006; Wade, 2006; Liu et al., 2008; Guerra et al., 2010; Cibis et al., 2016; Stolze et al., 2016; Li et al., 2017; Zhang et al., 2017). Their abundance did not change substantially in the reactors supplied with the assorted feedstocks.
The core oligosaccharide utilizer and acid producer group was represented by Acholeplasma laidlawii (Bin 26), Lascolabacillus massiliensis (Bin 22), Sphaerochaeta globosa (Bin 37), Unknown Treponema (Bin 52), and Treponema brennaborense (Bin 51). Read-based metagenomics data showed that the genus Streptococcus had low abundance in the digesters fed with microalgae as a monosubstrate (Figures 5, 6). Unknown Streptococcus (Bin 34) was identified as corresponding genome fragment in genome-based analysis (Figure 4 and Supplementary Table 4). The minor saccharolytic genera Dysgonomonas and Alistipes were more abundant in the C.
vulgaris fed reactor. From the members of the genus Alistipes (read-based), Alistipes sp. CAG:831 (Bin 53) was detected by the binning approach. Bins 48, 50, and 59 could be identified as unknown Candidatus zambryskibacteria, Acidaminococcus sp. CAG:917, and Anaerolinae bacterium 49_20 were additional oligosaccharide degraders. Unknown Porphyromonadaceae (Bin 20), unknown Clostridia (Bin 18), Peptococcaceae bacterium sp. 1109 (Bin 41) contained formyltetrahydrofolate synthetase (FTHFS), the indicator enzyme of anaerobic acetate oxidation, therefore these are possible Syntrophic Acetate Oxidizing Bacteria (SAOB) (gray box in Figure 5) (see section Metagenome Based Functional Changes). The genera Syntrophaceticus and Mesotoga are likely to have SAOB function, although bins representing them were not found, therefore this finding is not supported by the genome-based evaluation of data (Westerholm et al., 2010; Wang et al., 2013; Nobu et al., 2015; Müller et al., 2016). Syntrophic Propionate Oxidizing Bacteria (SPOB) were observed in all three reactors at all sampling time points by read-based analysis (Syntrophomonas, Pelotomaculum, and Smithella). These genera are able to convert propionate to acetate, H
2and CO
2(Lueders et al., 2004; Kosaka et al., 2008) in syntrophy with hydrogenotrophic methanogens (blue box in Figure 5). Indeed, Syntrophomonas wolfei (Bin 33) came up in the genome-based evaluation as a well-known SPOB bacterium (Figure 4) (McInerney et al., 1981; Popp et al., 2017). The low abundance of the genera Pelotomaculum and Smithella may explain why these taxa are missing from the binning results.
Similarly, low abundance characterized the sulfate reducing bacteria Desulfotomaculum, Desulfosporosinus, and Desulfitobacterium (Friedrich et al., 1996; Pester et al., 2012) in the read-based metagenomes. These microbes may represent an additional H
2sink in AD. They were also present in all reactors examined and were part of the core microbiome as permanent rivals of reductive homoacetogens and hydrogenotrophic methanogens for H
2(Liu and Lu, 2018) (Supplementary Table 2). Nevertheless, sulfate reducers were not found in the genome-based evaluation.
Methanogenic Archaea populate the last box in biogas formation, highlighted with red in Figure 5. In the inoculum, the genus Methanosaeta was the predominating archaeon over Methanoculleus, Methanosarcina, and Methanobacterium (Supplementary Figure 2). The genera Methanoculleus and Methanobacterium are hydrogenotrophic, while the genus Methanosaeta comprise obligate acetoclastic methanogens.
Among hydrogenotrophic archaea the genus Methanoculleus was represented by Methanoculleus bourgensis (Bin 38), unknown Methanoculleus (Bin 39) and Methanoculleus sp. MAB1 (Bin 40) and the genus Methanobacterium by unknown Methnaobacterium (Bin 32). A member of the genus Methanosaeta was identified as Methanosaeta concilii (Bin 47) among acetoclastic methanogens (Figure 4). Methanosarcina is the only known genus able to produce methane through all three methanogenic pathways, i.e., acetoclastic, hydrogenotroph, and methylotroph (Smith and Ingram-Smith, 2007; Hook et al., 2010; Nettmann et al., 2010; Maus et al., 2012). Several species were detected from the genus Methanosarcina in the binning study. The presence of Unknown Methanosarcina (Bin 64), Methanosarcina horonobensis (Bin 63), Methanosarcina mazei (Bin 62), Methanosarcina acetivorans (Bin 60), Methanosarcina siciliae (Bin 61) indicated that this group was probably the most diverse among methanogens in our system (Figure 5).
Methanosaeta remained predominant in the C. vulgaris fed digester, but their relative number of methanogens decreased in time (Supplementary Figure 2). The genus Methanosarcina replaced Methanosaeta in abundance in the case of maize silage and co-digestion as the experiment progressed (Ellis et al., 2012; Wirth et al., 2012, 2015a; Pope et al., 2013; Klassen et al., 2016) (Figure 6 and Supplementary Figure 2). In earlier studies, both Methanosarcina and Methanosaeta have been reported to be dominant methanogens (Zamalloa et al., 2012;
Gonzalez-Fernandez et al., 2015; Klassen et al., 2016), depending primarily on the actual acetate concentration. Methanosaeta outcompeted Methanosarcina at low acetate concentration, while Methanosarcina predominated Methanosaeta at high acetate levels (Smith and Ingram-Smith, 2007; De Vrieze et al., 2012). Other operational parameters, e.g., NH
3concentration, may also change the equilibrium between these two genera (Chen and He, 2015; Leite et al., 2015; Narihiro et al., 2015;
Chen et al., 2017). The genus Methanosarcina is more tolerant to ammonia, than Methanosaeta (Fotidis et al., 2013; Gao et al., 2015; Niu et al., 2015). This may explain the decrease of relative abundance of methanogens during C. vulgaris AD.
Adaptation of methanogens to high ammonia concentration
could be one solution of ammonia inhibition (Kovács E.
Wirth et al. Biogas From Chlorella Co-fermentation
et al., 2013; Rajagopal et al., 2013; Mahdy et al., 2017) (Supplementary Figure 3).
It is noteworthy that the following precautions have to be kept in mind when the above characterization of the core microbiome is interpreted. (1) The 92-member core genera seem sufficient to cover all basic metabolic steps necessary for biogas formation from the green alga and maize silage. This does not mean, however, that this diversity is the minimum requirement for successful degradation of organic matter and concomitant biogas production (Calusinska et al., 2018; Campanaro et al., 2018a). (2) Here we could reach the genus level resolution of the microbiota by the read-based metagenomes. Some genera have fairly diverse species composition leading to diverse properties of the taxon.
The analysis of the community by genome-based evaluation may help to make more precise understanding of the abundant taxa. Nevertheless, depending on the sequence number and the observed microbiota complexity only the relatively abundant sequences can be compiled in MAGs (metagenome-assembled genomes) or quality genome fragments (Bowers et al., 2017). (3) The information content of the available sequence databases is limited, a portion of the sequenced but not classified reads may belong to “microbial dark matter,” e.g., “unknown” bins such as Bin 5, 15, 17, 29, 31, 36, 46, 57 (Hatfull, 2015; Nobu et al., 2015;
Solden et al., 2016).
Metagenome Based Functional Changes
The metagenomics data were also used to extract potential functional information about the biological activity of the AD communities fed with the various feedstock combinations.
Genes coding for characteristic and signature proteins have been detected and their relative copy number in the samples was determined by counting the reads related to the gene in question. This information was corroborated by the binning study, which helped to associate specific functions to taxa.
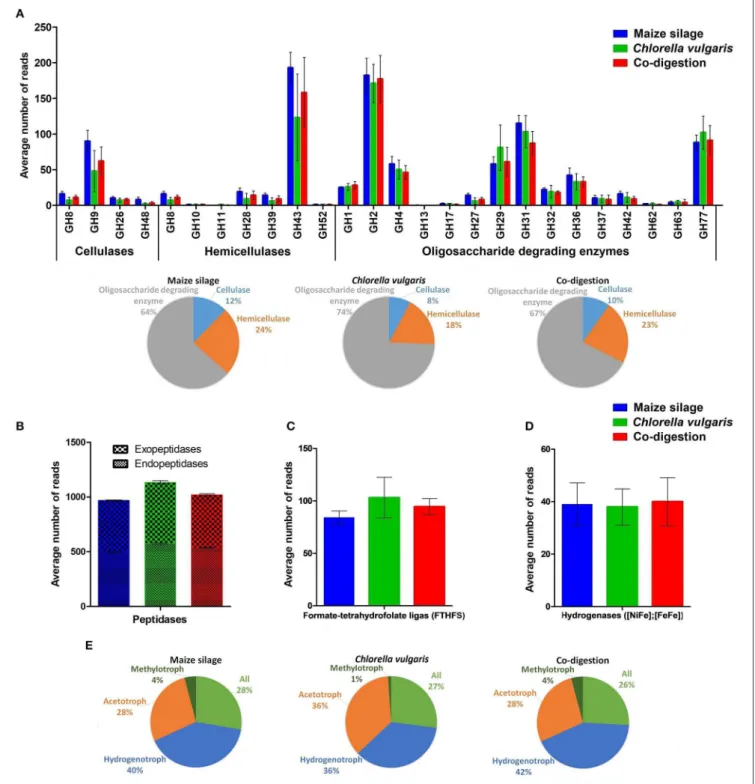
Although the presence of a certain gene and the number of reads linked to it does not necessary mean that the gene is being transcribed and translated, it is safe to assume at least a limited correlation between these parameters (Wirth et al., 2018). The main functional profiles investigated were the carbohydrate-active enzymes (CAZy), protein degradation, syntrophic acetate oxidation, i.e., formate-tetrahydrofolate ligase, hydrogen metabolism and methanogenesis (Figure 7) (Hattori, 2008; Caspi et al., 2014; Lombard et al., 2014; Rawlings et al., 2018). The glycoside hydrolase families (GH) catalyze the breakdown of poly- and oligosaccharides. GH9 predominated the cellulase group. This enzyme family was found in our unknown Bacteroidetes (Bin 13), unknown Porphyromonadaceae (Bin 20), Herbinix luporum (Bin 25), unknown Bacteroides (Bin 43), and in unknown Bacteroidia (Bin 44) assembled genome fragments (Supplementary Table 4). GH9 has been identified in numerous biogas producing ecosystems (Wei et al., 2015; Güllert et al., 2016;
Maus et al., 2016). The GH8, GH9, and GH39 families were detected among the core functions (Supplementary Table 3, green color). As a tendency, the GH genes coding for cellulases were more abundant in the reactors running on maize silage or co-digestion than in the C. vulgaris fed one.
The GH43 enzyme family emerged from the hemicellulases and was found in the unknown Porphyromonadaceae (Bin 20), Fermentimonas caenicola (Bin 21), Lascolabacillus massiliensis (Bin 22), Herbinix luporum (Bin 25), Peptococcaceae bacterium 1109 (Bins 41 and 42), unknown Bacteroides (Bin 43), and Unknown Prevotella (Bin 45). The GH43 family was identified as one of the 15 most abundant GH families in a thermophilic biogas plant (Maus et al., 2016). The richness of cellulases and hemicellulases were reduced in the reactors fed with C. vulgaris biomass. The large number of oligosaccharide-degrading GH enzymes covers a wide range of catalytic activity (Figure 7A).
GH2, GH4, GH29, GH31, GH42, and GH77 were present in all sequenced samples although none of them showed significant (p < 0.02) differences among the various reactor functional profiles. The GH2 and GH31 families were detected in the bins of the unknown Bacteroidetes (Bin 6 and 13), Bacteroidetes bacterium 4484_276 (Bin 7), unknown Porphyromonadaceae (Bin 20), Fermentimonas caenicola (Bin 21), Peptococcaceae bacterium 1109 (Bin 41), unknown Bacteroides (Bin 43), unknown Prevotella (Bin 45) and in two unknown assemblies (Bin 17 and 31) (Supplementary Table 4). It should be noted that not all the GH families presented in Figure 7A are part of the core functions, which are compiled in Supplementary Table 3, highlighted in green color. In general, maize silage and co-digestion appeared to develop similar CAZY profiles.
Based on InterPro data and the EMBL-EBI MERPOS peptidase database classification, a large number of endo- and exopeptidases were present in our digesters (Supplementary Table 3, highlighted in yellow color) (Rawlings et al., 2018). The great variety of peptidases identified by read- based metagenomics was confirmed by binning results. The genes involved in protein degradation were higher in representation in the reactors digesting C. vulgaris than those fed with maize silage (Figure 7B). The known functions of the peptidases in family S51 are nutritional; lack of these enzymes leads to incomplete degradation of intracellular proteins to amino acids (Lassy and Miller, 2000). This peptidase was found in the unknown Bacteroidetes (Bin 6) and unknown Porphyromonadaceae (Bin 20) assembled genomes. The peptidase family M20 was present in the largest abundance among functions (Supplementary Table 3, highlighted in yellow color) in our data set. It was detected in the following 14 bins: unknown Firmicutes (Bin 4), unknown Bacteroidetes (Bin 6), Sedimentibacter sp. B4 (Bin 16), unknown Porphyromonadaceae (Bin 20), Lascolabacillus massiliensis (Bin 22), unknown Clostridia (Bin 30), unknown (Bin 31), Peptococcaceae bacterium 1109 (Bin 42), unknown Bacteroides (Bin 43), Methanosaeta concilii (Bin 47), Coprobacillus sp.
CAG:826 (Bin 58), Methanosarcina horonobensis (Bin 63), unknown Methanosarcina (Bin 64) and one of the Candidatus Cloacimonas acetaminovorans bins (Bin 65). In general, peptidases in the M20 family are hydrolases to complete the conversion of proteins to free amino acids (Martínez-Rodríguez et al., 2012).
Formate-tetrahydrofolate ligase (i.e., formyltetrahydrofolate
synthetase) (FTHFS) was also among the selected signature
enzymes. FTHFS is a highly expressed key enzyme in both
the Wood-Ljungdahl pathway of autotrophic CO
2fixation
FIGURE 7 |Functional profiles.(A)Identified carbohydrate active enzymes (CAZy) categorized by activity, and the proportions of CAZy in the various ADs.(B–D)The distribution of peptidases, formate tetrahydrofolate ligase (FTHFS), and hydrogenases, respectively.(E)Proportions of methanogenic enzymes categorized by methanogenic pathways. Each graph indicates the average of 6 metagenomes belonging to the indicated feedstock.
(acetogenesis) and the glycine synthase/reductase pathway of purinolysis. The key physiological role of this enzyme in acetogens is to catalyze the formylation of tetrahydrofolate, an initial step in the reduction of CO
2and other one- carbon precursors to acetate. In purinolytic organisms, the
enzymatic reaction is reversed, i.e., it releases formate from
10-formyltetrahydrofolate with concurrent production of
ATP (http://pfam.xfam.org/family/PF01268). The detailed
biochemical and regulatory mechanisms behind the shift and
the way in which the bacteria regain energy is uncertain in spite
Wirth et al. Biogas From Chlorella Co-fermentation
of intensive investigations (Pester and Brune, 2006; Ragsdale and Pierce, 2009; Xu et al., 2009). FTHFS was present among the putative core functions (Supplementary Table 3, gray color) and its relative abundance was somewhat elevated in the reactors digesting C. vulgaris relative to the ones fed with maize silage and/or co-digestion (Figure 7C). The FTHFS gene was present in unknown Clostridia (Bin 18), unknown Porphyromonadaceae (Bin 20), Peptococcaceae bacterium 1109 (Bin 41), and in Candidatus Cloacimonas acetaminovorans (Bin 65) assemblies.
The equilibrium between H
2producers and consumers is crucial in methanogenesis (Wirth et al., 2012; Szuhaj et al., 2016;
Bagi et al., 2017). The relative numbers of identified hydrogenase genes were nearly equal in the three reactors (Figure 7D) (Supplementary Table 3, purple color). The gene coding for [FeFe] hydrogenase maturation, HydE was among the predicted core functions. The HydE protein, together with HydF and HydG comprise the accessory gene products for the assembly of an active [FeFe] hydrogenase (King et al., 2006). Genes coding for enzymes involved in iron hydrogenase maturation were found in the metagenome assembled genomes of unknown Bacteroidetes (Bin 6 and 13), Herbinix luporum (Bin 25), Ruminiclostridium thermocellum (Bin 27), and in both Candidatus Cloacimonas acetaminovorans (Bins 11 and 65). The observation suggests an equally important role of H
2metabolism in biogas formation, independent of the feedstock composition.
The genes coding for enzymes involved in the biogas evolution pathways were our final group of signature functions tested.
A collection of 24 methanogenic enzymes were identified (Supplementary Table 3, red color); 14 of them were present in the core. Hydrogenotrophic methanogenesis predominated in maize silage and co-digestion. In contrast, acetoclastic methanogenesis was present in higher proportion when only C. vulgaris was the feedstock (Figure 7E). Among the core methanogenic enzymes, methyl coenzyme M reductase (subunit A, B, G, and D) and CoB–CoM heterodisulfide reductase (subunit B) were detected. Methyl coenzyme M reductase genes were observed in unknown Methanoculleus (Bin 39), Mathanosaeta concilii (Bin 47), unknown Methanosarcina (Bin 64) (Supplementary Table 4). The methyl coenzyme M reductase catalyzes the reduction of methyl-coenzyme M and coenzyme B to methane (Luton et al., 2002; Nunoura et al., 2008).
DATA AVAILABILITY STATEMENT
Sequences are available on MG-RAST under the study name: “Anaerobic digestion of C. vulgaris microalgal biomass” (ID: mgp20184). The data are also available in NCBI Sequence Read Archive (SRA) under the submission number: PRJNA544905.
AUTHOR CONTRIBUTIONS
RW with the help from TB and GL, developed the DNA extraction protocol, designed and performed the experiments, and contributed to the evaluation of metagenomic data. GM organized and performed the DNA sequencing work. KK and ZB conceived the project and participated in its design.
RW and KK drafted the manuscript. GR critically evaluated the manuscript. All the authors have read and approved the final manuscript.
FUNDING
This study has been supported in part by the Hungarian National Research, Development and Innovation Fund projects GINOP- 2.2.1-15-2017-00081, GINOP-2.2.1-15-2017-00033, and EFOP- 3.6.2-16-2017-00010. RW, GL, and GM received support from the Hungarian NKFIH fund projects PD121085, PD123965, and FK123899 financed under the PD16 and FK16 funding schemes. This work was also supported by the János Bolyai Research Scholarship (for GM) of the Hungarian Academy of Sciences.
ACKNOWLEDGMENTS
We acknowledge the research funding received to carry out this study.
SUPPLEMENTARY MATERIAL
The Supplementary Material for this article can be found online at: https://www.frontiersin.org/articles/10.3389/fenrg.
2019.00111/full#supplementary-material
REFERENCES
Afgan, E., Baker, D., van den Beek, M., Blankenberg, D., and Bouvier, D., Cech, M., et al. (2016). The Galaxy platform for accessible, reproducible and collaborative biomedical analyses: 2016 update.Nucleic Acids Res.44, W3–W10. doi: 10.1093/nar/gkw343
Agarwala, R., Barrett, T., Beck, J., Benson, D. A., Bollin, C., Bolton, E., et al. (2018).
Database resources of the national center for biotechnology information.
Nucleic Acids Res.46, D8–D13. doi: 10.1093/nar/gkv1290
Alneberg, J., Bjarnason, B. S., de Bruijn, I., Schirmer, M., Quick, J., Ijaz, U. Z., et al. (2013). CONCOCT: clustering cONtigs on COverage and ComposiTion.
arXiv1–28.
Alzate, M. E., Muñoz, R., Rogalla, F., Fdz-Polanco, F., and Pérez-Elvira, S. I.
(2012). Biochemical methane potential of microalgae: influence of substrate to
inoculum ratio, biomass concentration and pretreatment.Bioresour. Technol.
123, 488–494. doi: 10.1016/j.biortech.2012.06.113
Amon, T., Amon, B., Kryvoruchko, V., Zollitsch, W., Mayer, K., and Gruber, L. (2007). Biogas production from maize and dairy cattle manure-Influence of biomass composition on the methane yield.Agric. Ecosyst. Environ.118, 173–182. doi: 10.1016/j.agee.2006.05.007
Bagi, Z., Ács, N., Böjti, T., Kakuk, B., and Rákhely, G., Strang, O., et al.
(2017). Biomethane: the energy storage, platform chemical and greenhouse gas mitigation target. Anaerobe 46, 13–22. doi: 10.1016/j.anaerobe.2017.
03.001
Becker, S., Böger, P., Oehlmann, R., and Bo, P. (2000). PCR Bias in ecological analysis : a case study for quantitative Taq nuclease assays in analyses of microbial communities.Appl. Environ. Microbiol.66, 4945–4953.
doi: 10.1128/AEM.66.11.4945-4953.2000
Bosshard, P. P., Zbinden, R., and Altwegg, M. (2002). Turicibacter sanguinis gen.
nov., sp. nov., a novel anaerobic, Gram-positive bacterium.Int. J. Syst. Evol.
Microbiol.12, 1263–1266. doi: 10.1099/00207713-52-4-1263
Bowers, R. M., Kyrpides, N. C., Stepanauskas, R., Harmon-Smith, M., Doud, D., Reddy, T. B. K., et al. (2017). Minimum information about a single amplified genome (MISAG) and a metagenome-assembled genome (MIMAG) of bacteria and archaea.Nat. Biotechnol.35, 725–731. doi: 10.1038/nbt.3893
Bray, J. R., and Curtis, J. T. (1957). An ordination of the upland forest communities of souther Wisconsin.Ecol. Monogr.27, 325–349. doi: 10.2307/1942268 Buchfink, B., Xie, C., and Huson, D. H. (2014). Fast and sensitive protein alignment
using DIAMOND.Nat. Methods12, 59–60. doi: 10.1038/nmeth.3176 Cai, M., Wilkins, D., Chen, J., Ng, S. K., Lu, H., Jia, Y., et al. (2016). Metagenomic
reconstruction of key anaerobic digestion pathways in municipal sludge and industrial wastewater biogas-producing systems.Front. Microbiol.7:778.
doi: 10.3389/fmicb.2016.00778
Calusinska, M., Goux, X., Fossépré, M., Muller, E. E. L., Wilmes, P., and Delfosse, P. (2018). A year of monitoring 20 mesophilic full - scale bioreactors reveals the existence of stable but different core microbiomes in bio - waste and wastewater anaerobic digestion systems.Biotechnol. Biofuels11:196.
doi: 10.1186/s13068-018-1195-8
Campanaro, S., Treu, L., Kougias, P. G., De Francisci, D., Valle, G., and Angelidaki, I. (2016). Metagenomic analysis and functional characterization of the biogas microbiome using high throughput shotgun sequencing and a novel binning strategy.Biotechnol. Biofuels9:26. doi: 10.1186/s13068-016-0441-1
Campanaro, S., Treu, L., Kougias, P. G., Luo, G., and Angelidaki, I.
(2018a). Metagenomic binning reveals the functional roles of core abundant microorganisms in twelve full-scale biogas plants.Water Res.140, 123–134.
doi: 10.1016/j.watres.2018.04.043
Campanaro, S., Treu, L., Kougias, P. G., Zhu, X., and Angelidaki, I. (2018b).
Taxonomy of anaerobic digestion microbiome reveals biases associated with the applied high throughput sequencing strategies. Sci. Rep. 8:1926.
doi: 10.1038/s41598-018-20414-0
Campbell, J. H., O’Donoghue, P., Campbell, A. G., Schwientek, P., Sczyrba, A., Woyke, T., et al. (2013). UGA is an additional glycine codon in uncultured SR1 bacteria from the human microbiota.Proc. Natl. Acad. Sci. U.S.A.110, 5540–5545. doi: 10.1073/pnas.1303090110
Carrere, H., Antonopoulou, G., Affes, R., Passos, F., Battimelli, A., Lyberatos, G., et al. (2016). Review of feedstock pretreatment strategies for improved anaerobic digestion: from lab-scale research to full-scale application.Bioresour.
Technol.199, 386–397. doi: 10.1016/j.biortech.2015.09.007
Caspi, R., Altman, T., Dale, J. M., Dreher, K., Fulcher, C. A., Gilham, F., et al. (2014).
The MetaCyc database of metabolic pathways and enzymes and the BioCyc collection of Pathway/Genome Databases. Nucleic Acids Res. 38, 459–471.
doi: 10.1093/nar/gkt1103
Chen, S., Cheng, H., Liu, J., Hazen, T. C., Huang, V., and He, Q. (2017).
Unexpected competitiveness of Methanosaeta populations at elevated acetate concentrations in methanogenic treatment of animal wastewater. Appl.
Microbiol. Biotechnol.101, 1729–1738. doi: 10.1007/s00253-016-7967-9 Chen, S., and He, Q. (2015). Persistence of Methanosaeta populations in
anaerobic digestion during process instability.J. Ind. Microbiol. Biotechnol.42, 1129–1137. doi: 10.1007/s10295-015-1632-7
Chen, X., Li, Z., He, N., Zheng, Y., Li, H., Wang, H., et al. (2018). Nitrogen and phosphorus removal from anaerobically digested wastewater by microalgae cultured in a novel membrane photobioreactor.Biotechnol. Biofuels11:190.
doi: 10.1186/s13068-018-1190-0
Chen, Y., Cheng, J. J., and Creamer, K. S. (2008). Inhibition of anaerobic digestion process: a review. Bioresour. Technol. 99, 4044–4064.
doi: 10.1016/j.biortech.2007.01.057
Cho, H. U., Kim, Y. M., Choi, Y.-N., Kim, H. G., and Park, J. M.
(2015). Influence of temperature on volatile fatty acid production and microbial community structure during anaerobic fermentation of microalgae. Bioresour. Technol. 191, 475–480. doi: 10.1016/j.biortech.2015.
03.009
Cibis, K. G., Gneipel, A., and König, H. (2016). Isolation of acetic, propionic and butyric acid-forming bacteria from biogas plants.J. Biotechnol.220, 51–63.
doi: 10.1016/j.jbiotec.2016.01.008
Córdova, O., Chamy, R., Guerrero, L., and Sánchez-Rodríguez, A. (2018).
Assessing the effect of pretreatments on the structure and functionality of
microbial communities for the bioconversion of microalgae to biogas.Front.
Microbiol.9:1388. doi: 10.3389/fmicb.2018.01388
De Vrieze, J., Gildemyn, S., Vilchez-Vargas, R., Jáuregui, R., Pieper, D. H., Verstraete, W., et al. (2014). Inoculum selection is crucial to ensure operational stability in anaerobic digestion.Appl. Microbiol. Biotechnol. 99, 189–199.
doi: 10.1007/s00253-014-6046-3
De Vrieze, J., Hennebel, T., Boon, N., and Verstraete, W. (2012). Methanosarcina:
the rediscovered methanogen for heavy duty biomethanation. Bioresour.
Technol.112, 1–9. doi: 10.1016/j.biortech.2012.02.079
De Vrieze, J., Regueiro, L., Props, R., Vilchez-Vargas, R., Jáuregui, R., Pieper, D. H., et al. (2016). Presence does not imply activity: DNA and RNA patterns differ in response to salt perturbation in anaerobic digestion.Biotechnol. Biofuels9:244.
doi: 10.1186/s13068-016-0652-5
Debowski, M., Zielinski, M., Grala, A., and Dudek, M. (2013). Algae biomass as an alternative substrate in biogas production technologies - review.Renew.
Sustain. Energy Rev.27, 596–604. doi: 10.1016/j.rser.2013.07.029
Delmont, T. O., Quince, C., Shaiber, A., Esen, Ö. C., Lee, S. T., Rappé, M. S., et al. (2018). Nitrogen-fixing populations of Planctomycetes and Proteobacteria are abundant in surface ocean metagenomes. Nat. Microbiol.3, 804–813.
doi: 10.1038/s41564-018-0176-9
Demuez, M., Mahdy, A., Tomás-Pejó, E., González-Fernández, C., and Ballesteros, M. (2015). Enzymatic cell disruption of microalgae biomass in biorefinery processes.Biotechnol. Bioeng.112, 1955–1966. doi: 10.1002/bit.25644 Ellis, J. T., Tramp, C., Sims, R. C., Miller, C. D., et al. (2012). Characterization
of a methanogenic community within an algal fed anaerobic digester.ISRN Microbiol.2012, 1–12. doi: 10.5402/2012/517524
Eren, A. M., Esen, Ö. C., Quince, C., Vineis, J. H., Morrison, H. G., Sogin, M. L., et al. (2015). Anvi’o: an advanced analysis and visualization platform for ‘omics data.PeerJ3:e1319. doi: 10.7717/peerj.1319
Estime, B., Ren, D., and Sureshkumar, R. (2017). Cultivation and energy efficient harvesting of microalgae using thermoreversible sol-gel transition.Sci. Rep.
7:40725. doi: 10.1038/srep40725
Federhen, S. (2015). The NCBI taxonomy database.Nucleic Acids Res.43, D1086–
D1098. doi: 10.1093/nar/gku1127
Finn, D. R., Clements, J., and Eddy, R. S. (2011). HMMER web server:
interactive sequence similarity searching.Nucleic Acids Res.39, W29–W37.
doi: 10.1093/nar/gkr367
Finn, R. D., Attwood, T. K., Babbitt, P. C., Bateman, A., Bork, P., Bridge, A. J., et al. (2017). InterPro in 2017-beyond protein family and domain annotations.
Nucleic Acids Res.45, D190–D199. doi: 10.1093/nar/gkw1107
Finn, R. D., Bateman, A., Clements, J., Coggill, P., Eberhardt, R. Y., Eddy, S. R., et al. (2014). Pfam: the protein families database.Nucleic Acids Res.42, 222–230.
doi: 10.1093/nar/gkt1223
Fotidis, I. A., Karakashev, D., Kotsopoulos, T. A., Martzopoulos, G. G., and Angelidaki, I. (2013). Effect of ammonium and acetate on methanogenic pathway and methanogenic community composition.FEMS Microbiol. Ecol.
83, 38–48. doi: 10.1111/j.1574-6941.2012.01456.x
Friedrich, M., Springer, N., Ludwig, W., and Schink, B. (1996). Phylogenetic positions of Desulfofustis glycolicus gen. nov., sp. nov., and. nov Syntrophobotulus glycolicus gen. nov., sp., two new strict anaerobes growing with glycolic acid. Int. J. Syst. Bacteriol. 46, 1065–1069.
doi: 10.1099/00207713-46-4-1065
Gagliano, M. C., Ismail, S. B., Stams, A. J. M., Plugge, C. M., Temmink, H., and Van Lier, J. B. (2017). Biofilm formation and granule properties in anaerobic digestion at high salinity. Water Res. 121, 61–71.
doi: 10.1016/j.watres.2017.05.016
Gao, S., Zhao, M., Chen, Y., Yu, M., and Ruan, W. (2015). Tolerance response to in situ ammonia stress in a pilot-scale anaerobic digestion reactor for alleviating ammonia inhibition.Bioresour. Technol.198, 372–379.
doi: 10.1016/j.biortech.2015.09.044
Goecks, J., Nekrutenko, A., Taylor, J., Afgan, E., Ananda, G., Baker, D., et al. (2010).
Galaxy: a comprehensive approach for supporting accessible, reproducible, and transparent computational research in the life sciences.Genome Biol.11:R86.
doi: 10.1186/gb-2010-11-8-r86
Gonzales-Fernandez, C., Barreiro-Vescovo, S., de Godos, I., Fernandez, M., Zouhayr, A., and Ballesteros, M. (2018). Biochemical methane potential of microalgae biomass using different microbial inocula. Biotechnol. Biofuels 11:184. doi: 10.1186/s13068-018-1188-7