DEVELOPMENTAL BIOLOGY SUPPLEMENT 2 , 2 7 4 - 3 0 5 ( 1 9 6 8 )
Order and Control of Neurogenesis (As Exemplified by the Lateral Motor Column)
JERRY J. KOLLROS
Department of Zoology, University of Iowa, Iowa City, Iowa
INTRODUCTION
In this Symposium dedicated to Viktor Hamburger it is a privilege to consider in some detail topics in which he or his students were intimately involved, but to consider them mainly in amphibians rather than in the chick, and to explore those aspects of control that are still in doubt, or in controversy, or even barely remarked upon, let alone even partially understood. The major topic will be the exploration of the origin of that group of nerve cells destined to provide the motor innervation to the muscles of the limbs, and the ways in which these cells are regulated as to their size and number. There have been three recent publications which consider this topic, but not quite all of the pertinent material has been put together in any one. A review, by Arthur Hughes ( 1968 ), deals extensively with the development of the ventral horn, or lateral motor column (LMC), in several groups, but most thoroughly in amphibians. The paper by Prestige (1967) includes brief reviews of contributions by others, as well as his own substantial findings. The review by Kollros (1968a) deals in part with endocrine influences on the lateral motor column, and bears some expansion at present. Other comments by Kollros (1968b) indicate the possibility of inconsistencies in data between Rana and other anuran genera. It will be to some of these that attention will be directed.
Experiments relating development of the motor centers of the spinal cord to the presence or absence of the limbs are over 60 years old.
Braus (1906) reported that 10 days after limb bud extirpation the brachial nerves of Bombinator were of the same size on the two sides, whereas at metamorphosis the side of ablation had distinctly smaller nerves. He concluded that the early growth and differentiation of the spinal cord were independent of function, while the later development was influenced by functional activity. Shorey (1909) reported defects
272
LATERAL MOTOR COLUMN DEVELOPMENT 273 in ventral horn development in the chick, in Ambystoma, and in Bufo
following limb ablation. If the defect was produced before nerve fibers reached the developing muscles, no evidence of degeneration was noted, and thus the differences in cell and fiber number were attributed to failure of neuroblast differentiation.
PERIPHERO-CENTRAL RELATIONSHIPS: CHICK
Hamburger has investigated the role of the limb in the differentiation of the spinal cord of the chick several times. In earlier studies (Ham
burger, 1934; Hamburger and Keefe, 1944) he invoked a relay mecha
nism whereby a reduced limb might elicit a hypoplastic response in the cord, while an enhanced limb periphery (extra limb graft) might elicit a hyperplastic response in the motor centers of the cord. Cell loss as a possible mechanism of control of cell number in the cord had been suggested earlier by Levi-Montalcini and Levi (1942). The study by Hamburger and Levi-Montalcini ( 1949 ) on the development of spinal ganglia in the chick confirmed this mechanism, and suggested the re- examination given in Hamburger's 1958 paper. In this last study, radi
cal wing bud and leg bud extirpations were performed at the stage of the very early bud, and in both systems ultimate reductions of the lateral motor column of 90% or more were achieved. Beginning on day 5, some reduction in cell number on the side of operation could be detected, recorded as a small degree of hypoplasia. The total number of LMC neuroblasts detectable at this time on the control side was nearing 90% of the maximum number for the leg (95% for the wing), so cell loss through degeneration was beginning before quite all the potential cells of the LMC had migrated to their latero-ventral posi
tion. Degeneration begins first in the central segments of the column, gradually extending rostrad and caudad, and at the same time in
creasing in intensity in the central segments. Just before the end of day 7 of incubation, the process reaches its peak, approximately 1700 degenerating cells being detectable at one time in the lumbosacral LMC of the operated side. Of some interest is the fact that degener
ations can also be seen on the control side. On the control side the number of LMC cells at 9-12 days of incubation is approximately 80%
of the maximum number recorded earlier for the lumbosacral area, so it can be suggested that 20% or more of the cells present in the column
"normally" regress. For the brachial segments the loss is only about 10% on the control side. The LMC has within it four distinguishable
274 JERRY J. KOLLROS
groups of cells. After early amputation these seem to be affected by regression at somewhat different times; parts, at least, of the marginal and ventral groups appear to be especially resistant, and small rem
nants of these groups are to be seen in advanced stages, at times when the contour of most of the limb segment of the gray matter is smooth, lacking the characteristic lateral protrusion.
Of considerable interest is the failure of a lumbosacral plexus to form on the operated side, but instead a longitudinally oriented neu
roma is formed which appears to trap and retain the fibers, leaving the limb segments of cord and spinal ganglia. The motor roots on the operated side appear to be of normal size until hypoplasia as detected by cell counts exceeds 10%, and then their shrinkage becomes rapid.
The conclusions of Hamburger were that the initial development of the lateral motor column is determined by intrinsic factors, and that regression of neuroblasts comes about when the peripheral fiber of the nerve cell is inadequately sustained in the periphery. Presumably re
gression is retrograde, resulting from some block to the normal out
growth of the axon. The character of the peripheral influence is as yet unspecified. Hamburger also concludes that the quantitative develop
ment of the lateral motor column is not regulated by an inductive, re
cruitment, or relay mechanism. Since cell degenerations are seen on the unoperated side, it is evident that more LMC neuroblasts are produced and initiate differentiation than survive.
LATERAL MOTOR COLUMN DEVELOPMENT IN ANURANS The older literature dealing with amphibians is reviewed by Piatt (1948), Prestige (1967), and Hughes (1968). The main focus of the remainder of this section will be upon the LMC, largely that of the lumbosacral area, but at times that of the brachial region as well. The normal development of the LMC in Xenopus was described by Kollros (1956), with the first indication of the column being at stage 50 (of Nieuwkoop and Faber, 1956) at lumbar levels, and at stage 51 at brachial levels. Nucleoli are initially very difficult to distinguish but become fairly evident two stages later. The nuclei and cells enlarge continuously, with cytoplasmic caps first being evident at lumbar levels at stage 53, and complete cytoplasmic rims around the nuclei can be seen in many cells at stage 54. The more closely staged series for Rana pipiens (Taylor and Kollros, 1946) was described by Beaudoin (1955), following the pattern for Xenopus. His descriptions, and the stage
LATERAL M O T O R C O L U M N DEVELOPMENT 275 comparison with Xenopus, are given in Table 1, with some modifi
cations after Reynolds (1963) and Race (1961). Xenopus, like Rana, has a progressive decrease in LMC cell number with stage, with fewer than 20 per 10 μ section indicated at stage 55, and fewer than 12 per section at stage 58 ( = to stage XVI of R. pipiens). It was also indi
cated in Xenopus that the largest cells tended to be located in the mid regions of the LMC, whereas both its caudal and rostral limits
TABLE 1
STAGE WISE DIFFERENTIATION OF LUMBOSACRAL LATERAL MOTOR COLUMN CELLS IN Rana pipiens, AND A COMPARISON OF
STAGES IN Xenopus laevis WITH Rana pipiens
Stage in
R. pipiens X. laevis Condition of the lateral motor column
I V + 5 0 + Lateral motor column appears; about 50 nuclei per 10 μ V — section, in 2 or 3 overlapping layers. Nudeoli not always
fully distinguishable, and only slightly larger than other nuclear granules
VIIa 5 2 + Nuclei with long axes approximately 45° away from perpendicular. About 45 nuclei per section. Nucleoli doubled in diameter, while other nuclear granulation has become less obvious. Cytoplasm sparse
IX 53 — Nuclei ovoid rather than elongate, with cytoplasmic caps at their narrower ends. About 39 nuclei per section X I 55 Cytoplasm extending around nuclear borders. About 18
cells per section. Almost no overlapping of t h e motor cells
X I I I 56 Cytoplasm obviously surrounding entire nuclear rim.
About 9-15 cells per section. Nucleoli about triple diameter a t stage I V +
XV 57 Cytoplasm obviously more plentiful. Nissl bodies present.
About 8-9 cells per section
a In hypophysectomized tadpoles of R. pipiens 5-8 months old, as many as 76 cells per section (on the average) may be found, with no reduction in numbers with age.
These tadpoles generally remain with limbs in stages V I - V I I .
tended to have smaller cells (Kollros, 1956). Both Kollros (1956) and Beaudoin (1955) recorded the reduction in cell number on the basis of cell counts per section, and although the relatively rapid loss on a per section basis between stages IX and XIII or XV was suggestive of a significant loss in total numbers, no attempt was made to record total counts. The increase in length of the spinal cord between stages
276 JERRY J . KOLLROS
V and XV is substantial, but it is not at all capable of accounting for the differences in cell count. Total LMC cell counts in Xenopus were recorded by Baird (1957), revealing substantial reduction in cell num
bers between stage 53 and stages 56^58, and slower reduction there
after. Average counts for each stage are given in Table 2. Total counts from the first appearance of the LMC were made by Hughes ( 1961 ), recording initial values of 4000-4500, relatively rapid reduction in numbers by degeneration, to about 1700 cells at stage 59, and then a much slower decline to the end of metamorphosis, with about 1200 cells remaining. The recent study of Prestige (1967) increases these
TABLE 2
TOTAL N U M B E R OF LATERAL MOTOR COLUMN CELLS IN Xenopus laevis Stage
51 52 53 54 55 56 57 58 59 62 65 66
Baird (1957)«
—.
—
3380 3330 3100 2770 2530 —
—
2180
—
1530
Hughes (1961)*
3700 3000 —
4600 3200 3000 2500
—
1700 1650 1300
—
Prestige (1967)«=
—
5700 5500 5600 3700 2900 2650
—
1750 1700
—
1410
a Baird data from a t least 14 animals per stage, except just 9 for stage 53.
b Hughes data estimated from figure (33 counts in all).
c Prestige data from several tables (1-9 counts per stage).
values, to figures near 6000 cells per side at early stages, and final values of 1400-2000 at the end of metamorphosis and in the young toad. In Rana pipiens total cell counts were also made (Kollros and Race, 1960), with a record of rapid reduction in total cell numbers to less than one-half of the original value at about stage XIII, and a slower decline thereafter, with the number at the end of metamorphosis being about 40% of the number present at stage V. A study of LMC development in Rana temporaria by Race and Terry (1965) is again concerned with cell numbers per section and with nuclear size, and fails to deal with total cell numbers. The general pattern of develop
ment is much as in R. pipiens, but with an earlier rapid decrease, and
LATERAL MOTOR COLUMN DEVELOPMENT 2 7 7
a more gradual decrease in cell numbers (per section) after stage X.
Total LMC cell counts, both in early larval life and near or after metamorphosis have also been reported in Hyla punctatissima
( Hughes, 1963 ), Eleutherodactylus martinicensis ( Hughes, 1962, 1965), E. ricordii (Hughes, 1959), and in Bufo marinus (Hughes, 1968). Although cell numbers are quite different between the largest and the smallest of these anurans, and the time scale of development is also different, the pattern of initial large numbers followed by re
duction to 40% or less of the original number is followed by all. This common pattern is of some interest. Now the questions must be asked how this pattern comes about, how may it be altered, what is the ex
tent of alteration possible, and are the possible alterations different between species?
MOTOR CELL-NERVE FIBER NUMBER RELATIONSHIPS Suggestions have been made repeatedly by various authors that the cells which degenerate in the LMC may be those that fail to establish appropriate connections with limb muscles, and that the enhancement of degeneration which follows the removal of the larval limb, or of the embryonic limb bud, is but an extension of this failure to the very large majority of the LMC cells. Of interest in this speculative re
lationship are comparisons of cell numbers and fiber numbers. Most useful in this respect is the study of Hughes (1965) on Eleuthero- dactylus martinicensis, in which he provides both cell counts in the LMC and counts of fibers in the ventral roots. On day 8 of develop
ment (of 14 days) the embryo has over 1000 LMC cells on one side, and about 200 fibers in the four pertinent lumbosacral ventral roots.
The fibers increase in number to about 425-450 on day 13, and then decrease to 300-350. In the same interval the LMC cells decrease in number to about 600 ( day 13 ) and then to about 350-400 on day 14.
Thus, from a 5:1 discrepancy, an approach to unity occurs, both by decrease in cell number and an increase in fiber number. The data presented support the idea that the motor nerve cells in the LMC which fail to make a connection with the muscular limb periphery may be the ones to disappear. There are no comparable studies on Rana, but Van Stone ( 1964 ) provides total fiber counts in the sciatic nerve in the thigh of Rana sylvatica. Fiber numbers range from 734 at stage VI to 1450 at stage IX, 1950 at stage XI, and 2300-2640 in stages XIII- XVI. Inasmuch as there is peripheral branching of fibers, and more
278 JERRY J. KOLLROS
fibers are present in the dorsal roots than in the ventral roots, no care
ful estimate of relationships of motor fibers in the sciatic nerve to LMC cells is possible. Even so, if the LMC of R. sylvatica develops much like that of R. pipiens or Xenopus, there are more LMC cells up to stage XI (by which time regression is well under way) than there are total sciatic nerve fibers, and probably more LMC cells than motor fibers to stage XIII or beyond. Even these fragmentary bits of evidence make attractive the hypothesis that the regressing cells are largely or wholly those which fail to make proper contact with the periphery. It has also been suggested by various authors that those cells which per
sist after radical extirpation of a developing limb probably represent those which innervate the unremoved hip musculature. Hughes ( 1968 ) reports that in old larvae chromatolytic reactions of cells initiated by amputation of the leg (and which thus spare the iliac musculature) extend into the anterior part of the LMC but little, whereas over one- half of the cells toward the posterior end of the LMC show the re
action. This information conforms to the idea that perhaps many LMC cells remaining long after removal of the limb bud may be supplying girdle musculature.
INTRINSIC DIFFERENTIATION CAPACITIES OF THE LATERAL MOTOR COLUMN
Relatively little effort has been placed on establishing the role of the limb in the initial differentiation of the LMC. It is claimed that formation of the LMC first proceeds independently of the limb. This has been shown by Perri (1956a), who demonstrated that the LMC developed after the hind limb primordia had been removed at tailbud stages. Further (Perri, 1956b), it has been shown that transplants of the lumbosacral segments of the early toad spinal cord placed so as to be unlikely to innervate the limbs nonetheless develop an LMC.
When the host animals reach the stages of digit formation in the limbs, regression of the LMC of the grafted cord begins. Hughes (1968), in summarizing the results of Hughes and Tschumi (1960) on grafting embryonic spinal cord plus adjacent somites to the belly of host Xenopus, states "Primary motor neurons are present, but no ventral horn cells can be found in any of the grafts." Similar experiments have been prepared on R. pipiens in our laboratory, utilizing grafts of either the brachial or the lumbosacral areas of the cord with adjacent somites, with donors in tailbud stage and hosts in the earliest larval
LATERAL MOTOR C O L U M N DEVELOPMENT 2 7 9
stages (Fig. 1). The grafts subsequently demonstrate that they are sensitive by wiggling upon being touched. In addition there are spon
taneous twitching activities. The LMC in these preparations develops and persists, at least to metamorphic climax, so far as the lumbosacral cord is concerned. It is possible, of course, that the graft carried with it some cells predestined to form pelvic girdle musculature, and thus appropriate for innervation by LMC cells. The procedure employed in the grafting, however, makes this unlikely. The preparations have not been looked at carefully for traces of pelvic musculature, nor for the possibility that the graft fibers extend to the pelvic musculature of the host. The cord, however, was looked at, and counts were made to in
dicate the approximate LMC cell numbers (Table 3; Figs. 2-4). Fur
ther work will be required to resolve the discrepancies between the Xenopus and the Rana material.
T A B L E 3
GRAFTS OF LIMB SEGMENTS OF THE SPINAL CORD AND ADJACENT SOMITES, SHOWING L M C DEVELOPMENT, AND COMPARISONS WITH THE H O S T C O R D "
Stage Graft cell number per section Host cell number per section
Lumbosacral VI
XIII
XV X V I
XVII XVIII
X I X X X
XXII
V I I X I I X I V
5.0 4 . 8 4 . 5 7.7 1.4 6.2 1.3 4 . 4
5.9
Brachial 55 11.2 2 0 . 3
37.;
20.
12.1
— - -
7.Î
—
1 4 J 9 J
33 34.{
40.(
° D a t a from W. Ann Reynolds (unpublished).
THYROID HORMONE EFFECTS ON THE LATERAL MOTOR COLUMN Since thyroid hormone influences various aspects of neural develop
ment in anurans (see Kollros, 1968a), it is appropriate to consider whether thyroid hormone also has an eflFect upon the development of the LMC. A direct test of this was made by Beaudoin (1956), who implanted thyroxine-containing pellets of cholesterol into two sites in
280 JERRY J. KOLLROS
lÉlIlIliii s
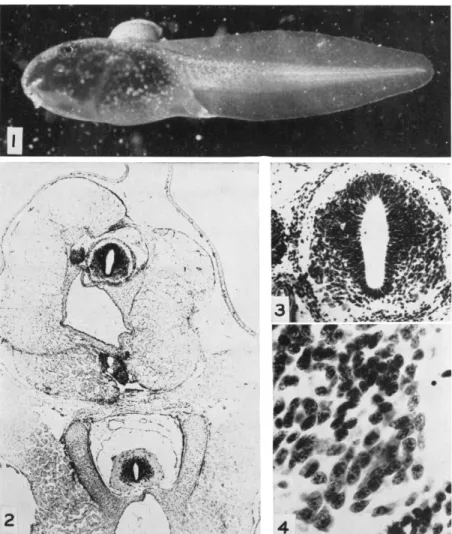
FIG. 1. Stage I tadpole of Rana pipiens with dorsal graft of posterior spinal cord and adjacent somites of tailbud embryo. One day after operation.
FIG. 2. Cross section through region of graft of stage VII, showing host cord below, and graft above with cord, notochord, and somites.
FIG. 3. Enlargement of the graft spinal cord from Fig. 2, showing lateral motor columns on both sides.
FIG. 4. Enlargement of the right lateral motor column area, from Fig. 3.
Several nuclei with enlarged nucleoli are evident.
LATERAL MOTOR COLUMN DEVELOPMENT â8l normal R. pipiens tadpoles: into one hind limb and into the neural canal adjacent to the lumbosacral cord. In the first location the pellet brought about more rapid growth and differentiation of the limb in which it was placed than in the contralateral one ( as earlier reported by Kaltenbach, 1953), and a corresponding highly significant advance in LMC differentiation of the ipsilateral side, as measured by LMC nuclear sizes; in only 4 cases of 19, however, there was a readily de
tectable distinction in appearance of LMC cytodifferentiation levels.
This asymmetrical response indicates an indirect influence of the locally increased limb size upon the cells in the cord. The pellets within the neural canal, in contrast, could be expected to exert a direct effect, and this result was in fact obtained in 12 animals, in which sizes of LMC nuclei on the pellet side were very significantly larger than on the opposite side, more distant from the hormone source.
Hypophysectomized tadpoles are, of course, functionally thyroidless, never metamorphosing, and capable of limb development only to stages VI or VII (rarely VIII) in R. pipiens. The LMC forms in the hypophysectomized animal, but retains characteristics of the early larval condition, i.e., large numbers of very small cells per section, with little indication of cytoplasm (Kollros and Race, 1960; Race, 1961). Such tadpoles can be stimulated to metamorphosis and limb growth by immersion in thyroxine or its analogs, and LMC cell num
ber tends to change in conformity with the changes going on in the limb (Fig. 5). Cell size, however, for reasons not understood, lags behind the cell number changes, at all levels of stimulation up to 20 /xg/liter of ίΖΖ-thyroxine, and without regard to the thyroxine ana
logs, i.e., triiodothyropropionic acid, tetraiodothyropropionic acid, or tetraiodothyroformic acid (Figs. 6 and 7). It has also been shown in E. martinicensis that differentiation of LMC cells is accelerated by treatment with thyroxine and retarded by treatment with phenyl- thiourea (Hughes, 1966). In contrast to R. pipiens, however, neither thyroidectomy nor hypophysectomy stops the decline in cell number that is experienced by the E. martinicensis embryo.
The question can also be raised as to when the cells which are des
tined to form the early LMC can be distinguished from the cells of the adjacent mantle layer. Reynolds ( 1963 ) has examined the cord of Rana pipiens with care in the stages just prior to LMC formation. She reports that in stages up to III no indication of an LMC is given. Stage IV may be a long-lasting stage. During the mid period of this stage,
282 JEBBY J. KOLLKOS
XXV-
xx:
U J X V -
o <
l·-CO v
X-
.v:
c
\ · \ ·
• \ o ·
• \ 8 °
• ü o ö y n - α ^
• o
— Τ — I — Ύ — 1 — 1
) 10
θφ a
\ D φ Ο
• ^^<.
oo ^ - ^ ^
2 0 ~
D
""""^S·
3 0 ~
• 0
4 0
•
6θ"~
Tfa
CELL NUMBER
FIG. 5. Relationship of developmental stage to cell number per section in the lateral motor column in normal Rana pipiens (large solid circles and line), and in hypophysectomized tadpoles. The small dots to right represent unstimulated hy- pophysectomized tadpoles from Race ( 1961 ). The open circles represent hypophy
sectomized tadpoles which had been immersed in dZ-thyroxine solutions of con
centrations of 0.4 /ig/liter or less for 40-200 days (open circles) or in various thyroxine analogs (see text) at those concentrations at which their action approxi
mated that of the thyroxine solutions used (open squares). Each dot, circle, or square represents at least 11 sections counted near the center of the lateral motor column. Note the close agreement of control with experimental animals.
50-1 4 0 J
œ3 0- 2 z 2 0 -
υ ion °ooo°d> o
1 ' \ ' 1 ■ 1 40 60 80 100 I20_
NUCLEAR SIZE . w 140 " Ί— 160
FIG. 6. The same animals and cells as in Fig. 5, but showing the relationship of cell size to cell number. Filled circles and line represent the control animals.
Open circles represent those stimulated by thyroxine or thyroxine analogs. Note that in almost all cases for a given cell number per section (scale on left) the hormone-stimulated animals have smaller cells than the control animals. Each dot, circle, or square represents at least 50 cells.
LATERAL M O T O R C O L U M N DEVELOPMENT 283
V-f ■ \ 1 1 1 1 1 1 1 | 60 80 100 120 140 160
NUCLEAR SIZE, »2
FIG. 7. The same animals and cells as in Figs. 5 and 6, but showing the re
lationship of cell size to stage. Filled circles and the line represent control animals, while the open circles are those stimulated by thyroxine or its analogs. Note that in almost all cases the hormone-stimulated animals have smaller nuclei than have control animals of the comparable stage.
there is a suggestion that cells of the mantle layer located at or just below the midpoint of the cord are beginning to migrate ventro- laterally, and by the end of this stage such an aggregation of cells can be indentified in the lateral portion of the gray matter, near its ventral border, but not yet projecting into the white matter. By stage V this projection into the white matter is unmistakable. By measurement of cell nuclei in the early LMC and the adjacent mantle, and in the pre
sumed position of the prospective LMC cells in stages prior to V, Rey
nolds provides data that the prospective LMC cells are substantially larger, on average, than are the adjacent mantle cells. With this in
formation for background, Reynolds stimulated limb development and metamorphosis by immersion of late stage embryos (stages 24-25 of Shumway, 1940) or young larvae (larval stages I to IV—) into thy
roxine solutions of 10-50 ^g/liter for periods of 4-14 days. She dis
covered that cell size changes paralleling those of normal development could be elicited precociously. Since treatment of animals at embryonic stages 23 and 24 lagged behind those animals whose treatment was begun at stage 25 or later, by about the time interval normally re
quired for the embryo to advance from stages 23-24 to 25, she con
cluded that the capacity of the prospective LMC cells to respond to thyroxine was not present prior to stage 25. Of some interest here is
284 JERRY J. KOLLROS
the demonstration by Moser (1950) that it is also at stage 25 that the limbs attain the capacity to respond to thyroid hormone. At these levels of stimulation, the differentiation of the LMC cells outdistances the development of the limb. After 6 or more days of treatment, the prospective LMC cells had gained the staining capacities of differen
tiating LMC cells, i.e., a lighter staining reaction, and a fine rather than a coarse granulation of the nucleus. In some, caps of cytoplasm were present, a feature ordinarily not found until stages VIII-IX according to Beaudoin (1955), even though the attained limb stage in these ani
mals was only IV or V. If the start of thyroxine treatment was delayed until animals were in stages II to IV—, the extent of the enhancement of cytodifferentiation was much greater than for the younger animals.
While limb stage advanced to from VI to VIII — , the LMC cells de
veloped complete cytoplasmic rims around their nuclei, a condition not ordinarily found until stage XIII. Thus cytodifferentiation ( includ
ing cell growth) and limb development proceeded asynchronously.
Of some interest also is the more dorsal development of the LMC in the stimulated animals, and the failure, at least in the youngest cases, of the LMC to be clearly set off from the mantle. Additionally, in the animals treated for 8-12 days, there was also found a significant change in cell number. Whereas at stage V a cell number of 50 cells per sec
tion, or more, might normally be expected, in the experimental animals whose limbs were at stage V the numbers ranged from 13 through 35 per 10 μ section. Further, degenerating cells and pycnotic nuclei could be identified in the LMC. Thyroxine stimulation apparently brings about precocious cytodifferentiation, which involves appropriate but early nuclear differentiation, synthesis of cytoplasm, and for those cells destined to regress, unusually early regression through pycnosis.
There are several features of these stimulated animals, however, which differ from normal. First, the early setting aside of the LMC occurs dorsal to the usual position, and frequently without a distinctive sep
aration from the mantle layer of the sort characteristic of normal ani
mals; there appears, therefore, to be little if any acceleration of mi
gration of the presumptive LMC cells. Second, the LMC cells advance in differentiation and growth faster than does the limb, and there thus develops an asynchrony between these two related developing systems of the sort not seen when lesser concentrations of thyroxine are used to stimulate older animals (Kollros and Race, 1960; Race, 1961).
Finally, the cells of the LMC, over the time interval considered here
LATERAL MOTOR COLUMN DEVELOPMENT 285 (which in every case preceded the attainment of stage V by control
animals), did not attain the orientation of about 45 degrees from the perpendicular which is so characteristic of the LMC cells in stages V-IX and even later. It seems clear that certain features of LMC de
velopment are amenable to acceleration by thyroxine treatment, whereas others are not.
INFLUENCE OF TEMPERATURE
One other aspect of LMC development which might have some re
lationship to thyroid hormone levels is worthy of mention. It involves the culture of tadpoles at different temperatures. Within limits, the lower the temperature the larger is the tadpole, and the longer are the legs (Etkin, 1955; Kollros, 1961). R. pipiens tadpoles were placed, be
ginning at stage V, into containers maintained at 22°, 18°, 14°, 10°, or 6°C. At the coldest temperatures animals were kept up to 7 months beyond stage V, and there they advanced only to stage XIII. At 10°C they developed to stage XVII, but at the three higher temperatures they progressed beyond stage XX. When sample animals were com
pared at stage X, the lumbosacral LMC counts ranged from a low of 4900 cells at 22°C to a high of 6920 at 6°. Similar samples at stage XVII gave counts of 2525 and 4690 at 22°C and 10°C, respectively.
Finally, at stage XX counts were 2245 cells and 3620 cells, at 22°C and 14°C, respectively (Decker, 1967). In each case animals kept at intermediate temperatures showed intermediate cell numbers. The possibilities for hormonal involvement arise from two separate con
siderations. First, in the cold, there appears to be storage in the hypo
thalamus of neurohumoral secretory materials, and presumably a much slower transmission of these to the hypophysis. This may reduce TSH release and in turn lead to a reduction in thyroid hormone production and release, and thus of thyroid hormone levels in the blood
(Voitkevich, 1962, 1963; Etkin, 1964). Alternatively, thyroid hormone levels need not be affected, but instead thyroid hormone threshold re
quirements might be elevated in the cold, as has been indicated by other studies (Kollros, 1958, 1961). Possibly both of these hormonal mechanisms may be operative. The way in which the LMC responds to the cold is not at all clear. Do more cells than usual migrate to the LMC? If so, is their status as potential LMC cells determined before they reach the LMC position, or only later? Alternatively, is the de
generation of cells inhibited, permitting more to survive to any given
286 JERRY J. KOLLROS
stage? Or are both of these possibilities operative? At present, there is no way to choose among the alternatives.
PERIPHERO-CENTRAL RELATIONSHIPS: ANURANS
Let us now turn to the role of the limb in regulating LMC cell num
ber. The early study of Braus (1906) suggested that early phases of LMC development might be intrinsically controlled, i.e., independent of the limb, whereas later a dependence upon the limb developed.
The various- authors who have worked upon both early and late phases of LMC formation and maintenance could generally agree with this conclusion (see Piatt, 1948; Prestige, 1967; Hughes, 1968; Hamburger, 1958). Of special interest may be the situation of the hypophysecto
mized tadpole. In R. pipiens it was demonstrated ( Race, 1961 ) that the hypophysectomized tadpole, at the age of perhaps 3 months and again 9 months, retained LMC cells at the size characteristic of the stage V-VII euthyroid tadpole, and at somewhat increased numbers per section, i.e., 50-76 (average = 62). Inasmuch as the older tadpoles of this group were of a body size characteristic of stage XVII-XX tad
poles rather than of the much smaller control stage VII tadpoles, there is a great likelihood that these animals had an elongated spinal cord and had many more than the normal number of LMC cells. This par
ticular feature is under investigation. There is no reason to believe that the untreated hypophysectomized tadpole might not retain the LMC in largely undeveloped form indefinitely. Amputation of a leg bud in these hypophysectomized tadpoles appears to have no influence upon the LMC; cell size and cell number are identical on operated and unoperated sides, 20, 60, 100, and 150 days after amputation
(Race, 1961). The possibility of an effect a few days after the oper
ation, and then a restoration of the original cell number, was not in
vestigated. Beaudoin (1955) removed limb buds from stage II—III R.
pipiens tadpoles, and fixed the animals 19-55 days later, at stages VIII, IX, XI, XIII, and XVI. In the animals in stages IX-XIII he found uni
formly that the operated side had more cells, and of smaller size, than did the control side. Differences in both number and size were sig
nificant. On the operated side cytodifferentiation of the LMC had progressed only to stage IX, whereas on the control side it was ap
propriate for the attained stage of the animal. At stage XVI, in con
trast to earlier stages, there were only 18% as many cells on the oper
ated side as on the control side; apparently a very rapid cell loss from
LATERAL MOTOR COLUMN DEVELOPMENT 287 the LMC had taken place. The remaining cells on the operated side were slightly larger than at stage XIII, but remained very much smaller than those on the control side. The same kinds of results were obtained by Kollros and Race (I960) after unilateral amputations of hypophysectomized animals which had been stimulated to limb growth by immersion in dilute solutions of thyroxine. Regeneration was commonly obtained, but on the side of amputation the LMC cell number remained large and the cell size small, compared to the con
trol side. Once again the appearance of the cells was reminiscent of those of stages younger than were indicated by the control limbs. Since the animals were not sacrificed soon after amputation, there is no in
formation as to any changes that might have occurred during the first week. In studies stimulated by the results of Hughes ( 1961 ) tadpoles of Pseudacris nigrita were fixed daily in the period from the second through the seventh day after amputation at stages IV through IX—
(stages at which regeneration is achieved). Those studied on the second through the fourth day showed a cell loss on the side of am
putation. Those fixed at 7 days ( after removal of a small regenerate on the fifth day ), however, had more cells in the LMC on the side of am
putation than on the control side (Pearson and Kollros, 1961). See Tables 4 and 5.
The studies by Baird (1957), in Xenopus, are pertinent here, as in each of his animals he removed the distal one-half of the right limb at stages 50-54, permitting regeneration if it occurred. In most the left limb was untouched, but in others it was amputated as near its base as possible, and if it regenerated it was amputated again. In each in
stance, when animals were fixed at 5 or 10 days after amputation, or later, the right LMC had fewer cells than did the control LMC on the left. Similarly, following complete amputation of the left limb, the left LMC had fewer cells than did the right LMC. Complete regener
ation of the right limb was obtained in 41 animals, comprising only those operated upon in stages 50, 51, or 52. In each instance cell num
bers on left and right sides were nearly equal when counted at stages 58, 62, and 66. In no instance were the differences in cell counts be
tween the two sides significantly different. When regeneration was absent or incomplete, cell counts on the operated side were uniformly less than those on the control side. Apparently the early postoperative decline in cell numbers on the operated side does not proceed so far as to reduce cell numbers below the values normally seen at stage 58.
288 JERRY J. KOLLROS TABLE 4
C E L L NUMBERS IN THE L M C OF Pseudacris nigrita AFTER UNILATERAL AMPUTATION ON LARVAE IN STAGES IV THROUGH I X —
( F I X E D AFTER 31-79 H O U R S )
Time after operation (hours)
31 31 31 . 31 55 55 55 55 55 79 79 79 Average :
Cell numbers«
Operated side
288 342 271 297 236 305 249 262 241 305 274 284 279
Control side
300 396 272 338 293 307 325 271 269 310 312 335 311
Difference
12 54 1 41 57 2 76 9 28 5 38 51 31
Stage at fixation
V I I I + I X - I X VIII I X + V I I I + IX V I I + I X - I X VIII VIII +
a Counts are from sample sections spaced equally throughout the length of the lateral motor column.
TABLE 5
C E L L NUMBERS IN THE L M C OF Pseudacris nigrita AFTER UNILATERAL AMPUTATION ON LARVAE IN STAGES IV THROUGH I X —
( F I X E D AFTER 7 DAYS) Cell numbers(
Operated side
174 211 179 235 288 268 243 247 243 Average: 232
Control side
141 190 157 150 231 170 138 239 192 179
Difference
- 3 3 - 2 1 - 2 2 - 8 5 - 5 7 - 9 8 - 1 0 5 - 8 - 5 1 - 5 3
Stage at fixation
X I I - X I I I X I I X I + X - X I I I + X I I I X - X I I
° Counts are from sample sections spaced equally throughout the length of the lateral motor column.
LATERAL MOTOR COLUMN DEVELOPMENT 289 This implies that in the stages just preceding 58, the rate of regression
of cells in the control LMC must be greater than that experienced by the LMC of the operated side, in order to permit the two sides to show equal numbers. Baird concluded that initial development of the LMC is based on factors intrinsic to the cord, but that peripheral control of differentiation is gradually established. It was further suggested that the decline in cell number which occurs naturally, and which is ac
celerated and enhanced by amputation, is experienced by those LMC cells not connected to a muscular periphery. He also suggested that the cellular response might be associated with increasing thyroid hor
mone content of the blood. The apparently permanent nature of the LMC of hypophysectomized (and thus effectively thyroidless) tad
poles, whether in otherwise normal tadpoles or in those having suffered an amputation (Kollros and Race, 1960; Race, 1961) supports this last suggestion.
DEGENERATION IN THE LATERAL MOTOR COLUMN
It is now necessary to provide other data, from the laboratory of Dr.
A. Hughes and his associate Dr. M. C. Prestige, to explain control of cell number in the LMC. In the initial studies of Kollros (1956) and Baird (1957) on Xenopus, and of Beaudoin (1955, 1956) on Rana, at
tention was paid largely to cell numbers and to the maximum or aver
age level of cy to differentiation. Relatively little was paid to the way in which cell number reduction came about, and it was suggested, in the absence of obvious evidence of cell degeneration, that those LMC cells which failed to remain in the LMC reduced their size and their dif
ferentiation to appear like the cells of the adjacent mantle, into which they slowly migrated. In contrast, Hughes ( 1961 ), Hughes and Lewis
( 1961 ), and Hughes and Fozzard ( 1961 ) reported that adjustment of cell numbers in the LMC came about primarily by degeneration of neuroblasts. Hughes (1961) attempted to establish the degeneration time of individual cells by establishing the number of excess degenerat
ing cells found in the second and third day after amputation in Xenopus, and in relating this to the cell deficit accumulated over that time period, he calculated that the average time for total cell de
generation was 3.2 hours. The studies were on animals presumably in stages 55-56, which Hughes indicates is the period of peak numbers of degenerations, and the time of the most rapid decline in total (or viable) cell numbers. By the third day after amputation, the number
290 JERRY J. KOLLROS
of degenerating cells is seen to be about the same on the two sides again, and in the "older" animals at least, disparities in total cell num
bers are again small. At least occasionally, as in R. pipiens, the side of amputation has more cells than the control side. Hughes utilized 8 larvae fixed in the period between 24 and 60 hours after amputation.
In these the average number of excess degenerations seen was 49, and the average rate of excess cell loss was 15.4 per hour. It is from these figures that the 3.2 hours for degeneration time are derived. If these figures are accepted, for the time being, and the numbers of cells iden
tified as degenerating at any given stage are noted, it should be pos
sible to calculate the total number of cells that undergo degeneration.
Degenerations are first seen at stage 52, and are not seen after stage 62. During that period cell number in the LMC declines from about 4000 to about 1200 (Hughes, 1961). Prestige (1967) indicates initial cell numbers at about 6000, and final cell numbers at 1400-2000. He also extends the period of cell degeneration to stage 64, while sug
gesting that the peak stage for degeneration is 54. Of special im
portance is the conclusion of Hughes ( 1961 ), on the basis of the count of degenerating cells and the calculation of degeneration time, that a total of 10,150 cells must undergo degeneration in the LMC. If these figures are correct, one can account for the cell number in the LMC by assuming that there must be a continuous migration of cells from the mantle layers into the LMC, their differentiation into neuroblasts there or on the way, and the loss of most or all of these recruits. If 10,150 cells are lost, and some 1200 survive, a total population of at least 11,350 must be accounted for. Since no more than 4500 cells were seen initially, presumably about 7000 had to be recruited after the time the LMC could be identified. Hughes points out that during the peak period of degeneration, some 360 cells per day must disappear, whereas the average daily change in cell number is only 160; the re
cruitment of 200 cells per day in this peak period must therefore be accomplished. Even after stage 59, cell death rate accounts for 75 cells per day, whereas the average loss detected by cell counts is only 8 per day. Recruitment at this late stage (equivalent to stage XVII in E.
pipiens) must still be going on. The study of Hughes and Fozzard ( 1961 ) indicates that X-irradiation can influence cell degeneration. At appropriate irradiation levels, cell degeneration can be reduced, but with a rebound several weeks later, when supranormal degeneration rates can be detected.
LATERAL MOTOK COLUMN DEVELOPMENT 291 That other anurans behave with respect to LMC cell loss and re
cruitment much as indicated for Xenopus has been reported in several instances. In Eleutherodactylus ricordii, degenerating cells have been observed in the period from 7 days before hatching, with degenerations at a maximum rate in the period 5-3 days before hatching, and with degenerating cells becoming infrequent the day before hatching
(Hughes, 1959). Inasmuch as total cell numbers changed but little, it is suggested that the cell losses are made up by differentiation of LMC neuroblasts from indifferent mantle cells, with the rate of recruitment nearly matching the rate of cell loss. Maximum LMC cell counts were made at 5 days before hatching. Pycnosis and cell degeneration (Figs.
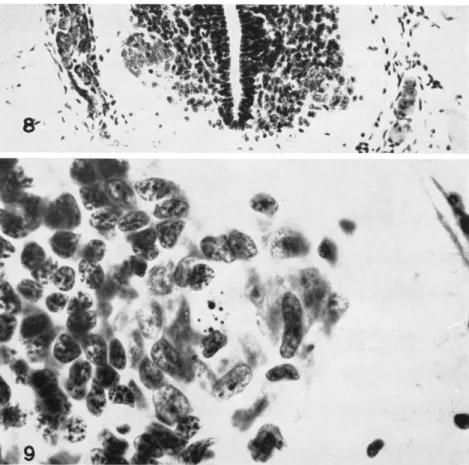
8 and 9) have been reported in Pseudacris (Pearson and Kollros, 1961 ), and in Rana pipiens, at least after strong thyroxine stimulation (Race, 1961; Reynolds, 1963).
CELL MIGRATION INTO THE ALREADY ESTABLISHED LATERAL MOTOR COLUMN
It is now necessary to inquire as to the evidence supporting cell re
cruitment into the LMC after its initial formation, and that which might suggest little or no recruitment. The strongest evidence, although not direct, is that of Hughes (1961), with his computations of de
generation rate, changes in cell number, and necessity of implying migration. There is the work of Hamburger (1958), in which the initial number of cells seen in the LMC is smaller than that seen one day later, even after some degeneration of cells has been noted. Apparently not all the cells destined to be in the LMC migrate from the mantle at the same time. This conclusion is substantiated by the work of Fujita (1964), utilizing tritiated thymidine labeling, who reports that some ventral horn neuroblasts are produced as late as day 6 of incubation, and, of course, require additional time for migration to their definitive position. Further, the suggestive counts of Race (1961) of up to 75 LMC cells per section in large hypophysectomized tadpoles, which can be expected to have a longer LMC than do smaller normal tad
poles at stages V-VI, persuades us to look at such an animal for the possibility of a greater count. The studies with tadpoles kept in the cold, after stage V, resulting in cell numbers at stage X in excess of those seen at room temperatures at stage V also suggest continued re
cruitment of cells ( Decker, 1967 ).
The recruitment of cells into the LMC presumes one of several sit-
292 JERRY J. KOLLROS
FIG. 8. Cross section of lumbosacral area of the spinal cord of Pseudacris nigrita at stage IX, 55 hours after the right hind leg was amputated. Note that the right lateral motor column is smaller and less organized than is the one on the left.
FIG. 9. Enlargement of the right lateral motor column from Fig. 8, showing debris in central area from degenerating cells. Contrast the coarse granular ap
pearance of the mantle cell nuclei with the much more finely granular appearance of the large lateral motor column nuclei, with their prominent nucleolus.
uations. First, there may be potential LMC cells already committed to LMC differentiation, lying in the mantle until the appropriate stimulus to migrate arrives. Second, there may be a pool of cells as yet un
committed toward LMC differentiation, which can be induced to develop into motor cells by appropriate stimuli for migration and dif
ferentiation. Thii'd, recruitment may presume the production of new
LATERAL MOTOR C O L U M N DEVELOPMENT 293 cells and their assignment to one or another kind of fate. With respect to this last feature we have the study of Reynolds (1966) on mitotic activity in the lumbosacral cord of Rana pipiens. The mitotic rate of the ventral part of the cord is low throughout the period from stage 25 to larval stage IX, and very low thereafter. In stages 25-IV the rate is fairly low in the dorsal one-half of the cord (near 1-1.5 divisions per 10 μ section ). It falls at stage V, rises sharply for stages VI-VIII, and then falls sharply. If one assumes that prospective LMC cells arise largely or wholly from the ependyma of the ventral one-half of the cord, there is no great support for massive production of cells for the LMC during the early part of the larval period, and none for the per
iod beyond stage IX. ( It is essentially during the stage IX-XVI period that cell regression takes place, and during which, in Xenopus, cell re
cruitment is presumably going on most rapidly.) Some preliminary data (Kaung and Kollros, unpublished) with tritiated thymidine labeling show that, while other rapidly developing systems take up the thymidine after injection at stages IV and V, there is virtually no labeling of LMC cells ( perhaps 20-30 LMC cells labeled, in any given stage, with fixations at various times up to metamorphic climax). In contrast, injection of the thymidine at stage III has produced up to 800 labeled cells in the LMC. If these findings are substantiated they will support the idea of formation of presumptive LMC cells perhaps through stage IV, but they will weigh against later formation. They do not, of course, provide any evidence as to the possibility of recruiting from the mantle layer cells produced at an earlier time. If the produc
tion of additional prospective LMC cells as late as stage III is borne out, this may provide an alternative explanation to the finding of low LMC counts ( Reynolds, 1963 ) in the study involving thyroxine stimu
lation of very young larvae. Her counts may have been low, in part, because of early and accelerated cell regression, but they may also have been low because production of all potential LMC cells had not been completed by the time of fixation of the stimulated tadpoles.
Hughes (1963) studied the pigmentation of neuroblasts by the re
tention of melanin originally present in the egg in several anuran species, among them Hyla punctatissima. At a stage when cell degen
eration had just begun, and again soon thereafter when cell degener
ation was proceeding at a much higher rate, he recorded about 3% of the LMC neuroblasts as heavily pigmented. Although the proportion of pigmented cells degenerating at these stages was in excess of that
294 JERRY J. KOLLROS
for nonpigmented cells, nonetheless, of the postmetamorphic cells re
maining in the LMC, 3% were pigmented (cell loss in this LMC was about 80%). Hughes thus concluded that some, at least, of the early formed neuroblasts survive as mature neurons. More recently the data on this species have been presented in somewhat different form
( Hughes, 1968 ), in which in the older larva it can be seen that LMC cell numbers have begun to decline near the anterior end of the LMC while there has been an increase in cells toward the posterior end, es
sentially of unpigmented cells. This change in proportions suggests cell turnover, i.e., recruitment of new and thus unpigmented cells into the LMC. The degeneration studies indicate that these new cells tend to be spared at first, but not later. Since the total cell counts represent only two animals per stage, and the figures concerned with proportions near the two ends of the LMC may be dealing with but a single ani
mal, it is difficult to assess this information as critical in establishing significant recruitment. In fact, the detection of 3% of the cells as pig
mented at each of the three stages studied might be considered evi
dence against the idea of recruitment.
Hughes ( 1968 ) indicated that cells which are recruited to the ven
tral horns "begin their differentiation within the mantle layer before migrating laterally." A preliminary test of this possibility has been made in the brachial LMC of R. pipiens (Pollack, personal communication).
It is based on the simple notion that, although nuclear sizes do overlap between the population of LMC cells and mantle cells, if cells in the mantle are being converted into LMC cells, whether the initial burst of growth occurs at the edge of the mantle or in the LMC, there should be a substantial overlap in nuclear size distribution. While such over
lap is substantial in the smallest nuclear size class in Table 6 for stages VII and IX, there is virtually no such overlap in stages from XIII onward. This distribution conforms to the expectations of little or no recruitment. The distinctions are by no means so clear, however, if the next larger size class is also considered. The data, at best, are suggestive.
It also seems useful to consider the assumptions that have gone into constructing the scheme that provides figures on recruitment. An as
sumption stated by Hughes (1961) is that the amputation does not significantly alter the rate of recruitment of LMC cells from the mantle over the test period. Unstated assumptions are that over the test period (approximately 24-60 hours after amputation), cell loss is linear with
LATERAL MOTOR COLUMN DEVELOPMENT 295
TABLE 6
AVERAGE SIZES OF L M C CELLS AND ADJACENT MANTLE CELLS IN THE BRACHIAL CORD OF Rana pipiensa'b
Stage VII
IX X I X I I I XV XVII X I X X X I X X I I I XXV 70-mm juv.
LMC Av.
size (M2)
57 59 71 84 92 94 120 113 127 105 150
mantle Av.
size - (M2)
41 49 45 55 59 58 67 65 68 65 64
Percent below 51.3 μ2 L M C
36 41 9 1 2 0 0 1 0 0 0
Mantle 75 65 76 45 24 38 6 22 0 0 12
Percent between 53.1 and 79.6 μ2·
L M C 60 51 65 36 27 26 9 5 11 9 2
Mantle 25 35 24 51 74 60 84 66 89 96 82
Percent between 81.4 and 106.2 μ*
L M C 4 8 23 47 44 43 32 39 23 48 23
Mantle 0 0 0 4 2 2 10 12 11 4 6
a No mantle cells exceeded 106 μ2 in size. LMC cells of larvae were up to 209 μ2 in size, and those of the juvenile were up to 260 μ2.
b Data courtesy of Emanuel D . Pollack (unpublished).
time, and that the number of cells starting to regress is uniformly dis
tributed in time. If these assumptions are not borne out, the figures for recruitment will be in error. Further, there is an unstated assumption that the length of time required for cell degeneration is uniform during the interval when such degenerations are detectable (at least stages 52-62 ). No direct data bear on this feature, but we know that thyroid hormone influences whether cells do or do not enter into degeneration, and we have data from other sources suggesting that the concentration of thyroid hormone is not uniform over the period of modification of LMC cell numbers. There is the further problem that the data relating to degeneration time ( following amputation ) were obtained at a stage of the most rapid spontaneous cell loss. The variability of cell numbers from animal to animal of approximately the same stage is quite great at these stages, and any chance variation in the figures obtained from the 8 pertinent specimens might change the average cell loss (and therefore cell recruitment) figures considerably. Of some relevance to the problem of recruitment are the data from amputations at stages which result in a period of larger cell counts on the operated side than on the control side. That such cell counts are obtained has been re
ported by Beaudoin (1955) in Rana, Hughes (1961) in Xenopus,
296 JERRY J . KOLLROS
Prestige (1967) again in Xenopus, Hughes (1964) in Eleutherodacty- lus, Palladini and Alfei ( 1966 ) in Bufo, and Pearson and Kollros ( 1961 ) in Pseudacris. In every instance in which sufficient information is avail
able, the side of amputation displays one of two patterns. Either there is a rapid cell loss on the side of operation, and then a decline in loss on that side, until the control side with its more gradual but continuing loss shows a greater cell deficit, or else the operation results in little or no decline in cell number on the operated side, and either at once or shortly there is a deceleration in regression rate on the operated side but not on the control side, so that an apparent excess of cells appears on the operated side. Eventually, of course, the operated side does lose an excess of cells, and in the absence of limb regeneration has a much lower LMC number than does the control side. What is signifi
cant is that the apparent excess of cells on the operated side can in every instance be accounted for by a lessened cell loss, even though temporarily, as compared to the control side, and in no instance need one invoke an excess of cell migration, i.e., recruitment, into the LMC, to account for the disparity in cell counts between the two sides. One possible exception is cited by Hughes (1962), representing an E.
martinicensis embryo which received a hindlimb graft in place of an amputated forelimb. Two such instances, upon fixation after 3 and 4 days, had at least 200-350 more cells than amputated controls. Hughes sees that most LMC cells on the side of operation are in earlier stages of differentiation than in the control, and concludes that as many cells have degenerated on the side of the graft as would have degenerated following amputation alone, and that the graft has elicited the new differentiation of at least 200 LMC cells from the adjacent mantle. His conclusion comes from the nuclear sizes of cells, their response to silver staining, and the statement (without cell degeneration data), that the remains of degenerations are as numerous as in animals suf
fering amputation alone. The unpublished data of Pearson and Kollros (abstract in 1961), relating to the rapidly developing Pseudacris con
flict with the interpretation by Hughes, and support, instead, the idea that the LMC responds by maintaining its cells, both with respect to cell number and cy to differentiation level, in a condition proper for a younger animal, e.g., close to the stage attained at the time of ampu
tation. Later, rapid degeneration of most of the cells follows, if re
generation does not occur. Cell counts daily or at closer intervals, over
LATERAL MOTOR COLUMN DEVELOPMENT 297 days 1-5 and then day 7, fail to show a loss in cell number followed by a gain. The "cell sparing" idea jibes with the data.
CYTODIFFERENTIATION IN THE LATERAL MOTOR COLUMN Of special value, now, is the recent study in Xenopus by Prestige (1967), in which amputations at different stages were carried out, with fixations of the operated animal spaced over the period from operation to the end of metamorphosis. A series of juvenile toads also suffered unilateral amputation at the hip. If the operation was per
formed early, cell loss was prompt and considerable (e.g., 40% of the initial number in 1 week, or perhaps 2000 cells from an initial 5000- 6000 cells, with the operation at stages 52-53). As a consequence of the large early loss, late loss was much less. The comparable data of Baird (1957), following unilateral amputation at stages 50-52 gave very comparable cell losses at the same fixation stages. Amputation at midlarval stages (57 in Xenopus) gives a different result. There tend to be somewhat more LMC cells on the operated side than on the in
tact side. This difference lasts for 2-3 weeks, well into the phase of metamorphic climax, and is followed by a precipitate decline in cell number just at the end of metamorphosis. During the period of cell excess many chromatolytic cells can be seen on the side of amputation.
If the operation is delayed until stage 61, when Xenopus is entering the climax phase of metamorphosis, results are similar to those just described, but the eventual reduction in cell numbers may be delayed until after metamorphosis. Finally, if amputation is delayed until after metamorphosis has occurred, survival of cells is extensive, little cell loss having occurred before week 12, and with some indication of loss continuing into the ninth month. Again, as in the last instances, chro
matolytic cells were seen in the period following amputation and be
fore cell loss. Prestige did not extend his amputations into the very early larval period, for it had been shown earlier (Perri, 1956a; Hughes and Tschumi, 1958) that amputation prior to stage 52 has no im
mediate effect upon the LMC, and its initial numbers are unaffected.
Prestige interprets his present findings and the earlier studies as con
sistent with the notion that the LMC is composed of populations of three different kinds of cells, so far as their response to amputation is concerned. First (phase 1), there are the early neuroblasts, which do not respond to the amputation of the limb. Second (phase 2), there
298 JERRY J. KOLLROS
are the slightly more mature cells which respond to limb loss by rapid degeneration, usually within 3-4 days. Third (phase 3), there are the still more mature LMC cells, in which the degenerative response to amputation is delayed by a period of chromatolysis. This chromatolytic predegenerative phase is extended with increasing age of the larva and juvenile toad. Presumably all phase 3 cells were initially of the phase 2 type, and before that of phase 1 character. Initially, of course, all cells of the LMC are in the early neuroblast phase, in which the cell is independent of the limb, so far as its differentiation is concerned.
Some cells presumably quickly pass into the second, dependent phase, and again quickly into the third phase, in which chromatolysis pre
cedes cell loss. Prestige indicates that no cells are in the third phase as early as stage 54, whereas by stages 55-56 there are some such cells, and by stage 57 many more. Further, he suggests that some cells are still in the first or independent phase as far along in development as stage 61-62. It would be interesting to see an analysis of the differenti
ation of cells in the LMC, stage by stage, to see the extent to which cell appearance might correlate with the interpretation of cell be
havioral capacities. There are no detailed studies of this sort available, although Beaudoin (1955) gives an approximation to such an analysis based on cell sizes alone in R. pipiens, rather than on other aspects of cell differentiation. Table 7, derived from Baird (1957), presents simi
lar material from Xenopus. The two sources emphasize the very large
TABLE 7
SIZES OF LUMBOSACRAL LATERAL MOTOR COLUMN CELLS IN LARVAL STAGES OF Xenopus laevisa
Size range Average cross-sectional area
Stage 0*2) 0*2)
53 23-85 53 54 19-116 64 55 19-113 68 56 19-164 75 58 21-202 82 62 24-226 93 66 26-171 83
α Data from Baird (1957). At stage 53 two animals were used; at all other stages 4 animals were used. At least 85 cells per animal were measured. The presence of some very small L M C cells throughout the larval period is consistent with the idea of recruitment from the adjacent mantle.