AERODYNAMIC TESTING AT MACH NUMBERS FROM 15 TO 20
J . L u k a s i e w i c z1, J a c k D. W h i t f i e l dz and R. Jackson*5
A R O , Inc., Tullahoma, Tennessee
ABSTRACT
Recent developments of Hotshot-type tunnels are summarized which indicate that, except for the heat transfer measurements which still show appreciable scatter, satisfactory force and pressure measurements can be obtained in the Mach number range from 15 to over 20 at stagnation temperatures from 3000 to
kOOO Κ and reservoir pressures from 15,000 to 20,000 psi.
Drag measurements of slender delta wing models at M/ Re^
values of 0.01 to Ο Λ for the hot and cold wall case and shock shapes, pressure distributions and drag measurements of slender cones having various degrees of bluntness are presented and compared with theoretical estimates.
INTRODUCTION
The development of electric arc heated, hotshot, hyperveloc- ity wind tunnels has been a continuing effort at the von Karman Gas Dynamics Facility (VKF), Arnold Engineering Development Center (AFSC). Flow contamination, associated with the direct heating of the working gas by an electric arc, was found to be the most serious problem. Significant advances in the reduc- tion of flow contamination in the VKF Hotshot tunnels at lim- ited test conditions now permit realistic experimental studies of certain aerodynamic phenomena.
The current status of the VKF Hotshot tunnels and the results of experimental studies of surface pressure distributions and
Presented at ARS International Hypersonics Conference, Cam- bridge, Massachusetts, August l 6 - l 8 , I96I; the work reported herein was sponsored by the United States Air Force and con- ducted at the Arnold Center of the Air Force Systems Command.
-^Chief, von Karman Gas Dynamics Facility.
^Assistant Branch Manager, Hypervelocity Branch, VKF.
3Branch Manager, Hypervelocity Branch, VKF.
47?
HYPERSONIC FLOW RESEARCH
drag measurements on simple two-dimensional and axisymmetric bodies are the subject of this paper.
HOTSHOT DEVELOPMENT AND PERFORMANCE
During initial operation of the VKF Hotshot tunnels, flow contamination caused serious errors in aerodynamic measure- ments, especially heat transfer rates (Refs. 1 and 2 ) . Flow
contamination existed in two different forms, gaseous and solid particle contamination.
Gaseous contamination resulted from: depletion of oxygen caused by oxidation of arc chamber and throat components; and hydrogen addition from decomposition of nylon arc chamber lin- ers and insulators. Gaseous contamination was eliminated al- most completely by using nitrogen as the working gas instead of air, by using metal liners instead of nylon and by reducing the exposed surface of nylon insulators (Ref. 2 ) . Nitrogen is a satisfactory substitute for air provided stagnation tempera- tures are restricted to 3000 to kOOO K; nitrogen is essentially a perfect gas in this regime. This restriction was not con- sidered intolerable because free flight Mach and Reynolds num- bers could still be simulated for numerous practical flight paths.
Solid particle contamination, caused mainly by melting and sublimation of arc chamber components, was still excessive even with nitrogen at these relatively low temperatures. Early in i960 an arc chamber development program was undertaken to reduce particle contamination to levels at which contamination erros would be small. This program has been reasonably suc- cessful in both of the AEDC Hotshot tunnels and will be de- scribed briefly here (Refs. 2 and 3 ) · Most of the tests were made with nitrogen at stagnation conditions as follows: tem- perature between 3000 and kOOO K, density of 100 relative atm and pressure of approximately 16,000 psi. Mach numbers in Hotshot 1 were approximately l8 and ranged in Hotshot 2 from 18 to 22.
TUNNEL HOTSHOT 1
This tunnel (Fig. l) consists mainly of an a-c chamber con- nected to a 10-deg (total angle) conical nozzle, followed by a l6-in. diam cylindrical test section and a cylindrical vacuum tank. Electrical energy stored in condenser banks is dis- charged through an electric arc between electrodes in the arc chamber thereby raising the enthalpy of the gas initially stored in the arc chamber. The arc is initiated by disinte- grating a trigger wire with energy from a separate trigger
condenser. When a pre-selected arc chamber pressure is reached a diaphragm bursts, and the hot high pressure gas accelerates through the nozzle. The arc duration is approximately l m s , and quasi-steady flow is established in the test section in approximately 10 ms. There follows approximately 20 ms of use- ful run time before flow breakdown occurs. A more complete de- scription of this tunnel and its mode of operation may be found in Ref. 2.
The initial and current arc chamber configurations (l6-A and l6-C, respectively) used in the development program with this tunnel are shown in Fig. 2. The significant improvements to the arc chamber consisted of the use of coaxial electrodes (Fig. 2b) with the entire liner acting as one electrode, the use of polished copper liners for each run, and the addition of a circular copper baffle plate to shield the throat from the arc.
Several methods for monitoring progress were used; however, the most effective were loss of weight by electrodes, gain in weight by a particle collector in the test section, and com- parison of measured to theoretical heat transfer rates at the stagnation point of models with hemispherical noses. The par- ticle collector consisted of a 3/4-in. diam copper disc lo- cated l-l/2 in. from the top of the test section at approxi- mately the same axial station as the model. The theoretical heat rates were calculated with the Fay-Riddell theory (Ref. k) assuming a Lewis number of 1.0 and using thermodynamic proper- ties of nitrogen from G-ilmore (Ref. 5)> which include correc- tions for the van der Waals1 effect.
Results obtained with these two arc chambers are summarized in Fig. 3· All measurements exhibited variations from run to run. The results shown represent the range of measurements from many repeated runs. Large reductions in electrode weight losses resulted from changing to a coaxial configuration, even though the losses for the l6-C configuration include the liner losses, whereas those for the l6-A configuration do not.
Similarly, large reductions in the amount of contamination collected in the test section by the particle collector re- sulted from the change to coaxial electrodes. Additional re- duction of test section contamination resulted from the instal- lation of the baffle plate.
The most significant measurements made were the stagnation point heat rates because these were most sensitive to particle contamination (Ref. 2 ) . Errors in these measurements which ranged from 60 to ΐ6θ$> with the opposed electrode configuration
475
HYPERSONIC FLOW RESEARCH
were reduced to 2Cffo or less with the best coaxial configura- tion.
ΤUNKEL HOTSHOT 2
Except for size and energy storage system this tunnel (Fig.
k) is similar to Hotshot 1. Hotshot 2 has a 50-in. diam test section and is driven by electrical energy stored in an in- ductance coil and then transferred to the arc chamber. A fuse in the arc chamber carries the current just long enough to al- low the transfer switch to open completely (10 m s ) ; then it opens as a result of ohmic heating and magnetic force. When the fuse opens, the voltage across the main electrodes rises to a value sufficient to maintain an arc until the coil energy is dissipated or diverted. To minimize contamination of gas with arc chamber materials, it is desirable to reduce the arc-
ing time. Arc duration is normally about k-0 m s . Recently a shorting switch was installed in parallel with the electrodes to divert the current from the electrodes into the shorting circuit; the energy remaining in the coil at this time is dis- sipated through ohmic heating of the buswork, coil and genera- tor. With this switch the arc duration is reduced to 6 to 9 m s . Steady flow in the test section is usually established about 20 ms after the diaphragm bursts, and approximately 30 ms of useful run time is available prior to flow breakdown.
A more detailed description of Hotshot 2 and its mode of oper- ation is included in Ref. 2.
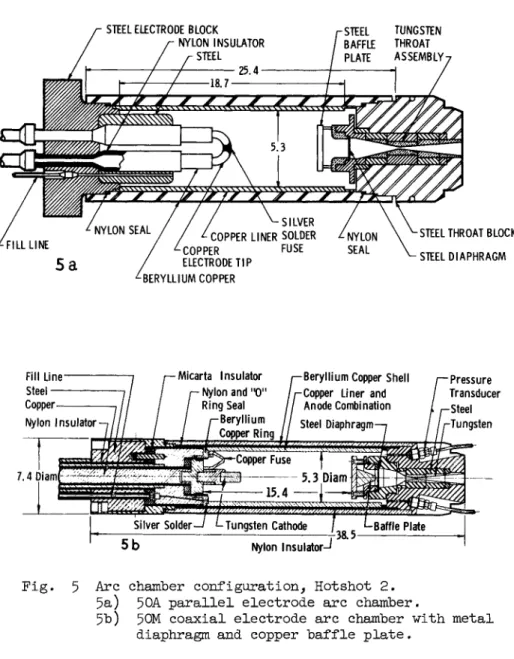
The Hotshot 2 arc chamber consists of a cartridge which is loaded into the breech of an 8-in. naval gun (Fig. h). The initial and current cartridges are shown in Fig. 5 · The 50A chamber (Fig. 5 a ) had parallel electrodes with copper tips and was equipped with a dump valve which could be opened to quickly exhaust the gas remaining in the arc chamber after flow breakdown. The fuse consisted of a mass of silver-solder connecting the main electrodes; this fuse produced substantial contamination (Ref. 2 ) . As in Hotshot 1 the significant im- provements consisted of changing to coaxial electrodes (Fig.
5 b ) , with the entire liner acting as one electrode, and using polished copper liners and a baffle plate. Other significant modifications consisted of replacing the silver-solder fuse with a copper magnetic fuse and of adding a shorting switch described earlier. A dump valve was not used with this arc chamber. An intermediate arc chamber configuration 50D, which was a significant improvement over the 50A configuration, is described in Ref. 2. This chamber was similar to the 50A chamber except that the copper electrode tips were replaced with tungsten and the silver-solder fuse was replaced with a copper magnetic fuse. Each of these three configurations had
476
a nominal volume of 350 cu in., and each was equipped with a circular baffle plate.
As in Hotshot 1 , electrode weight losses, particle collector weight gain, and ratio of measured to theoretical stagnation heat rates were the most effective monitors of progress. In Hotshot 2 the particle collector was a 1 by 3-in. aluminum
slide centered 5 in. from the top of the test section and lo- cated axially at approximately the model station. The theo- retical heat rates were calculated as described for Hotshot 1 .
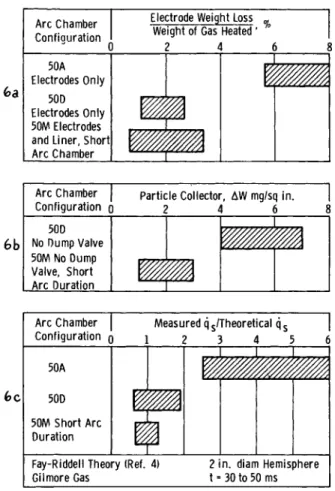
The range of measurements from many repeated runs is shown in Fig. 6. Conversion from copper to tungsten electrode tips and elimination of the silver-solder fuse, 50A to 50D, resulted in a large decrease in electrode weight losses. Changing to coaxial electrodes with short are duration (5OM) resulted in further reduction of arc chamber weight losses. This is not evident from Fig. 6a because the results for the 50M configu- ration include losses from electrodes and liner, whereas those for the 50A and 50D configurations show losses from electrodes only. However, Fig. 6b clearly shows the reduction in contami- nation in the test section with the 50M chamber.
The improvement in the measured heat transfer rates as a re- sult of a decrease in the contamination is shown in Fig. 6c.
Errors as great as 6θΟ$ encountered with the 5OA chamber have been reduced to approximately +30$ with the 50M chamber with short arc duration.
During these development tests the drag of a slender delta wing model with a cone-cylinder fuselage was measured in Hot- shot 1 with the l6-C chamber and in Hotshot 2 , with the 50M chamber over a range of Mach and Reynolds numbers. These were compared to similar measurements from the Boeing 44-in. Hot- shot tunnel and the 24-in. Shock Tunnel of the Cornell Aero- nautical Laboratory. The deviation from a mean curve faired through all of these measurements was only + 2 0 $ .
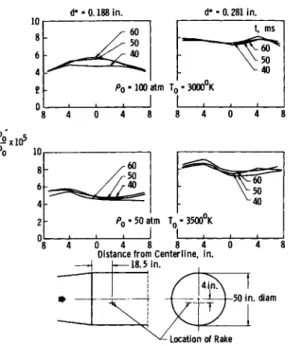
Representative pitot pressure distributions across the test section core obtained with the 50M arc chamber are shown in Fig. 7 · Within the central core deviations from a mean pitot pressure were approximately +10$ during the useful run time.
Effective area ratios determined from the pitot pressure meas- urements are shown in Fig. 8 along with values for the 50A and 50D arc chambers. It appears that no significant change in effective area ratio resulted from changes in the arc chamber configuration. Details of development of the 50M arc chamber, summarized in the foregoing, are given in Ref. 3·
477
HYPERSONIC FLOW RESEARCH
VISCOUS-INVISCID INTERACTION RESEARCH
The phenomna of interactions between inviscid and viscous flow fields at hypersonic speeds have been known to exist for a long time. However, theoretical approximate solutions have been obtained only in certain simple cases in which either the viscous or the inviscid flow field predominates.
The complexity of the combined problem demands recourse to both theory and experiment. During the past year, it has been the subject of a continuing theoretical and experimental re- search in the VKF at the Arnold Center. This effort has been directed to provide basic aerodynamic data on simple shapes such as flat plates, wedges and cones for detailed analysis.
Preliminary experimental results are presented herein and are compared to simplified theoretical models.
THEORETICAL CONSIDERATIONS
Theoretical considerations of viscous interaction effects have frequently appeared in the literature. Unfortunately, general solutions have been found for only highly simplified theoretical models. These solutions may be initially divided into two classes, the so-called weak and strong interaction solutions. Stated simply, the weak interaction solution is one in which the self-induced pressure gradient is assumed not to affect the boundary layer growth; in the strong interaction solution, account is taken of the effect on the boundary layer growth of the mutual interaction between the boundary layer and the boundary layer induced pressure. Lees and Probstein (Ref. 6) were the first to show that the parameter
y = M3/ c" / v / R ^ i1)
where
C = μνΤ / μ Τν (2)
basically determines the region in which viscous interaction effects are important.
As a first approximation to the drag of slender bodies, it is assumed that: viscous drag of planar bodies can be esti- mated from flat plate viscous interaction theory with consid- eration of local average flow conditions, and viscous drag of slender cones can be estimated from flat plate theory with consideration of local average flow conditions and application of Mangier1s transformation (Ref. 7 ) .
4 7 8
Representations of the flow fields on sharp and blunt flat plates are shown in Fig. 9· Two major characteristics of these hypersonic flow patterns are immediately evident, that is:
large boundary layer thickness relative to the shock compres- sion region thickness; and nonlinear or curved bow shock waves.
The large relative boundary layer thickness on the sharp plate produces the flow distortion evident in the curved shock wave.
The approximation of a linear weak shock wave (Fig. 9) (the Mach number at boundary layer edge is assumed equal to the free stream Mach number) has been the subject of several ana- lytical studies (Refs. 6, 8, 9, 10 and 11).
The approximation of a normal shock wave ahead of blunt bod- ies in hypersonic flow (Fig. 9) to determine local conditions near the model surface has been frequently used. This approxi- mation will be reasonable so long as the mass flow through the boundary layer at a given chordwise station is no larger than the mass flow through the near-normal section of the actual bow shock wave. When used here, the local conditions at the boundary layer edge were assumed to correspond to normal shock
compression followed by expansion to free stream pressure.
The sharp and blunt approximations that have been outlined were used with flat plate interaction theory, following Ber- tram and others, to estimate the viscous drag rise of slender bodies. In all of the following analyses the application of either the sharp or blunt approximation consisted simply of the insertion of the appropriate local average conditions.
Delta Wing Theory
Considering the skin friction of a delta flat plate wing with delta planform under strong viscous interaction, Bertram
(Ref. 12) has shown the skin friction to be given by
It can be shown by integration of the Blasius solution for a delta wing that
1/2 (3)
where
a = f < TW/ T0, v) 0 0
4 _ 4 A
(5)
3 ° F " 3
h79
HYPERSONIC FLOW RESEARCH
where Cp is the classical or Blasius-type skin friction co- efficient. Values of a have been obtained by Bertram (Ref.
12) from an integration of the results of Li and Nagamatsu (Réf. ll). Assuming that A = C = 1, both highly simplifying assumptions, the skin friction coefficient may be written as
CF tA - H ( Ä l / 2 f J L Y - (6) )
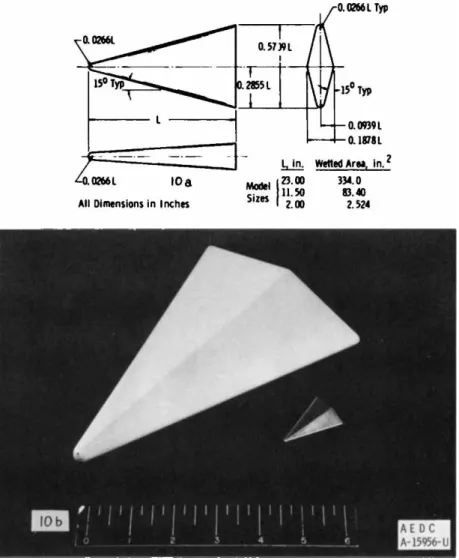
For application to the present delta wing model (see Fig. I O ) , the skin friction coefficient, Mach number and Reynolds number are based on local average conditions. For application to the case where Μ ι ^ MM, the following expression is obtained for a linear viscosity relationship with temperature and M ^ » 1
c „ . £ ( t f / ^ Y ^ (7)
The induced pressure on a sharp flat plate from strong vis- cous interaction theory is given by
P / P o c ^ K y ^ (8)
where
K = G ( TW/ T0, I / ) (9)
Theoretical values of Κ are given by Li and Nagamatsu (Ref.
ll) for a wide range of wall temperatures and y values of 1.4 and I.67. Other values of Κ have been estimated in the liter- ature (Refs. 13 and 1 4 ) ; however, these estimates include only the induced pressure in the cold wall case, whereas Ref. 1 1 considered pressure and skin friction. Therefore, for con- sistency between the induced pressure drag and the induced friction drag, the results of the calculations of Li and Nag- amatsu are used for both cases.
The expression given here for flat plate induced pressures can be applied to a thin sharp wedge if local inviscid flow conditions are substituted for free stream conditions, that is
p/pt=K*i ) (10
Consider now the local axial-force or drag coefficient caused by induced pressure on a thin wedge
4 6 0
cA , p
q t a n 6y
~ h • - Γ
>J ο
(11)
where
( c
p
)- WÏÏÏ?
2 K / M
(12)
Substituting and integrating, one obtains
where R ec is the Reynolds number based on the wedge chord.
(13)
This expression for the induced pressure drag on a thin wedge may now be used to estimate the induced pressure drag on a sharp delta wing with a thin wedge chordwise cross section.
Consider the following model
Thus
I
F
B/2A , P
= V - B / 2
Integrating, one obtains
h dy 4 q t
h dy (1*0
(15)
Converting the given drag coefficient to wetted area and free stream conditions, using a linear viscosity relationship with temperature and assuming M ^ » 1 obtains
481
HYPERSONIC FLOW RESEARCH
ο____,ϋΥ
8 Κ £b /I i 2/ - )
(16)The total drag of the delta wing will be
C-q = wave drag + induced pressure drag + induced friction drag
or
CD = CD , o +CD , p + CF , A (17)
Therefore
* t < « )
, / 2- | ls=l (is)
The analysis given indicates that the induced viscous drag of a thin sharp delta wing will be primarily a function of M/ ^ R e ^ in hypersonic flow.
Cone Drag Theory
The drag of a slender cone may be approached in much the same manner as the delta wing analysis with the application of Mangier!s transformation (Ref. 7)· From Mangier 1 s transfor- mation, the classical skin friction coefficient on a cone is
ëf ) m= / T cf (19)
It is assumed that the flat plate relationship for induced friction holds on a cone if normalized by the classical cone value
cf , c / % m = < V1 /2 (2°)
Therefore
Cr , c
~ Γ
<cf f C> *d* =4 Γ
(a*
)1/2 XdX (21)482
Integrating, one obtains
CF, c= 4(^ F , m ) ( ^ )l/ 2 (22)
5 where
cF m = ^ 4 - (23)
Converting now to free stream conditions, base reference area, and assuming as before that A = C = 1 and M » 1 brings
cA,F.1 3s / T - ( - L j g=j_ < * ,
The induced pressure drag on a slender cone is
CA
PAL.
/ % „ > r d r ( 25) The local induced pressure coefficient is assumed here to begiven by flat plate viscous interaction theory as modified by the different theoretical rates of boundary layer growth on a cone and plate, or since δ* on a plate is \fë greater than on a cone, the following induced pressure coefficient is assumed
( c ) (26)
Substituting and integrating
or based on free stream conditions
4 8 3
H Y P E R S O N I C F L O W R E S E A R C H
or
Again, as in the delta wing case, the simple theory indi- cates the induced viscous drag will be a function of M / / R eL. Delta Wing Drag Data
Slender delta wing models (Fig. 10) were tested in four of the VKF wind tunnels over a Mach number range from 8 to 22, a Reynolds number range from 500 to 4 χ 10^, and from the cold- wall case. These data are all summarized in Fig. 1 1 as a function of M / / R eL.
VKF Tunnel Β (Ref. 15 a continuous M = 8 wind tunnel, was used to obtain the hot-wall data shown in Fig. 1 1 . This tun- nel was operated, with air as a test medium, over a stagnation pressure range from 50 to 500 psia with a stagnation tempera- ture of I35O deg Rankine. The large model drag data were ob- tained with conventional internal strain-gage balances, where- as the small model data were obtained using a specially de- veloped string-mounted balance which utilized a differential transformer as a sensing element.
The VKF Low-Density tunnel, described by Potter et al. (Ref.
l 6 ) , was used to obtain the relatively cold-wall, delta wing drag data presented in Fig. 1 1 . This tunnel is an arc heated, continuously operating facility with a nominal Mach number of 9. Stagnation pressure and temperature were approximately 1 atm and 3000 Κ for these drag tests . Nitrogen was used as a test medium during these tests. Although this tunnel is cap- able of long duration runs, the low rate of convective heat transfer combined with large radiant heat losses established a relatively cold equilibrium wall temperature. Optical pyrome- ter measurements indicated the temperature of the planar sur- faces was about 1000 Κ or a wall to stagnation temperature ratio of about 0.3·
4 8 4
The total drag of the slender cone will be
The drag data from Hotshot 1 and 2 were obtained using con- ventional Hotshot force measuring techniques as described in Ref. 1 7 . Nitrogen was used as a test medium, and stagnation pressures and temperatures ranged from 10,000 to 20,000 psia
and 25ΟΟ to k-OOO K, respectively. Variations in the parameter
M/ ^Re-L were obtained largely by variations in Re-^ with rela- tively smaller changes in Mach number. The range of Mach num- ber and length Reynolds number was from 18 to 22 and 250,000 to 750,000, respectively.
Calculations from the simple theories previously outlined are shown for comparison with the delta wing drag data in Fig. 1 1 . It is noted that the simple theory overestimates both the hot- and cold-wall cases. Application of this simple theory to the low density data shown will also give an overestimate of the drag. The simple theory is considered pertinent here only to suggest the parameteric relationships and to illustrate the expected data trends.
These data, covering a range of parameters (M^, R eL and TW/ T0) not heretofore available, clearly indicate that very large zero-lift viscous drag rises can be expected at hyper- sonic speeds.
Slender Blunted Cones
Blunt slender cones (9-deg half angle) were selected as some of the basic shapes in the study of viscous interactions (Fig.
1 2 ) . As an input to higher order theoretical studies of vis- cous interactions on such shapes, detail measurements of pres- sure distributions and shock shapes have been made in the Hotshot tunnels. These tests were made in nitrogen, as were all the Hotshot tests reported herein.
Pressure Distributions
Pressure distributions at M «,« l8 on flat nose and hemi- spherically blunted cones are presented in Fig. 13 in terms of parameters suggested by Cheng (Ref. l8) and Chernyi (Ref. 1 9 ) . Also shown are the theoretical results by Cheng and Chernyi and a real gas characteristic solution from Ridyard (Ref. 20).
The most salient feature of these data is the overexpansion of pressure followed by an overshoot (with respect to the sharp cone value). This is believed to be the first experi- mental observation of such a marked overshoot in pressure.
The real-gas (air) characteristic solution (Ref. 20) and the experimental pressure distribution on the hemispherically blunted cone agree quite well, in spite of the different gas
4 8 5
HYPERSONIC FLOW RESEARCH
properties involved. The pressure distribution data were ob- tained in nitrogen at essentially perfect gas conditions (Ref.
2 1 ) .
These pressure distributions were checked over a Mach number range from l 6 to 1 9 with a corresponding Reynolds number (Re^) from 1 5 0 , 0 0 0 to 6 2 0 , 0 0 0 . All of these measurements were within
+10$ of the typical distributions presented in Fig. 1 3. An
integration of these pressure distributions gave pressure drag values which are assumed to be essentially inviscid values.
The integrated pressure drag values are presented and compared to total drag measurements later.
Shock Shapes
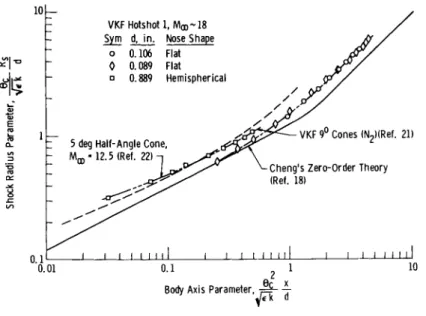
Shock shapes from slender blunted 9-&eg cones, as determined from schlieren photographs and normalized by the nose diam, are presented in Fig. 1 5 for a test Mach number of approxi- mately 1 8 . A typical schlieren photograph is shown in Fig.
ik. Schlieren photographs were obtained in VKF Tunnel Hotshot 1 over a range of Mach numbers from l 6 through 1 9 and over a length Reynolds number range from 1 5 0 , 0 0 0 to 6 2 0 , 0 0 0 . No discernible difference in shock shape could be detected as a function of Mach number and/or Reynolds number for this small range of variables; hence the data of Fig. 1 5 are representa- tive of this range of conditions. Also shown in Fig. 1 5 are experimental shock shape data from a 5-äeg blunted (flat hose) cone from Ref. 22 at = 1 2 . 5
An interesting phenomenon may be noted in Fig. 1 5 from the comparison of shock shapes from the hemispherically blunted cone and the flat nosed cone. The shock shapes for these cones are similar, as least in the narrow region of overlapping data, in spite of the difference in nose shape. These results are also presented in Fig. l 6 in terms of parameters suggested by Cheng (Ref. l 8 ). Also shown are the 5-deg cone results at M,» = 1 2 . 5 (Ref. 22) and the zero-order theory of Cheng.
Cheng*s theory predicts a slightly different shock shape for the hemispherically and flat nosed cones; however, this was not the case, and hence the data from the two cones fail to collapse together when compared in terms of Cheng's parameters.
The difference in shock radii between theory and experiment is about 2 0 $ , and the experimental and theoretical slopes show reasonable agreement. The present data from the flat nosed 9-deg cone are in better agreement with Cheng's theory than the 5-deg cone data from Ref. 2 2 . A small change in shock wave curvature may be noted in the present experimental data.
Cheng's theory predicts a change in shock curvature (that is, abrupt slope change in Fig. l 6 ) much more abrupt than the
4 8 6
experiment. It is to be expected that viscous effects would smooth out such a transition.
A real-gas (air) characteristic solution (Ref. 2 5 ) was available from Ridyard (Ref. 2 0 ) on the spherically blunted cone. A comparison of the shock shapes from the characteris- tic solution and from experiment are shown in Fig. 1 7. It is reasonable that the inviscid characteristic solution would predict a thinner shock layer than an actual case; however, the magnitude of viscous effects on shock shapes is ill de- fined. It should be noted that these shock shape data were obtained in nitrogen at essentially perfect gas conditions, whereas the characteristic solution was a real-gas solution.
The magnitude of real-gas effects in such a case has not been accurately assessed.
Viscous and Inviscid Cone Drag Data
Drag data for a slightly blunted flat nosed cone and for a hemispherically blunted cone are presented in Figs. l 8 and 1 9 , respectively. The VKF data were obtained from Tunnel Hotshot 1 , Hotshot 2 , and the Low Density Hypervelocity Tunnel ( l 6 ) . The VKF low density data, as well as the Hotshot data, were
obtained using nitrogen as a working gas.
During the low density tests a technique of injecting the model and obtaining a drag measurement in about one minute was employed. This gave a slightly colder wall condition than for the previously described delta wing data. The wall tem- perature was estimated to be not more than 600 Κ for this type of test, or a wall to stagnation temperature ratio of approxi- mately 0 . 2 was obtained.
Also shown in Fig. l 8 are hot-wall data from Maslach and Talbot (Ref. 2 3 ) obtained from the Berkeley low density tunnel at M ^ 5 on a sharp 9-deg cone. It should be noted here that the slightly blunt flat nosed cone used in the VFK tests was essentially sharp from an inviscid drag standpoint. The ef- fect of this small relative bluntness on the viscous drag characteristics is unknown; however, it seems unlikely that the effect is large.
Theoretical estimates from the simple cone theories previ- ously outlined are also compared with experiment in Figs. 1 8 and 1 9 . The sharp cone theory for the adiabatic wall temper- ature case and relatively low Mach number (M^ ~ 5 ) gives a considerably smaller drag than Maslach and Talbot1 s data.
Similarly, the sharp cone theory is noted in Fig. l 8 to be low for the cold-wall, high Mach number ( MM^ 20) case for the
487
HYPERSONIC FLOW RESEARCH
lower values of the viscous parameter (M/ ^RejJ ; however, in- creasing agreement is noted with increasing viscous inter- action. Drag data from the spherically blunted cone, which has an order of magnitude greater relative bluntness, are compared with the sharp and blunt cone theories in Fig. 19·
The sharp and blunt cone theories bracket the experimental data.
To illustrate the magnitude of the viscous drag effects, scales denoting the ratio of inviscid plus viscous drag to in- viscid drag only have been included in Figs. 18 and 19· The drag data from the VKF low density tunnel show drag rises over 1500$ above the inviscid values. These drag data were obtained at viscous interaction levels not heretofore available to the author's knowledge. Some proposed criteria for the indication of slip flow would indicate that these low density data could be well within the slip-flow regime; however, whether or not this is so in this cold-wall case remains to be determined.
It is interesting to compare the drag data from the rela- tively sharp flat nosed cone and the blunt spherically nosed cone. Such a comparison is shown in Fig. 20. Under conditions of large viscous interactions, the drag coefficients of these cones are idential as a function of M/ ^R^L, although the in- viscid drag levels differ by a factor of 3·
It should be noted that the drag data from Hotshot 2 was obtained primarily by variations in Reynolds number with rela- tively small variations in Mach number. A significant differ- ence in both Mach number and Reynolds number existed between the VKF Hotshot data and the VKF low density data.
CONCLUDING REMARKS
Recent development work in hotshot wind tunnels has markedly reduced flow contamination, the major problem area of high pressure, arc driven facilities. This reduction was achieved with the aid of coaxial electrode arrangements in the arc chambers of both the VKF 16-in. Hotshot 1 and the VKF 50-in.
Hotshot 2. In addition, the characteristically long arc dis- charge time in the inductively driven Hotshot 2 was reduced
"by the use of an arc termination switch, and a magnetic fuse was developed for arc initiation.
Stagnation point heat transfer levels, a relative measure of flow contamination, have been reduced to an average level consistent with Fay-Riddell theory. The overall consistency of such measurements is, however, unsatisfactory and remains to be improved.
488
Slender body drag, also a measurement expected to reveal ef- fects of significant flow contamination, exhibits trends con- sistent with theoretical estimates and in proper relative magnitude to measurements from conventional hypersonic wind tunnels. Accurate quantitative theoretical drag estimates under the hypersonic, cold-wall conditions with large viscous effects remain to be derived.
It is concluded that the VKF Hotshot wind tunnels have taken a major step toward providing the type of aerodynamic of hyper- sonic flight. As in all techniques of simulation, further refinements and extensions are required.
Cold-wall, hypersonic drag data from delta wing models re- veal a significant reduction of viscous drag apparently caused by wall temperature; however, in spite of this significant viscous drag reduction, very high viscous induced drag levels were obtained.
Shock shapes over slender blunt cones are shown to have slopes as predicted from theory; however, theoretical differ- ences in shock shapes because of different nose geometries were not found. Flat hosed and spherically blunted slender cones were shown to have the same nondimensional shock shapes within the region of overlapping data.
Pressure distribution data from slender blunted cones at hy- personic speeds reveal an overexpansion and a marked overshoot in pressure along the conical surface. This overexpansion and overshoot of pressure had been predicted in the literature.
This is believed to be the first experimental observation of such a marked overshoot.
Drag data from slender blunted cones with hypersonic cold- wall conditions show strong viscous interaction effects. Even with this relatively cold-wall condition, drag levels over 15 times the inviscid drag level were measured. It was found that a slightly blunted cone and a relatively blunt cone have essentially identical drag levels under conditions of high viscous interactions.
Flat-plate-type viscous interaction theories are shown to be quantitatively inadequate to predict the drag of delta wings and cones for conditions of high viscous drag at hypersonic speeds. More detailed analysis of this problem is urgently needed.
489
HYPERSONIC FLOW RESEARCH
APPENDIX: PRECISION OF RESULTS
The accuracy of results from any high pressure, high temper- ature hypersonic test facility is, of course, a function not only of the accuracy of direct measurements but also of the accuracy of the real gas properties used. Estimates of the properties of real gases at high temperatures are continually being refined. For example, Gilmore (Ref. 5) has recently considered the van der Waals1 effect (intermolecular forces) on nitrogen. These refined estimates of nitrogen properties gave changes in stagnation enthalpy, Mach number and Reynolds number of -I3, +4, and +40$, respectively, at typical Hotshot test conditions.
The basic method of determining the thermodynamic state of the gas as a function of time in Hotshot tunnels is as out- lined in Ref. 1. Briefly, the average thermodynamic state of the reservoir is determined by the two state variables: densi- ty p0 and pressure pQ. The density is determined as a func- tion of time by knowing the initial density and accounting for the density decay by estimating the mass flow through the sonic throat. The pressure is measured directly as a function of time and thus automatically accounts for energy transfer to the chamber. In principle, an accurate estimate of the average thermodynamic state in the arc chamber can be made if real gas properties are known. It should be emphasized that this method gives the average thermodynamic state, and it is assumed in application that complete mixing and equilibrium have occurred.
Certainly the pressure is expected to be essentially constant within the chamber; however, density and temperature variations are possible. The effect of this assumption of uniformity is unknown.
Test-section flow properties are estimated by determining an isentropic expansion from the reservoir conditions which matches the measured pitot pressure pQ in the test section.
Both the previously mentioned calculations of reservoir condi- tions and the isentropic expansion calculations have been pro- grammed on an IBM 7070 Computer. Such programming was made possible by use of empirical equations for the real gas prop- erties. The computations are described in detail by Grabau, Humphrey and Little in Ref. 24.
Although the precision of results from any hypervelocity test facility involves considerably more than just the un-
certainty of the direct measurements, these direct measure- ments must form the basis for estimates of flow properties.
In general, the uncertainties of bench calibrations of the pressure and drag transducers were approximately +1$, whereas
490
the repeatability of such measurements, as indicated by re- peated tunnel runs, was approximately +10$. The estimated uncertainty of bench calibrations of the heat gages was +10$, whereas the repeatability of stagnation heat rates was approxi- mately +30$.
All of the drag coefficients and pressure ratios presented herein represent an average of the timewise variation obtained.
Such averages were obtained from the quasi-steady portion of the tunnel run, and the range of such timewise variations was typically +5$.
ACKNOWLEDGMENT
The authors wish to acknowledge contributions to this re- search and development work by many of their colleagues of the von Karman Gas Dynamics Facility, Arnold Center. Among the many who assisted in this effort, the following specific con- tributions are noted: J. Leith Potter and George Arney, Re- search Branch, for their cooperation in obtaining the low density drag data; H. T. Wood Jr. and Jim Myers, Hypersonic Branch, for their cooperation in obtaining the Mach 8 drag data; B. J. Griffith, C H. Lewis and H. E. Deskins, Hyper- velocity Branch, for conducting the Hotshot tests described herein.
The authors are grateful to H · Ridyard and the General Elec- tric Company for making available the real-gas characteristic solutions presented herein.
NOMENCLATURE
A = constant in Blasius-type solution for skin riction A/A* = nozzle area ratio
a = skin friction constant in viscous interaction theory (see Eq. k)
Β = delta wing span
C = linear viscosity coefficient (see Eq. 2 ) C^ = total drag coefficient, base area
Cft = average friction drag coefficient, base area
A,F & '
C ±= inviscid pressure drag coefficient, base area
Ά , Ο
4 9 1
HYPERSONIC FLOW RESEARCH
492
induced pressure drag coefficient, base area total drag coefficient, wetted area
inviscid pressure drag coefficient, wetted area induced pressure drag coefficient, wetted area average skin friction coefficient, wetted area average skin friction coefficient of cone, wetted area
average skin friction coefficient of delta wing, wetted area
average Blasius-type skin friction coefficient, wetted area
average Blasius-type skin friction coefficient trans- formed by Mangier1s transformation, wetted area pressure coefficient
local delta wing chord
induced pressure local drag coefficient (unit width wedge), base area
local skin friction coefficient, wetted area
local Blasius-type skin friction coefficient, wetted area
local Blasius-type skin friction coefficient trans- formed by Mangier1s transformation, wetted area model base diam
nose diam
nozzle throat diam, in.
thickness of wedge base
induced pressure constant in viscous-interaction theory (see Eq. 9)
nose drag coefficient, frontal area
L = overall model length M = Mach number
Ρ pressure
q. = dynamic pressure
i heat transfer rate, Btu/ft sec R
s
= radial shock wave ordinate Re Reynolds number
r local body radius
Sb = base area S
w
wetted surface area T temperature
t time, sec
x longitudinal distance from leading edge y lateral distance
y ratio of specific heats
δ* = boundary layer displacement thickness
€ ( y- l) / ( y+ l) U = 1/6 for y = ι Λ )
Θ
c
= cone half angle
Θ
w
= wedge half angle
ß = viscosity
Ρ = density (tunnel operating density given in relative atmospheres; reference density = 0.002^2 slug/ft3) y = a viscous-interaction parameter (see Eq. l)
Subscripts (unless otherwise noted) l> = local inviscid flow conditions
495
H Y P E R S O N I C F L O W R E S E A R C H
L = referred to overall model length ο = reservoir stagnation conditions s = stagnation region of model w = wall conditions
c» = free stream flow conditions
Superscripts (unless otherwise noted)
= stagnation condition behind normal shock -* = sonic condition
Note: Initial conditions on the arc chamber are designated as follows:
Gas/To°K/ atm/po psi, eg. Ν2/ 3 0 0 θ/ ΐ Ο θ/ ΐ 6 , 0 0 0
REFERENCES
1 Perry, R. W. and MacDermott, W. N., "Development of the Spark-Heated Hypervelocity Tunnel--Hotshot," AEDC-TR-58-6, June 1 9 5 8 .
2 Lukasiewicz, J., Jackson, R., van der Bliek, J. Α., Harris, W. G. and Miller, R. M., "Development of Capacitance and Inductance-Driven Hotshot Tunnels," AEDC-TN-60-222, Jan.
1 9 6 1 .
3 van der Bliek, J. Α., Deskins, Η. Ε. and Walker, R. R.
Ill, "Further Development of an Inductance-Driven Hotshot Tun- nel," AEDC-TN-6I-8O, July 1 9 6 1 .
k Fay, J. A. and Riddell, F. R., "Theory of Stagnation Point, Heat Transfer in Dissociated Air," J. Aeron. Sei., Feb.
1 9 5 8 , pp. 7 3 - 8 5 .
5 Gilmore, F. R., private communication (to be published as a RAND Corp. Report).
6 Lees, L. and Probstein, R. F., "Hypersonic Viscous Flow Over a Flat Plate," Princeton University Aero, Engr. Lab. Rep.
no. 1 9 5 , ATI Ikô 5 6 5 , April 1 9 5 2 .
h9k
7 Mangier, W., "Compressible Boundary Layers on Bodies of Revolution-Interrogation Report," ATI 28063, June 1946.
8 Bertram, M. H., "An Approximate Method for Determining the Displacement Effects and Viscous Drag of Laminar Boundary Layers in Two-Dimensional Hypersonic Flow," NACA-TN-2773, Sept. 1952.
9 Lees, L., "Hypersonic Flow," Institute of Aeronautical Sciences, Fifth Aeronautical Conf., Los Angeles, Calif., 1955, pp. 241-276.
10 Li, T.-Y. and Nagamatsu, H. T., "Shock-Wave Effects on the Laminar Skin Friction of an Insulated Flat Plate at Hyper- sonic Speeds," J. Aeron. Sei., vol. 20, no. 5, May 1953, pp 345-355.
1 1 Li, T.-Y. and Nagamatsu, H. T., "Hypersonic Viscous Flow on Non-Insulated Flat Plate," Proc. Fourth Midwestern Conf. on Fluid Mechanics, Purdue Univ., Sept. 8-9, 1955, Research Ser-
ies no. 128, Purdue Engineering Experiment Station, pp. 273- 287.
12 Bertram, M. H., "Boundary Layer Displacement Effects in Air at Mach Numbers of 6.8 and 9 . 6 , " NASA-TR-R-22, NACA TN 4133, 1959.
13 Oguchi, H.,"The Sharp Leading Edge Problem in Hypersonic Flow," Brown University, Div. Engineering, Rep. ARL-TN-60-133, Aug. i960.
14 Bertram, M. H. and Blackstock, Τ. Α., "Some Simple Solu- tions to the Problem of Predicting Boundary-Layer Self-Induced Pressures," NASA-TN-D-798, April 1961.
15 Sivells, J. C , "Operational Experience with a 50-Inch- Diameter, Mach 8 Tunnel," presented at Joint Meeting of the STA-AGARD Wind Tunnel and Model Testing Panel, Marseilles, France, Sept. 1959·
16 Potter, J. L., Kinslow, M., Arney, G. D. and Bailey, A. B., "Initial Results from a Low-Density Hypervelocity Wind Tunnel," published elsewhere in this volume.
17 Earheart, W. T., Jr. and Bynum, D. S., "Hypervelocity Arc-Tunnel Instrumentation," AEDC-TN-60-227, Dec. i960.
495
HYPERSONIC FLOW RESEARCH
1 8 Cheng, H. K., "Hypersonic Flow with Combined Leading- Edge Bluntness and Boundary-Layer Displacement Effect," Cornell Aero. Lab. Rep. no. AF-1285-A-4, Aug. i 9 6 0 .
1 9 Chernyi, G. G., "Flow around a Thin Blunt-Nosed Cone at High Supersonic Speeds," (Original Russian), Proc. Acad. Sei., USSR, Applied (English Translation), vol. ± 1 5 , May 1 9 5 8 , pp.
6 8 I - 6 8 3 . (Ad 2 0 1 3 1 0 . )
20 General Electric Company, private communication from H.
Ridyard, Nov. i 9 6 0 - Feb. I 9 6 I .
2 1 Lewis, C H . , Pressure Distribution and Shock Shapes over Blunted Slender Cones between M = l 6 and 1 9 , " AEDC-TN- 6 I- 8 I , Aug. 1 9 6 I .
22 Hertzberg, A. and Wittliff, C. E., "Studying Hypersonic Flight in the Shock Tunnel," IAS Paper no. 6 Ο- 6 7 , presented June 28-July 1 , i 9 6 0 .
23 Maslach, G. J. and Talbot, L., "Low Density Aerodynamic Characteristics of a Cone at Angle of Attack," Univ. of Calif., Inst, of Engr. Research, Technical Rep. HE-I5O-I72, Oct. 3 0 , 1 9 5 9 .
24 Grabau, M., Humphrey, R. L. and Little, W. J., "Deter- mination of Test-Section, After-Shock, and Stagnation Condi- tions in Hotshot Tunnels Using Real Nitrogen at Temperatures from 3OOO to 4000°K," AEDC-TN-6I-82, July 1 9 6 1 .
25 Gravalos, F. G., Edelfelt, I. H. and Emmons, H. W., "The Supersonic Flow About a Blunt Body of Revolution for Gases in Chemical Equilibrium," Missile and Space Vehicle Dept., General Electric Co., GE-R58-SD-245, June 1 9 5 8 .
496
Fig. 1 Tunnel Hotshot 1, a l6-in. diam hypervelocity wind tunnel.
la) Assembly,
lb) Arc chamber,.nozzle and test section»
497
HYPERSONIC FLOW RESEARCH
iw — t. f.J m .
L -6.25 in.
Volume - 25 in. 3
NOTE: ELECTRODES ARE BERYLLIUM COPPER CHAMBER DIMENSIONS (NOM) WITH TUNGSTEN INSERT TIPS ID 26 IN.
2 D LENGTH 6.5 IN.
VOLUME 35 IN.9
PRESSURE RATING 30,000PSI
Fig. 2 Arc chamber configurations, Hotshot 1.
2 a ) Arc chamber and throad assembly opposed elec- trodes, l6-A.
2 b ) Arc chamber and throad assembly coaxial elec- trodes, l6- C .
498
Arc Chamber 1 ^ ^ ^ ^ 1 %
Configuration J Weight of Gas^Heated ' ^ ^
16-A Electrodes Only
16-C Electrodes and Liner
mm
16-A Electrodes Only
16-C Electrodes and Liner
mm
Arc Chamber | Particle Collector, AW mg/sq in. I Configuration ρ 2 4 6
16-A with baffle
16-C without baffle
16-C with baffle
16-A 1 with baffle
16-C without baffle
16-C with baffle
16-A with baffle
16-C without baffle
16-C with baffle
Arc Chamber | Measured q s/Theoretical q Configuration q 1 2
16-A with baffle
16-C without baffle
16-C with baffle
16-A with baffle
16-C without baffle
16-C
with baffle
pi
Fay-Riddell Theory (Ref. 4) 2 in. diam Hemisphere Gil more Gas t = 15 to 25 ms Fig. 3 Comparison of Performance of Various Arc Chambers,
Hotshot I, Polished Copper Liners, M * 18, No/3000/100/16000
Comparison of performance of various arc chambers, Hotshot 1, polished copper liners, M = 18, Np3000/
100/ΐβ000. ά
499
HYPERSONIC FLOW RESEARCH
Fig. k Tunnel Hotshot 2, a 50-in. diam hypervelocity wind tunnel.
ha) Assembly.
Lib) Arc chamber, nozzle and test section.
500
Fill Line Steel
Micarta Insulator Nylon and "0"
Ring Seal Beryllium Copper Ring
-Beryllium Copper Shell -Copper Liner and
Anode Combination Steel Diaphragm
Pressure Transducer Steel Tungsten
7.4 Diamt-
Copper Fuse | 5.3Diam 15.4 J
Tungsten Cathode Nylon Insulator-'
Fig. 5 -Arc chamber configuration, Hotshot 2.
5a) 5 0 A parallel electrode arc chamber.
5b) 5 0 M coaxial electrode arc chamber with metal diaphragm and copper baffle plate.
501
HYPERSONIC FLOW RESEARCH
Arc Chamber Configuration
Electrode Weight Loss „ Weight of Gas Heated '
ι 2 4 6 ί
50A Electrodes Only
50D Electrodes Only 50M Electrodes and Liner, Short Arc Chamber
50A Electrodes Only
50D Electrodes Only 50M Electrodes and Liner, Short Arc Chamber
50A Electrodes Only
50D Electrodes Only 50M Electrodes and Liner, Short
Arc Chamber
mäm
Arc Chamber | Particle Collector, AW mg/sq in. | Configuration 0 2 4 6 8
50D No Dump Valve 50M No Dump Valve, Short Arc Duration
50D No Dump Valve 50M No Dump Valve, Short Arc Duration
50D No Dump Valve 50M No Dump Valve, Short
Arc Duration
u p
Arc Chamber | Measured q s/Theoretical q s | Configuration ο 1 2 3 4 5 6
50A
50D 50M Short Arc
Duration
1
I ι ι 50A
50D 50M Short Arc
Duration
1
50A
50D 50M Short Arc
Duration
1
Fay-Riddell Theory (Ref. 4) 2 in. diam Hemisphere Gil more Gas t = 30 to 50 ms
Fig. 6 Comparison of performance of various arc chambers, Hotshot 2, polished copper liners, M = 18 - 22, N2/3000/lOO/l6000.
6a) Electrode weight losses 6b) Test section contamination.
6c) Stagnation heat transfer rates.
502
d*-0.188 in. d*-0.281 in.
P0 - 100 atm T0 • 3000υΚ
t, ms
Pn- 50 atm TQ- 3500UK
0 4 8 8 4 0 J L
Distance from Centerline, in.
-18.5 in.
Location of Rake
Fig. 7 Pitot pressure distribution in test section Hotshot 2 (50M arc chamber, short arc duration).
9 8 7 6 5
« 4 1
2h
_Sym Conf. Pq, atm τ0.°κ
- A 50A 70-100 3000-4000 . • 50D 100 3000
Ο 50M 50 3500
- • 50M 100 3000 /
Inviscid Flow- •
/ >
/ /
/
/ y
/ S ι I I I I 1 I 1 5 6 7 8 9 10
<Α/Α·) geometric
Fig. 8 Effective area ratio obtained from p0 measurements in test section core, Hotshot 2 .
505
HYPERSONIC FLOW RESEARCH
SHARP PLATE
Linear Shock Wave
Shock Layer
Approximation
Boundary Layer Ji œ
BLUNT PLATE Highly Curved Shock Wave
Actual
Sh_ock_Layer „ V a r j a b |e
Boundary Layer *
Normal Shock -H
\0
•mApproximation
Fig. 9 Actual cases and approximations used for simple analysis.
504
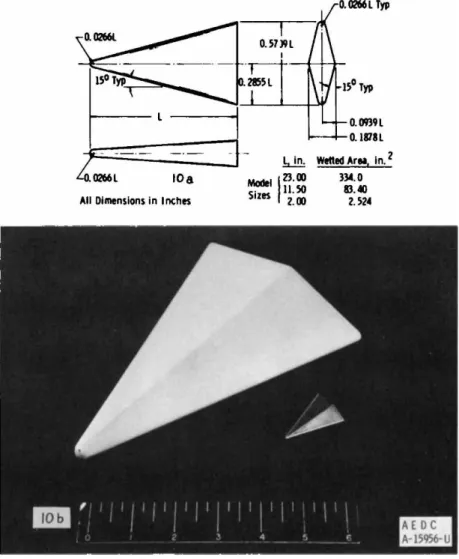
Fig. 1 0 Delta wing models.
505
HYPERSONIC FLOW RESEARCH
Ο Ο O) c
Γ J Z Û C Û D Û on on _
"θ "θ ο
π: πζ 3
m L P» R H RH rVJ ( Λ I Ι—I R—T CS]
o*» oo oo
? ? ?
Η Η( Λ Ο Ο Ο Ο Ο Ο Ο Ο Ο
? ? ? ? ? ο < • ο Ο
Ιο Ε
ο ο "
ι » »
Ο OO so J L
ο 'α
3/α
3ι I
_ _ ο
I :
8
QQ ')U9j3jjjd03 6ejrj
506
Sharp Cone
MODEL NOSE SHAPE D, in. L/D d/D ί Pressure Flat 3.025 3.029 0.03 Sharp j Force 11 2.995 3.048 0.03 ' Force II 0.984 3.270 0.03 i Pressure Hemispherical 3.025 2.326 0.31 Blunt j Force M 2.987 2.269 0.29 ' Force II 0.970 2.392 0.29
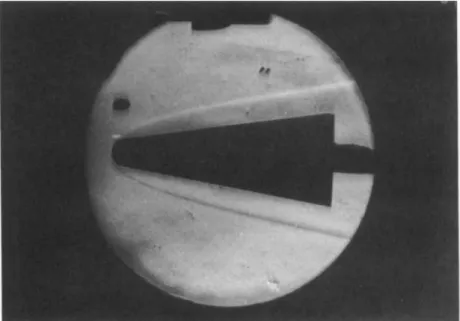
Fig. 12 9-deg half angle cone models.
5 0 7
HYPERSONIC FLOW RESEARCH
VKF Hotshot 1, Μω~ 1 8 (N2)
Sym d, in. Nose Shape Ref.
O 0.090 Flat (k-1.881 21
• 0.098 I I 0 0.106 I
Δ 0.889 Hemispherical (k»0.96) *
-Real Gas Characteristic Solution; Mœ » 15, Altitude = 85,000 ft (Ref. 20)
/ /
v/
" ''Vcheng's Zero-Order Theory (Ref. 18) -Chernyi's Theory (Ref. 19)
J I I I I I I I J I I I I I I I J I I I I I I I
0.01 0.1
Distance Parameter,
Vä d
Fig. 13 Pressure distribution on 9-^eg cones.
Fig. lh Schlieren photograph of the spherically blunted cone at M = I8.9, R eL = 156,000.
VKF Hotshot 1, Μα,-18
Non-Dimensional Distance, x/d
Fig. 15 Shock shape over slender blunted cones.
Body Axis Parameter, -βξ- 4-
Fig. 16 Shock shape over slender blunt cones in terms of Cheng's correlation parameters.
509
HYPERSONIC FLOW RESEARCH
Fig. 17 Comparison of shock shapes from real-gas characteris- tic solution and experiment.
Total Drag Measurements Sym d/D D, in. Tw/ 1 Mi 'oo
— t
Tunnel
ο 0.03 3.0 ~ 0 . 1 ~ 20 or 0.03 1.0 ~ 0 . 1 ~ 20
• 0.03 0.5 ~ 0 . 2 ~ 9
δ 'v 0 0.5 ~ 1 . 0 ~ 5 Integrated Pressure Drag
• 0.03 3.0 ~ 0 . 1
Hotshot 2 (VKF) Hotshot 2 (VKF) Low Density (VKF) Univ. of Calif
(Ref. 22)
• 18 Hotshot 1 (VKF) Fluid
N2
N2 Air
N2
ι.ομ
0.5
0.1
0.05
:Ματ5; w i . o
^Sharp Cone T h e o r y - \a
/ /
'20;Tw/Tq~0.1 Sharp Cone Theory
v, Blunt Cone Theory Λ 6
4 CA -
H 2
Ά, ο
ι ι ι ι ι ι 11 ι ι ι ι ι ι ι 11
0.01 0.1
Mœ/VReI
1.0
Fig. l 8 Zero-lift drag of flat nosed 9-deg cones,
510


![(see[ – ])foradiscussionofthestatusoftheBrinkmanequationwithinthecontextofmixturetheory).Thefactthatweareabletoobtainananalyticalsolutiontotheproblemmakesthestudyallthemoreinteresting.Despitethefactthatadvancedcomputingfacilitiesareavailabletoobtainthenum](data:image/gif;base64,R0lGODlhAQABAIAAAP///wAAACH5BAEAAAAALAAAAAABAAEAAAICRAEAOw==)