X - R A Y SCATTERING STUDIES OF SIMPLE FLUIDS
Paul W. Schmidt and Clifford W. Tompson
Department of Physics, University of Missouri, Columbia, Missouri
1. Introduction 31 2. Large Angle Scattering 33
2.1. Introduction 33 2.2. Helium 35 2.3. Neon 39 2.4. Argon 39 2.5. Xenon 77 2.6. Oxygen and Nitrogen 78
2.7. Chlorine 79 2.8. Bromine 86 2.9. Methane 88 3. Small Angle X-Ray Scattering 90
3.1. Introduction 90 3.2. Helium 97 3.3. Argon 99 3.4. Nitrogen 105 References 108
L Introduction
The positions of atoms and molecules in fluids can be studied by x-ray scattering techniques which in many ways are analogous to the x-ray diffraction methods that are the basis of most crystal structure deter- minations. In fluids, however, there is no long-range molecular or atomic order, and the molecular positions must be described by probabilities instead of by the fixed distances obtained from crystal structure analyses.
The experimental x-ray scattering data for a fluid can be used to compute a function g(r), often called the pair correlation function or the radial distribution function, which is a measure of the average probability that molecules in the fluid will be separated by a distance r. X-ray scattering is especially useful in the study of fluids because it is one of the few tech- niques by which pair correlation functions can be evaluated for real fluids.
31
I /
FIG. 1. Schematic diagram of an apparatus for measuring x-ray scattering.
Figure 1 shows a schematic diagram of a typical experimental apparatus for measuring x-ray scattering. Radiation from the x-ray tube T is formed into a beam by the slits F
1and F
2. This well-defined beam, which is assumed to consist of x rays of a single wavelength, strikes the sample S. Although most of the radiation is either absorbed in the sample or passes through it without being changed in direction, a small fraction of the radiation will be emitted in directions other than the direction of the incident beam. Slits F
3and F
4and the detector C permit measurement of the intensity of this radiation, which is called the scattered radiation, at different values of the scattering angle 20. Since the angular dependence of the scattered radiation is determined by the location of the atoms and molecules in the sample, measurement of the scattered intensity at different scattering angles can provide information about the atomic and molecular positions in a fluid.
At ordinary scattering angles (that is, at angles greater than a few degrees) the x-ray scattering is determined mainly by structures with dimensions of the order of magnitude of the x-ray wavelength, which is usually about 1 A. The x-ray scattering at angles greater than a few degrees therefore gives the pair correlation function for r values no greater than about 10 or 20 A and thus provides information about the separations between neighboring molecules.
At scattering angles less than a few degrees, the x-ray scattering is due primarily to interatomic or intermolecular distances which are considerably larger than the x-ray wavelength, and the x-ray scattered intensity in this angular region can be shown to depend primarily on values of the pair correlation function g(r) for which r is considerably greater than the distances between neighboring atoms. Thus small angle x-ray scattering is useful in determining the long-range behavior of g(r). In simple fluids, which under ordinary conditions have no ordered
7 ^
X-RAY SCATTERING STUDIES OF SIMPLE FLUIDS 3 3
structure in this size range, there will usually be almost no small angle x-ray scattering.
However, when a simple fluid is near its critical point, density fluctuations extend over distances much larger than the average inter- molecular spacing, and the small angle x-ray scattering becomes relatively large. This effect, which is often called *'critical opalescence," because it is essentially the analog of the opalescent light scattering observed near the critical point, has been studied in order to obtain information about the long-range behavior of the pair correlation function for a fluid near its critical point.
Because of the different methods of data analysis usually used in small and large angle x-ray scattering, the small and large angle x-ray scattering results will be discussed in separate sections.
Furukawa [1], Fournet [2], Gingrich [3], and Kruh [4] have reviewed large angle x-ray scattering from liquids. Details of small angle x-ray scattering theory and techniques are given by Guinier et ai [5] and Beeman et al. [6].
2* Large Angle Scattering
2.1. INTRODUCTION
For a fluid with spherically symmetric identical molecules, the pair correlation function g(r) can be obtained from the scattered intensity 1(h) by the relation [1^4]
M = l +ikf/ hh ^ [m - l] (21)
where r is the distance between the centers of two molecules, p
0is the average number of molecules per unit volume, L(h) = 7(Ä)[/
e(Ä)AfF
2(A)]
_1, N is the number of molecules in the scattering sample, I
eF
2(h) is the intensity scattered by a single molecule under the experimental condi- tions for which 1(h) is measured, h = 4πλ~
τsin θ, 2Θ is the scattering angle, and λ is the x-ray wavelength. The quantity L(h) is often called the liquid structure factor.
The location of the maxima in the function 4nr
2p
0g(r) gives the most
probable distances of separation of atoms, and from the area under the
maxima, the number of atoms in each coordination shell can be estimated,
although the results may be uncertain by as much as 10 to 2 0 % because
of possible ambiguities in assigning the area to be included under a given
maximum and because of the sensitivity of the form of g(r) to experimen-
tal errors. Mikolaj and Pings [7] have recently discussed the computation of the coordination number for fluids.
A number of assumptions must be made in order to apply (2.1) to experimental data.
First, (2.1) is directly applicable only to fluids with spherically sym- metric molecules. However, a modified form of (2.1) can be used with other simple fluids [4].
Although 1(h) must be known at all scattering angles before the integral in (2.1) can be evaluated, experimental conditions limit the angles at which data can be obtained. Considerable study has been devoted to correction for errors resulting from the limitation of the angular range over which 1(h) is known, and correction procedures have been developed [8, 9].
The intensity 1(h) in (2.1) is the net intensity after the experimental data have been corrected for all experimental effects, such as background scattering, polarization, and absorption, which can distort the measured scattering curve. In addition, the incoherent scattering is assumed to have been subtracted from 1(h). This correction, which is computed theoretically, is often somewhat uncertain, and much of the error in the determination of /(A), especially in the outer part of the scattering curve, may result from improper correction for incoherent scattering.
Another difficulty in evaluating L(h) arises from the need to know the atomic or molecular structure factor F
2(A), which is usually calculated from the best available atomic or molecular wave functions. Errors may be present in F
2(h) because of approximations which must be made in order to carry out the necessary calculations. In some cases, small errors in F
2(h) can have an appreciable effect on the g(r) curve.
All g(r) curves calculated from experimental scattering data are found to oscillate for r values in the neighborhood of r = 0. These oscillations are artifacts, since in this region g(r) must be zero because of the finite size of the molecules. Kaplow et al. [9] have described a semiempirical correction procedure which essentially eliminates these oscillations.
The precise normalization of 1(h) necessary for calculating L(h) is often difficult, and a completely satisfactory procedure is yet to be developed. The available techniques, however, are adequate for most investigations.
In spite of the above limitations on the reliability of the pair correlation functions computed from x-ray scattering data, with reasonable care g(r) can be determined with sufficient accuracy to permit meaningful comparison with theory.
Pair correlation functions can also be computed from (2.1) by use of
low-energy neutron scattering data. In principle, the results are
X-RAY SCATTERING STUDIES OF SIMPLE FLUIDS 3 5
equivalent to those obtained by x-rays. Because of the different experimental conditions and assumptions in neutron and x-ray scattering, however, the pair correlation functions computed from x-ray and neutron data have not always been found to be in perfect agreement.
Therefore, the results from both x-ray and neutron scattering data should be considered when the most reliable values of an experimentally determined pair correlation function are desired.
Pair correlation functions obtained from neutron scattering data are discussed in the chapter by Larsson and Sköld, this volume.
In fluids containing atoms with high atomic numbers, the x-ray absorption is so high that x-ray scattering studies are difficult or impos- sible, and few x-ray data are available. For example, xenon has been studied only twice by x-ray scattering, and krypton has not been investi- gated. Fluids of this type are usually best studied with neutrons, which are much less strongly absorbed than x rays. However, from an experimental standpoint, x-ray scattering is ordinarily preferable to neutron scattering when the x-ray absorption is not too high to make x-ray studies impractical, since for x rays the scattered intensity is higher, and because x-ray scattering apparatus can be constructed to give higher angular resolution than is possible with collimation systems for neutron scattering.
2.2. HELIUM
A number of x-ray scattering investigations of liquid helium have attempted to determine whether the λ-transition of liquid helium was associated with a change in the pair correlation function. In all these studies, however, the changes in the atomic ordering were either unob- servable or were found to be so small that they were barely detectable.
The λ-transition thus does not appear to be the result of a major change in the ordering of the helium atoms.
Because of the extreme experimental difficulties in measuring the x-ray scattering from liquid helium, most of the x-ray data [10-13] must be considered only qualitative.
Table I shows the corrected values obtained by Gordon et ah [14,14a]
for the liquid structure factor L(h) for liquid helium at its saturated vapor pressure at temperatures of 4.2°, 2.4°, and 1.4°K. The calculated theore- tical values of L(0), which are 0.44, 0.105, and 0.052 at 4.2°, 2.4°, and
1.4°K [14], respectively, agree quite well with extrapolations of the x-ray values of L(h) in Table I.
Values of 4nr
2p
0[g(r) — 1] are listed in Table II. The nearest neighbor
distances corresponding to the maxima in 4nr
2p
0g(r) are 4.00, 3.85, and
TABLE I
The Liquid Structure Factor L(h) for Helium
0h
(A-
1) 0 . 1 0.2 0.3 0.H 0.5 0.75 1.00 1.25 1.50 1.70 1.80 1.90 2.00 2.10 2.20 2.30 2.50 2.75 3.00 3.25 3.50 3.75 4.00 4.25 4.50 4.75 5.00 5.2S 5.50 5.75
20 (deg)
1.4 2.8 4.2 5.6 10.5 7.0 1 4 . 1 17.6 21.2 24.0 25.4 26.9 28.4 29.8 31.2 32.7 35.6 39.4 4 3 . 1 46.9 50.8 54.7 58.7 62.8 67.0 71.2 75.5 80.0 84.8 89.6
4.2°K 0.420 0.345 0.277 0.250 0.239 0.251 0.325 0.446 0.654 0.929 1.094 1.247 1.349 1.330 1.224 1.143 1.044 0.986 0.962 0.955 0.957 0.964 0.975 0.988 0.997 1 1 1 1 1
L(h) 2.4
eK
0.103 0.105 0.114 0.124 0.137 0.180 0.258 0.370 0.561 0.837 1.056 1.305 1.485 1.476 1.319 1.214 1.068 0.974 0.937 0.932 0.943 0.959 0.975 0.988 0.997
1.4
eK 0.058 0.070 0.087 0.104 0.125 0.180 0.258 0.376 0.573 0.860 1.070 1.255 1.417 1.374 1.268 1.190 1.072 0.990 0.952 0.948 0.945 0.960 0.975 0.988 0.997 1 1 1 1 1
a
At 1.40°, 2.20°, and 4. 20% the vapor pressure of He is 2.16, 40.5 and 749 mm Hg, respectively [ Brickwedde et al., 13a].
3.87 A for 4.2°, 2.4°, and 1.4°K, respectively, and the areas under these maxima represent 10.4, 10.5, and 10.6 atoms, respectively. Each of these numbers of atoms exceeds by 1 or 2 atoms the corresponding numbers found by neutron scattering [15]. Also, the x-ray nearest neighbor distances differ by about 2 % from the values obtained by neutron scattering. Because of the difficulty in assigning the area to be associated with each peak, and because of the possible effect of experimental errors on the form of g(r)
fthese differences in the x-ray and neutron values may not be significant. At present, there is no information available to suggest whether the x-ray or neutron results are more reliable.
The maxima in 47rr
2p
0g(r) are slightly sharper for 2.4° than for 1.4°.
A corresponding sharpening of the principal maximum occurs in the
L(h) curves. The direction of this change is opposite to that normally
observed in scattering curves and pair correlation functions as the
temperature is raised. (See Fig. 3 of Ref. 18, for example.) This effect
X-RAY SCATTERING STUDIES OF SIMPLE FLUIDS 37
TABLE II
Values of 47rr
2p
0[g(r) - l ] for Liquid Helium
ar(A) 1.4°K 2.4°K 4.2°K o o o o 0 25 - 0.03 - 0.03 - 0.03
0.50 - 0.10 - 0.09 - 0.09 0.75
1.00 1.25
0.16 - 0 . H - 0.13 0.20 - 0.18 - 0.17 0.31 - 0.29 - 0.28 l!50 - 0.58 - 0.57 - 0.50 1.75 - 0.95 - 0.96 - 0.82 2.00 - 1.26 - 1.31 - 1.10 2.25 - 1.34 - 1.41 - 1·16 2.50 - 1.04 - 1.13 - 1.02 2.75 - 0.46 - 0.52 - 0.45
3.00 0.21 0.22 0.10 3.25 0.77 0.86 0.57 3.50 1.09 1.24 0.87 3.75 1.14 1.31 0.98 4.00 0.93 1.01 0.90 4.25 0.55 0.63 0.66 4.50 0.07 0.06 0.29 4.75 - 0.39 - 0.50 - 0.14
5.00 - 0.74 - 0.91 - 0.52 5.25 - 0.90 - 1.09 - 0.74 5.50 - 0.85 - 1.01 - 0.75 5.75 - 0.62 - 0.71 - 0.58 6.00 - 0.28 - 0.26 - 0.29
6.25 0.09 0.22 0.03 6.50 0.42 0.61 0.32 6.75 0.65 0.86 0.53 7.00 0.71 0.89 0.61 7.25 0.60 0.71 0.55 7.50 0.36 0.38 0.37 7.75 0.06 - 0.02 0.12 8.00 - 0.23 - 0.39 - 0.13
8.25 - 0.45 - 0.64 - 0.31 8.50 - 0.56 - 0.74 - 0.40 8.75 - 0.53 - 0.65 - 0.38
9.00 - 0.39 - 0.43 - 0.279.25 - 0.17 - 0.11 - 0.11
9.50 0.07 0.21 0.08 9.75 0.27 0.45 0.23 10.00 0.38 0.57 0.32 10.25 0.40 0.54 0.32 10.50 0.31 0.38 0.25 10.75 0.17 0.15 0.13 11.00 - 0.01 - 0.11 0.00 11.25 - 0.18 - 0.32 - 0.13
11.50 - 0.29 - 0.43 - 0.19 11.75 - 0.32 - 0.43 - 0.20 12.00 - 0.28 - 0.32 - 0.16 12.25 - 0.17 - 0.14 - 0.07
12.50 - 0.02 0.06 0.04
a
At 1.4°, 2. 2°, and 4. 2°K, p
0is equal to 2.178, 2.193, and
1.885X 10
22cm"
3, respectively [Gordon, 14a, p. 132].
TABLE III
Liquid Structure Factor L(h) for Neon
0h
(A-
1) 24.7°K 25.5°K 26.6°K 33.1°K 39.4°K 44.2°K
. 4 . 5
• 6 . 7 . 8 1 . 0 . 9 1 . 1 1 . 2 1 . 3 1.»*
1 . 5 1 . 6 1 . 7 1 . 8 1 . 9 2 . 0 2 . 1 2 . 2 2 . 3 2 . 4 2 . 5 2 . 6 2 . 7 2 . 8 2 . 9 3 . 0 3 . 1 3 . 2 3 . 3 3 . 4 3 . 5 3 . 6 3 . 7 3 . 8 3 . 9
«♦.0 4 . 1 4 . 2 4 . 3 4 . 4 4 , 5 4 . 6 4 . 7 4 . 8 4 . 9 5 . 0 5 . 1 5 . 2 5 . 3 5 . 4 5 . 5 5 . 6 5 . 7 5 . 8 5 . 9 6 . 0
. 0 2 . 0 3 . 0 4 . 0 4
• 05
• 05 . 0 6 . 0 7 . 0 7 . 0 9 . 1 0 . 1 1 . 1 4 . 2 0 . 2 8 . 3 9 . 5 4 . 8 3 1 . 3 4 2 . 0 6 2 . 4 3 2 . 2 5 1 . 7 8 1 . 3 6 1 . 1 1 . 9 3 . 8 2 . 7 5 . 7 0 . 6 8 . 6 8 . 7 2 . 7 6 . 8 1 . 8 7 . 9 5 1 . 0 4 1 . 0 9 1 . 1 6 1 . 1 9 1 . 2 0 1 . 1 9 1 . 1 6 1 . 1 2 1 . 0 8 1 . 0 5 1 . 0 2 . 9 8 . 9 6 . 9 4 . 9 3 . 8 9 . 9 0 . 8 8 . 8 9 . 8 9 . 9 4
. 0 3 . 0 4 . 0 5 . 0 6 . 0 6 . 0 7 . 0 7 . 0 9 . 0 9 . 1 0 . 1 2 . 1 3 . 1 7 . 2 0 . 2 8 . 4 2 . 6 6 . 9 7 1 . 5 1 2 . 1 9 2 . 4 3 2 . 4 1 1 . 8 1 1 . 2 7 1 . 0 6 . 8 5 . 7 4 . 6 6 . 6 2
• 62 . 6 2 . 6 5 . 6 8 . 7 4 . 8 4 . 9 5 1 . 0 7 1 . 1 6 1 . 2 3 1 . 2 6 1 . 2 9 1 . 2 9 1 . 2 6 1 . 2 2 1 . 1 8 1 . 1 3 1 . 0 7 1 . 0 2 . 9 7 . 9 1 . 8 7 . 8 8 . 8 5 . 8 4 . 8 7 . 8 8 . 9 3
. 0 3 . 0 4 . 0 5 . 0 5 . 0 6 . 0 7 . 0 8 . 0 9 . 1 0 . 1 1 . 1 3 . 1 5 . 1 9 . 2 4 . 3 3 . 4 8 . 6 6 1 . 0 5 1 . 5 8 2 . 2 3 2 . 4 8 2 . 2 0 1 . 7 5 1 . 3 5 1 . 0 9 . 9 0 . 7 8 . 7 2 . 6 7 . 6 5 . 6 4 . 6 6 . 6 8 . 7 3 . 8 2 . 9 3 1 . 0 7 1 . 1 7 1 . 2 2 1 . 2 5 1 . 2 7 1 . 2 7 1 . 2 4 1 . 2 0 1 . 1 6 1 . 1 1 1 . 0 4 . 9 6 . 9 4 . 8 9 . 8 6 . 8 2 . 8 3 . 8 2 . 8 5
• 86 . 9 0
. 1 6 . 1 6 . 1 6 . 1 6 . 1 7 . 1 7 . 1 9 . 2 1 . 2 2 . 2 4 . 2 8 . 3 5 . 4 7
• 65 . 8 7 1 . 1 4 1 . 5 2 1 . 8 8 1 . 9 5 1 . 7 6 1 . 5 1 1 . 3 1 1 . 1 0 . 9 6 . 8 8 . 8 3 . 7 9 . 7 6 . 7 3 . 7 4 . 7 6 . 8 1 . 8 7 . 9 5 1 . 0 5 1 . 1 3 1 . 2 0 1 . 2 5 1 . 2 8 1 . 2 9 1 . 2 9 1 . 2 4 1 . 2 0 1 . 1 4 1 . 0 7 1 . 0 0 . 9 6 . 8 9 . 8 7 . 8 3 . 8 7 . 8 7 . 8 9 . 9 2 . 9 7
. 2 3 . 2 0 . 1 9 . 1 9 . 1 8 . 1 9 . 2 0 . 2 1 . 2 3 . 2 6 . 3 0 . 3 5 . 4 1 . 5 1 . 6 5 . 8 3 1 . 0 4 1 . 3 1 1 . 5 5 1 . 6 9 1 . 6 4 1 . 5 3 1 . 3 7 1 . 2 0 1 . 0 4 . 9 4 . 8 9 . 8 3 . 7 8 . 7 8 . 7 8 . 8 1 . 8 4 . 8 6 . 9 1 . 9 6 1 . 0 4 1 . 0 9 1 . 1 2 1 . 1 2 1 . 1 5 1 . 1 5 1 . 1 3 1 . 0 8 1 . 0 7 1 . 0 4 1 . 0 0 . 9 6 . 9 5 . 9 1 . 8 9 . 8 6 . 8 8 . 8 8 . 8 8 . 8 8 . 9 0
. 4 6 . 3 9 . 3 5 . 3 4 . 3 3 . 3 2 . 3 1 . 3 4 . 3 6 . 3 9 . 4 4 . 5 1 . 6 0 . 7 1 . 8 6 1 . 0 2 1 . 1 8 1 . 3 3 1 . 4 2 1 . 4 8 1 . 4 3 1 . 3 3 1 . 2 6 1 . 1 7 1 . 0 8 . 9 9 . 9 2 . 8 5 . 8 1 . 8 1 . 8 2 . 8 6 . 8 9 . 9 1 . 9 5 . 9 8 1 . 0 2 1 . 0 6 1 . 0 7 1 . 1 0 1 . 1 1 1 . 1 1 1 . 1 0 1 . 0 8 1 . 0 4 1 . 0 3 . 9 6 . 9 1 . 9 2 . 8 9 . 9 1 . 9 1 . 9 3 . 9 3 . 9 6 . 9 7 1 . 0 3 a
Table V shows the values of pressure and density at each
temperature.
X-RAY SCATTERING STUDIES OF SIMPLE FLUIDS 3 9 TABLE ΠΙ (continued)
h
6.1 6.2 6.3 6.4 6.5 6.6 6.7 6.8 6.9 7.0 7.1 7.2 7.3 7.4 7.5 7.6 7.7 7.8 7.9 8.0
24.7
eK 1.03 .97 1.04 1.08 1.10 1.10 1.12 1.08 1.03 1.0·»
1.00 .93 .97 .90 .89 .92 .95
• 95 1.00 .98
25. 5
eK 1.00 .94 1.02 l.Oi«
1.07 1.09 1.09 1.09 1.00 1.03 1.00 .95 .90
• 86 .84 .89 .95 .99 1.00 1.00
2β. 6
βΚ 1.00 .94 1.03 1.07 1.12 1.11 1.12 1.04 1.05 .93 .91 .92 .90 .90 .93
• 96
• 99 1.00 1.00 1.00
33.1
eK 1.01 1.09 1.09 1.13 1.15 1.13 1.10 1.06 1.00 1.00 1.00 1.00 1.00
39. 4
eK 1.03 .94 1.03 1.05 1.07 1.07 1.11 1.09 1.05 1.00 1.00 1.00 1.00
44.2*K 1.04 1.06 1.06 1.05 1.08 1.04 1.04 1.02 1.00 1.00 1.00 1.00 1.00
in liquid helium, though small, has been observed both by x-ray and neutrons. It cannot be due to a simple density change, since at its saturated vapor pressure, helium has the same density at 1.4 and 2.4°.
Thus the atomic ordering must be different at these two temperatures.
2.3. NEON
Stirpe and Tompson [16, 17] have studied the x-ray scattering from neon at a series of pressures and temperatures along the liquid-vapor transition. Their values of L(h) and 4nr
2p
0g(r) are listed in Tables III and IV. A series of tests strongly suggested that the peak in some of the curves at about 4 A was an artifact from the Fourier trans- formation and did not represent structure in liquid neon. Table V shows the locations of the first peaks in the 4nr
2p
0g(r) curves and the numbers of atoms corresponding to the areas under these maxima.
Because the scattered intensity was so low in this investigation, the results must be considered somewhat less reliable than the data for argon given in Section 2.4.
2.4. ARGON
Eisenstein and Gingrich [18, 19] studied the x-ray scattering from argon at a number of conditions of temperature and pressure.
Since this investigation was carried out with the most modern
equipment and techniques available at the time, the results can be
TABLE IV
Values of 4irr
ap
0ff(r) for Neon
0r(A) 0 . 0 0 . 1 0 . 2 0 . 3 O.i*
0 . 5 0 . 6 0 . 7 0 . 8 0 . 9 1 . 0 1 . 1 1 . 2 1 . 3 1 . 4 1 . 5 1 . 6 1 . 7 1 . 8 1 . 9 2 . 0 2 . 1 2 . 2 2 . 3 2 . 4 2 . 5 2 . 6 2 . 7 2 . 8 2 . 9 3 . 0 3 . 1 3 , 2 3 . 3 3 . 4 3 . 5 3 . 6 3 . 7 3 . 8 3 . 9 4 . 0 4 . 1 4 . 2 4 . 3 4 . 4 4 . 5 4 . 6 4 . 7 4 . 8 4 . 9 5 . 0 5 . 1 5 . 2 5 . 3 5 . 4 5 . 5 5 . 6
2 4 . 7 ° K 0 . 0 0 0 - 0 . 0 0 4 - 0 . 0 0 9 - 0 . 0 0 4
♦ 0 . 0 2 0
♦ 0 . 0 5 7
♦ 0 . 0 8 3
♦ 0 . 0 7 6
♦ 0 . 0 2 6 - 0 . 0 5 1 - 0 . 1 2 3 - 0 . 1 5 9 - 0 . 1 4 9 - 0 . 1 1 2 - 0 . 0 8 5 - 0 . 0 9 6 - 0 . 1 4 4 - 0 . 1 9 6 - 0 . 2 0 1 - 0 . 1 3 2 - 0 . 0 0 4
♦ 0 . 1 2 9 + 0 . 2 1 3
♦ 0 . 2 5 6
♦ 0 . 3 6 6
♦ 0 . 7 4 6
♦ 1 . 6 1 5
♦ 3 . 1 0 6
♦ 5 . 1 5 4
♦ 7 . 4 6 7 9 . 5 8 5 1 1 . 0 2 9 1 1 . 4 7 7 1 0 . 8 9 3 9 . 5 5 3 7 . 9 3 8 6 . 5 4 6 5 . 7 0 2 5 . 4 5 3 5 . 5 8 3 5 . 7 5 9 5 . 7 0 5 5 . 3 4 9 4 . 8 5 8 4 . 5 5 3 4 . 7 4 5 5 . 5 8 6 6 . 9 9 5 8 . 6 9 6 1 0 . 3 5 3 1 1 . 7 1 3 1 2 . 7 1 0 1 3 . 4 6 3 1 4 . 1 8 6 1 5 . 0 7 0 1 6 . 1 7 4 1 7 . 4 0 7
2 5 . 5 ° K 0 . 0 0 0
♦ 0 . 0 0 7
♦ 0 . 0 3 1
♦ 0 . 0 7 7
♦ 0 . 1 3 8
♦ 0 . 1 8 7
♦ 0 . 1 8 6
♦ 0 . 1 1 2 - 0 . 0 2 2 - 0 . 1 6 4 - 0 . 2 4 1 - 0 . 2 0 6 - 0 . 0 6 9
♦ 0 . 1 0 0
♦ 0 . 2 0 7
♦ 0 . 1 8 7
♦ 0 . 0 5 0 - 0 . 1 2 4 - 0 . 2 3 2 - 0 . 2 2 2 - 0 . 1 3 9 - 0 . 1 0 4 - 0 . 2 3 2 - 0 . 5 1 8 - 0 . 7 6 0 - 0 . 5 9 6
♦ 0 . 3 6 3
♦ 2 . 3 2 8
♦ 5 . 1 7 0
♦ 8 . 3 8 3 1 1 . 2 1 7 1 2 . 9 5 0 1 3 . 1 6 8 1 1 . 9 4 5 9 . 8 1 3 6 . 5 4 9 5 . 8 5 7 5 . 0 8 9 5 . 1 5 2 5 . 6 0 9 5 . 9 3 5 5 . 7 9 0 5 . 1 8 2 4 . 4 3 8 4 . 0 1 8 4 . 2 7 0 5 . 2 6 5 6 . 7 7 2 8 . 4 0 0 9 . 8 0 2 1 0 . 8 4 7 1 1 . 6 5 3 1 2 . 4 9 1 1 3 . 6 0 5 1 5 . 0 6 1 1 6 . 7 0 5 1 8 . 2 3 5
26. 6eK 0 . 0 0 0
♦ 0 . 0 0 2
♦ 0 . 0 1 2
♦ 0 . 0 3 9
♦ 0 . 0 8 2
♦ 0 . 1 2 4
♦ 0 . 1 3 8
♦ 0 . 0 9 9
♦ 0 . 0 0 8 - 0 . 1 0 9 - 0 . 2 0 0 - 0 . 2 1 8 - 0 . 1 4 3 - 0 . 0 0 1
♦ 0 . 1 5 1
♦ 0 . 2 5 1
♦ 0 . 2 6 5 + 0 . 2 0 0
♦ 0 . 0 8 9 - 0 . 0 2 9 - 0 . 1 4 5 - 0 . 2 7 7 - 0 . 4 3 2 - 0 . 5 6 6 - 0 . 5 3 4 - 0 . 1 1 4 + 0 . 9 2 0 + 2 . 6 8 4 + 5 . 0 7 4 + 7 . 7 3 2 1 0 . 1 1 7 1 1 . 6 7 5 1 2 . 0 3 9 1 1 . 1 8 4 9 . 4 5 9 7 . 4 6 5 5 . 8 3 4 4 . 9 8 6 4 . 9 8 6 5 . 5 4 6 6 . 1 8 6 6 . 4 6 7 6 . 1 9 9 5 . 5 2 6 4 . 6 4 5 4 . 6 1 3 5 . 1 3 3 6 . 4 1 0 8 . 1 5 6 9 . 9 3 0 1 1 . 3 4 5 1 2 . 2 3 2 1 2 . 7 0 7 1 3 . 0 8 2 1 3 . 7 0 6 1 4 . 7 8 1 1 6 . 2 6 5
3 3 . 1 ° K 0 . 0 0 0 + 0 . 0 2 2 + 0 . 0 7 5
♦ 0 . 1 2 9
♦ 0 . 2 5 1 + 0 . 1 2 1 + 0 . 0 4 6 - 0 . 0 4 8 - 0 . 1 2 6 - 0 . 1 6 2 - 0 . 1 5 3 - 0 . 1 1 6 - 0 . 0 7 9 - 0 . 0 5 8 - 0 . 0 4 9 - 0 . 0 2 7 + 0 . 0 3 8 + 0 . 1 5 8 + 0 . 3 0 3 + 0 . 4 0 7 + 0 . 3 9 2 + 0 . 2 0 7 - 0 . 1 2 0 - 0 . 4 6 3 - 0 . 6 0 9 - 0 . 3 1 5 + 0 . 6 0 3 + 2 . 1 9 0 + 4 . 2 9 9 + 6 . 5 9 8 8 . 6 5 0 1 0 . 0 3 1 1 0 . 4 6 1 9 . 8 9 5 8 . 5 4 7 6 . 8 2 5 5 . 2 1 0 4 . 1 0 9 3 . 7 3 7 4 . 0 6 5 4 . 8 5 5 5 . 7 6 1 6 . 4 6 0 6 . 7 6 6 6 . 6 8 3 6 . 3 8 8 6 . 1 4 7 6 . 2 1 1 6 . 7 1 9 7 . 6 5 5 8 . 8 7 0 1 0 . 1 4 7 1 1 . 2 8 9 1 2 . 1 9 2 1 2 . 8 6 5 1 3 . 4 1 1 1 3 . 9 6 8
3 9 . 4eK 0 . 0 0 0 + 0 . 0 0 4 + 0 . 0 1 3 + 0 . 0 2 2 + 0 . 0 3 0 + 0 . 0 3 5
♦ 0 . 0 4 2
♦ 0 . 0 5 3 + 0 . 0 6 8 + 0 . 0 7 4
♦ 0 . 0 5 8 + 0 . 0 0 6 - 0 . 0 8 1 - 0 . 1 8 3 - 0 . 2 6 0 - 0 . 2 7 0 - 0 . 1 8 7 - 0 . 0 2 2 + 0 . 1 7 2 + 0 . 3 1 4 + 0 . 3 2 4 + 0 . 1 6 9 - 0 . 1 1 3 - 0 . 3 9 5 - 0 . 4 9 2 - 0 . 2 1 7 + 0 . 5 5 3 + 1 . 8 1 8 + 3 . 4 2 9 + 5 . 1 2 2 6 . 5 8 2 7 . 5 3 5 7 . 8 3 8 7 . 5 1 9 6 . 7 6 7 5 . 8 6 5 5 . 1 0 1 4 . 6 7 0 4 . 6 2 3 4 . 8 6 7 5 . 2 1 5 5 . 4 7 4 5 . 5 2 3 5 . 3 6 3 5 . 1 0 7 4 . 9 3 7 5 . 0 2 0 5 . 4 4 4 6 . 1 8 3 7 . 1 0 8 8 . 0 3 9 8 . 8 2 3 9 . 3 8 5 9 . 7 5 6 1 0 . 0 5 1 1 0 . 4 1 6 1 0 . 9 6 2
4 4 . 2°K 0 . 0 0 0 + 0 . 0 0 6 + 0 . 0 2 2 + 0 . 0 3 9 + 0 . 0 4 7 + 0 . 0 4 5 + 0 . 0 3 6 + 0 . 0 3 0 + 0 . 0 3 6
♦ 0 . 0 5 2
♦ 0 . 0 6 9
♦ 0 . 0 6 7
♦ 0 . 0 2 9 - 0 . 0 4 6 - 0 . 1 4 6 - 0 . 2 3 8 - 0 . 2 8 7 - 0 . 2 6 8 - 0 . 1 8 5 - 0 . 0 7 0 + 0 . 0 2 3 + 0 . 0 4 3 - 0 . 0 2 8 - 0 . 1 5 4 - 0 . 2 4 5 - 0 . 1 7 4 + 0 . 1 8 0 + 0 . 8 8 7 + 1 . 9 2 4 + 3 . 1 6 6 4 . 4 0 9 5 . 4 2 0 6 . 0 0 8 6 . 0 7 8 5 . 6 6 8 4 . 9 3 6 4 . 1 1 2 3 . 4 3 4 3 . 0 7 2 3 . 0 8 3 3 . 4 0 6 3 . 8 9 0 4 . 3 5 8 4 . 6 6 5 4 . 7 5 1 4 . 6 5 3 4 . 4 8 2 4 . 3 8 1 4 . 4 6 5 4 . 7 8 7 5 . 3 2 3 5 . 9 8 6 6 . 6 6 2 7 . 2 5 5 7 . 7 1 6 8 . 0 5 3 8 . 3 1 6 a
Table V shows the values of pressure and density at each
temperature.
X-RAY SCATTERING STUDIES OF SIMPLE FLUIDS 41 TABLE IV (continued)
r(A)
5.7 5.8 6.0 5·9 6.1 6.2 6.3 6.*
6.5 6.6 6.8 6.7 6.9 7.0 7.1 7.2 7.3
7.1*7.5 7.6 7.8 7.7 7.9 8.0 8.1 8.2 8.3
8.«48.6 8.5 8.8 8.7 8.9 9.0 9.1 9.2 9.3
9.»*9.5 9.6 9.7 9.8
10.09.9
24.7
βΚ
18.579 19.500 20.068 20.301 20.301 20.190 20.039 19.851«
19.600 19.260 18.922 18.691 18.737 19.171 20.001 21.124 22.373 23.602 24.750 25.863 27.049 28.«408 29.949 31.577 33.113 34.387 35.308 35.908 36.322 36.713 37.196 37.779 38.377 38.869 39.167 39.282 39.319 39.438 39.780 40.413 41.315 42.402 43.586 44.817
25.5
βΚ
19.366 19.968 20.120 20.049 19.995 20.078 20.246 20.323 20.138 19.640 18.954 18.337 18.065 18.310 19.077 20.222 21.548 22.897 24.220 25.560 26.990 28.532 30.122 31.627 32.912 33.906 34.637 35.204 35.720 36.249 36.776 37.242 37.587 37.815 37.998 38.250 38.668 39.283 40.051 40.886 41.726 42.571 43.489 44.573
26. β°Κ
17.897 19.320 20.238 20.548 20.358 19.925 19.520 19.319 19.340 19.476 19.578 19.555 19.430 19.332 19.437 19.891 20.748 21.959 23.404 24.944 26.472 27.930 29.306 30.601 31.809 32.911 33.879 34.699 35.378 35.464 36.441 36.890 37.306 37.692 38.051 38.403 38.783 39.231 39.779 40.434 41.182 42.000 42.877 43.821
33.1
βΚ
14.634 15.428 16.276 17.048 17.614 17.900 17.918 17.765 17,577 17,486 17.569 17.832 18.223 18.668 19.111 19.545 20.011 20.581 21.317 22.245 23.334 24.510 25.670 26.762 27.721 28.560 2$.317 30.035 30.738 31.422 32.059 32.617 33.088 33.494 33.889 34.337 34.891 35.563 36.327 37.126 37.900 38.618 39.289 39.968
39. 4
βΚ
11.718 12.615 13.518 14.276 14.783 15.014 15.033 14,962 14.931 15.030 15.283 15.646 16.043 16.402 16.694 16.946 17.228 17.624 18.194 18.946 19.834 20.771 21.667 22.454 23.111 23.660 24,157 24.661 25.214 25.828 26.487 27.160 27.818 28.441 29.027 29.587 30.131 30.668 31.201 31.732 32.268 32.821 33.412 34.059
44. 2
βΚ
8.568 8.860 9.206 9.582 9.945 10.252 10,483 10.653 10,803 10,986 11.242 11.583 11.991 12.422 12.827 13.174 13.456 13.696 13.932 14.206 14.543 14.947 15.402 15.880 16.357 16.819 17.268 17.718 18.182 18.666 19.164 19.662 20.144 20.601 21.036 21.466 21.907 22.374 22.865 23.364 23.848 24.294 24.695 25.063
considered more reliable than much of the data published during this period.
Gingrich and Tompson [20] later remeasured the scattering from liquid argon near its triple point. Their results were essentially in complete agreement with the earlier data.
Mikolaj and Pings [21, 22] recently studied the large angle
x-ray scattering from argon in the critical region. Scattering curves
were obtained for several densities at temperatures for which PVT
measurements have been published [23]. Figure 2 shows these isotherms
TABLE V
Location and Area of the Main Peak in the 4irr
ap
0g(r) Curves and Corresponding Temperature, Density, and Pressure Data for Neon Temp.
24.7 no
25.5 26.6 33.1 39.4 44.2
Density (gm/cm
s)
1.25 1.23 1.22 1.09 0.92 0.67
Pressure (atm)
0.458 0.595 0.88 4.60 13.2 26.9
Peak Position
(A) 3.18 3.17 3.18 3.20 3.21 3.26
Area (atoms)
8.4 8.5 8.4 7.7 5.5 4.3
I I I I I L- 0 0.2 0.4 0.6 0.8 1.0
DENSITY (gmAc)
FIG. 2. Argon isotherms in the critical region, taken from Michels et al. [23].
(O)-Conditions at which scattering curves were obtained by Pings and Mikolaj, and (Δ) conditions at which scattering curves were obtained by Eisenstein and Gingrich.
and indicates the conditions for which Mikolaj and Pings and Eisenstein and Gingrich obtained x-ray scattering data.
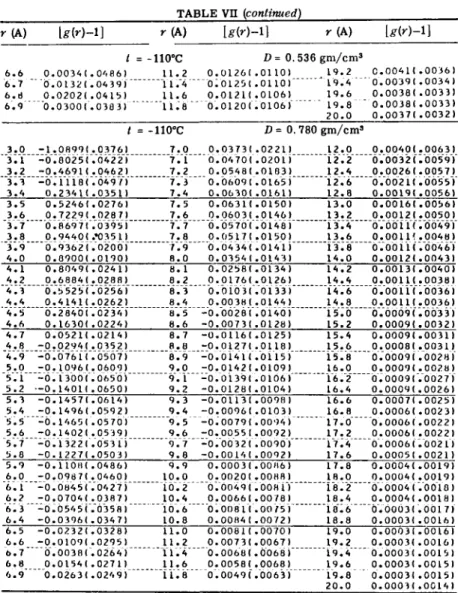
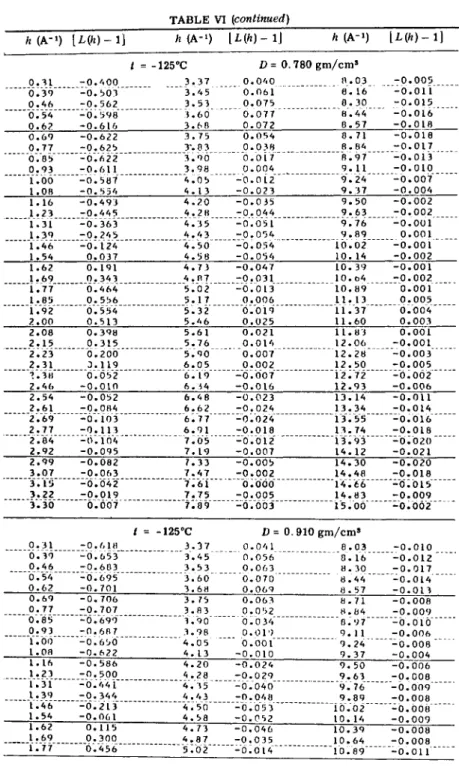
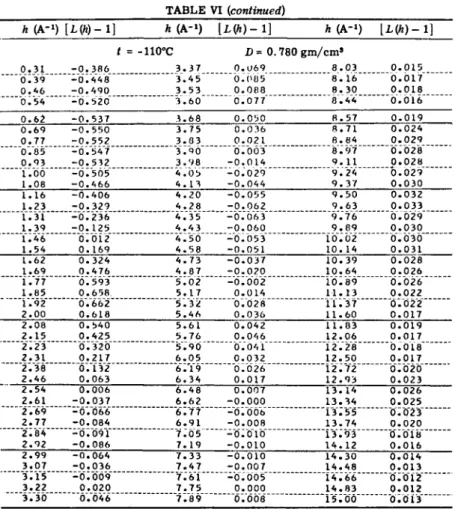
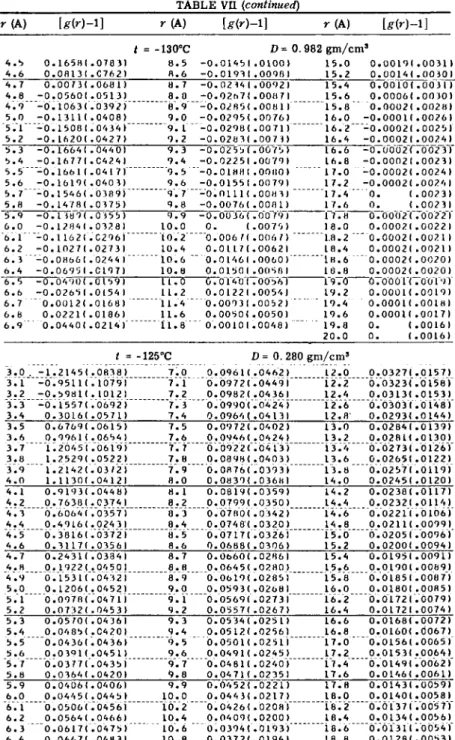
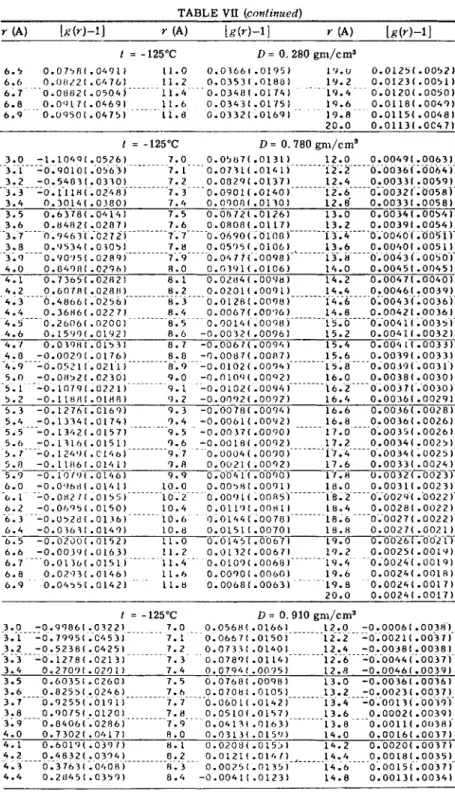
Tables VI and VII give the values of [L(h) — 1] and [g(r) — 1]
obtained by Mikolaj and Pings for argon in the critical region. In
Tables VIII and IX, h[L(h) - 1] and 47rr
2Pog(r) are listed for three
X-RAY SCATTERING STUDIES OF SIMPLE FLUIDS 4 3
FIG. 3. The liquid structure factor L(h) for argon near the triple point.
12
10
ATOMS ANGSTROM PER
! '
**"*\·
/ \ >
.
I I
ΓΤ
A\ / y\v Yf
• \ *
^ ·\
χ\ / /
/f/ ■ '
. y i
//
7.7.//
. I
A\ }\
/
*· ? * ? ? 1
RADIUS ANGSTROMS
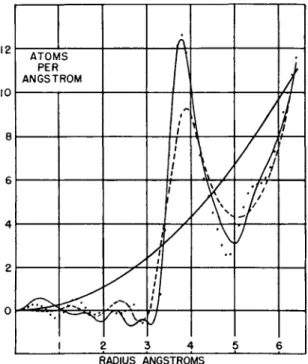
FIG. 4. Curves 47rr
2p
0g(r) for argon near the triple point, according to different
observers. ( ) results of Gingrich and Tompson, (· · ·) curve obtained by a recal-
culation from the data of Eisenstein and Gingrich, and ( ) computed by Henshaw
from neutron scattering data.
TABLE VI
Values of [L(h) - l] for Argon in the Critical Region for a Series of Conditions of Temperature / and Density D
MA"1) [L(h)-1] h (A"1) [L(h)-1]
Ä(A-i) IL(Ä)-1]
t = -130°C D = 0.910 gm/cra*
0.31 0.39 0.46 0.54 0.62 0.69 0.77 0.05 0.93 1.00 1.00
- 0 . 6 2 1 - 0 . 6 6 1 - 0 . 6 0 9 - 0 . 7 0 2 - 0 . 7 0 3 - 0 . 7 0 8 - 0 . 7 0 6 - 0 . 6 9 8 - 0 . 6 7 9 - 0 . 6 5 6 - 0 . 6 3 0
3.37 3.45 3.53 3.60 3.68 3.75 3.03 3.90 3. 90 4.05 4.13
0.066 0.007 0.096 0.098 0.095 0.083 0.065 0.045 0.024 0.005 - 0 . 0 0 8
8.03 8 . 16 8.30 8.44 8.57 8.71 8.84 8.97 9.11 9.24 9.37
0.003 0.001 0.002 0.001 0.002 - 0 . 0 0 0 0.003 - 0 . 0 0 1 - 0 . 0 0 0 - 0 . 0 0 0 - 0 . 0 0 3 1.16
1.23 1.31 1.39 1.46 1.54 1.62 1.69 1.77 1.85 1.92 2.00 2.08 2.15 2.23 2.31 2.38 2.46 2.54 2.61 2.69 2.77 2.84 2.92 2.99 3.07 3.22 3.30
0.31 0.39 0.46 0.54 0.62
- 0 . 5 7 4 - 0 . 5 0 7 - 0 . 4 2 7 - 0 . 3 2 5 - 0 . 2 1 9 - 0 . 0 6 0 0.125 0.315 0.459 0.542 0.540 0.494 0.359 0.261 0.163 0.062 - 0 . 0 1 0 - 0 . 0 6 8 - 0 . 1 0 6 - 0 . 1 2 6 - 0 . 1 4 5 - 0 . 1 5 0 ' " - O . Ï 4 T " ' ·
- 0 . 1 3 4 -0.10Θ - 0 . 0 7 5 - 0 . 0 3 6 0.002 0.038
t - 0 . 7 0 0 - 0 . 7 2 8 - 0 . 7 3 7 - 0 . 7 4 5 - 0 . 7 4 4
4.20 4.20 4.35 4.43 4.50 4.58 4.73 4.87 5.02 5.17 5.32 5.46 5.61 5.76 5.90 6.05 6.19 6.34 6.48 6.62 6.77 6 . 9 1 T . 0 5 "
7.19 7.33 7.47
™Τ."6'Γ"
7.75 7.89
= -130°C 3.37 3.45 3.53 3.60 3.60
- 0 . 0 1 7 - 0 . 0 2 4 - 0 . 0 3 0 - 0 . 0 3 5 - 0 . 0 3 / - 0 . 0 3 4 - 0 . 0 1 8 0.000 0.020 0.036 0.044 0.04 5 0.041 0.024 0.013 - 0 . 0 0 0 - 0 . 0 0 9 - 0 . 0 1 6 - 0 . 0 2 0 - 0 . 0 2 1 - 0 . 0 2 3 - 0 . 0 1 9 - 0 . 0 1 7
-ο.οιι
- 0 . 0 0 7 - 0 . 0 0 3 - 0 . 0 0 0 0.004 0.005 D = 0.063 0.087 0.101 0. 110 O.iiO
9.50 9.63 9.76 9.89 10.02 10.14 10.39 10.64 10.89 11.13 11.37 11.60 11.83 12.06 12.28 12.50 12.72 12.93 13.14 13.34 13.55 13.74 Ϊ 3 Τ ; 9 3 "
14.12 14.30 14.48 14.66 14.83 15.ÖÖ ' 0. 982 gm/cms
8.03 8 . 16 8.30 8.44 8.57
- 0 . 0 0 2 - 0 . 0 0 3 - 0 . 0 0 2 0.005 0.006 0.006 0.006 0.005 0.005 0.006 0.003 0.002 0.001 0.002 0.001 0.005 0.004 0.004 0.004 0.004 0.005 0.007
"0.ÖÖ9 0.013 0.019 0.027
"""0"."03Τ 0.050
Ö.Ö57 "
0.002 0.001 0.006 0.004 0.007 0.69
0.77 -0.736
-0.735 3 . 7 5
3 . 8 3 0.097
0.074 8 . 7 1
8 . 8 4 0 . 0 1 0 0 . 0 1 3 0.05
0.93 1.00 1.08 1.16 1.23 1.31 1.39 1.46 1.54
- 0 . 7 3 6 - 0 . 7 0 7 - 0 . 6 0 9 - 0 . 6 5 9 - 0 . 6 1 0 - 0 . 5 4 1 - 0 . 4 7 6 - 0 . 3 5 3 - 0 . 2 1 2 - 0 . 0 7 5
3.90 3.98 4.05 4.13 4.20 4.28 4.35 4.4 3 4.50 4.58
0.050 0.027 - 0 . 0 0 5 - 0 . 0 2 6 - 0 . 0 3 6 - 0 . 0 3 9 - 0 . 0 3 9 - 0 . 0 3 7 - 0 . 0 3 7 - 0 . 0 3 7
8.97 9 . 1 1 9.24 9.37 9.50 9.63 9.76 9.89 10.02 10.14
0.013 0.013 0.014 0.016 0.017 0.020 0.017 0.015 0.015 0.010
0 . 1 2 4 -0.030 1 0 . 3 9 0 . 0 1 1


![TABLE Vu (continued) r(A) [g(r)-l] r(A) [g(r)-l] r (A)](https://thumb-eu.123doks.com/thumbv2/9dokorg/1180162.86595/30.664.104.562.110.855/table-vu-continued-r-a-g-a-a.webp)