Citation:Mosolygó, T.; Laczi, K.;
Spengler, G.; Burián, K. A Practical Approach for Quantitative
Polymerase Chain Reaction, the Gold Standard in Microbiological Diagnosis.Sci2022,4, 4. https://
doi.org/10.3390/sci4010004 Academic Editor: Marcello Iriti Received: 20 September 2021 Accepted: 7 January 2022 Published: 17 January 2022 Publisher’s Note:MDPI stays neutral with regard to jurisdictional claims in published maps and institutional affil- iations.
Copyright: © 2022 by the authors.
Licensee MDPI, Basel, Switzerland.
This article is an open access article distributed under the terms and conditions of the Creative Commons Attribution (CC BY) license (https://
creativecommons.org/licenses/by/
4.0/).
Article
A Practical Approach for Quantitative Polymerase Chain Reaction, the Gold Standard in Microbiological Diagnosis
Tímea Mosolygó1,2,†, Krisztián Laczi3,† , Gabriella Spengler1,2,* and Katalin Burián1,2
1 Department of Medical Microbiology, Albert Szent-Györgyi Health Center and Albert Szent-Györgyi Medical School, University of Szeged, Semmelweis utca 6, H-6725 Szeged, Hungary;
office.omi@med.u-szeged.hu (T.M.); burian.katalin@med.u-szeged.hu (K.B.)
2 MTA-SZTE Microbiology and Health Education Research Group, H-6720 Szeged, Hungary
3 Department of Biotechnology, University of Szeged, Közép fasor 52, H-6726 Szeged, Hungary;
laczi.krisztian@brc.hu
* Correspondence: spengler.gabriella@med.u-szeged.hu; Tel.: +36-62-545-115
† These authors contributed equally to this work.
Abstract: From gene expression studies to identifying microbes, quantitative polymerase chain reaction (qPCR) is widely used in research and medical diagnostics. In transmittable diseases like the Ebola outbreak in West Africa (2014–2016), or the present SARS-CoV2 pandemic qPCR plays a key role in the detection of infected patients. Although the technique itself is decades old with reliable approaches (e.g., TaqMan assay) in the diagnosis of pathogens many people showed distrust in it during the SARS-CoV2 outbreak. This came mainly from not understanding or misunderstanding the principles of qPCR. This situation motivated us to design a simple laboratory practical class, in which students have opportunities to understand the underlying principles of qPCR and its advantages in microbiological diagnosis. Moreover, during the exercise, students can develop skills such as handling experimental assays, and the ability to solve problems, discuss their observations. Finally, this activity brings them closer to the clinical practice and they can see the impact of the science on real life. The class is addressed to undergraduate students of biological sciences.
Keywords:laboratory practical class; undergraduate teaching; qPCR
1. Introduction
The Polymerase Chain Reaction (PCR) was invented by Kary Mullis in 1983 and was first used by the team of Cetus Corporation [1]. Since then, PCR technology has undergone a huge development, and it has become one of the most valuable and reliable methods used in diagnostics and bioscience. From the original end-point PCR, two distinct technologies have emerged for the quantification of nucleic acid concentration. The quantitative PCR (qPCR), which is also known as real-time PCR, and the digital PCR (dPCR). All three technologies are based on the amplification of DNA with thermostable DNA dependent DNA polymerase under 20–40 heat cycles. Each cycle starts with the denaturing of the DNA followed by the annealing of the oligonucleotide primers and finally the elongation of the new strand. The theoretical product number at the end is the initial number of DNA molecules×2nwhere n is the number of cycles. The main difference between the three methods is the way the product is detected. In a traditional end-point PCR, the product can be detected with gel electrophoresis, and the amount of DNA is determined semi- quantitatively based on the intensity of fluorescence in the gel; therefore, it is not suitable for quantification. In contrast, the qPCR can follow the concentration changes in real-time by registering the level of fluorescence after every cycle. This allows the quantitation of genes, transcripts (cDNA), and microbes (by calculating genome equivalents dividing the measured copy number with the gene’s copy number in the genome) as well. The dPCR, on the other hand, kept the end-point detection, but it breaks down the reaction
Sci2022,4, 4. https://doi.org/10.3390/sci4010004 https://www.mdpi.com/journal/sci
Sci2022,4, 4 2 of 10
into hundreds or even thousands of micro reactions on microwell chips, or into droplets.
Every well/droplet contains exactly one or zero DNA molecules. After amplification, the positive wells/droplets are counted based on a fluorescent signal; thus, the original copy number of the sample can be determined without a calibration curve [2]. This is in contrast with qPCR, where a calibration curve or an inner standard is used for quantitation.
Although dPCR has been found superior in precision and efficiency compared to qPCR, and even the price/sample is lower for certain platforms, dPCR is more time consuming and labor-intensive [3]. Therefore, qPCR is still preferred in clinical diagnostics, and has become the gold standard of microbiological detection and quantification [4].
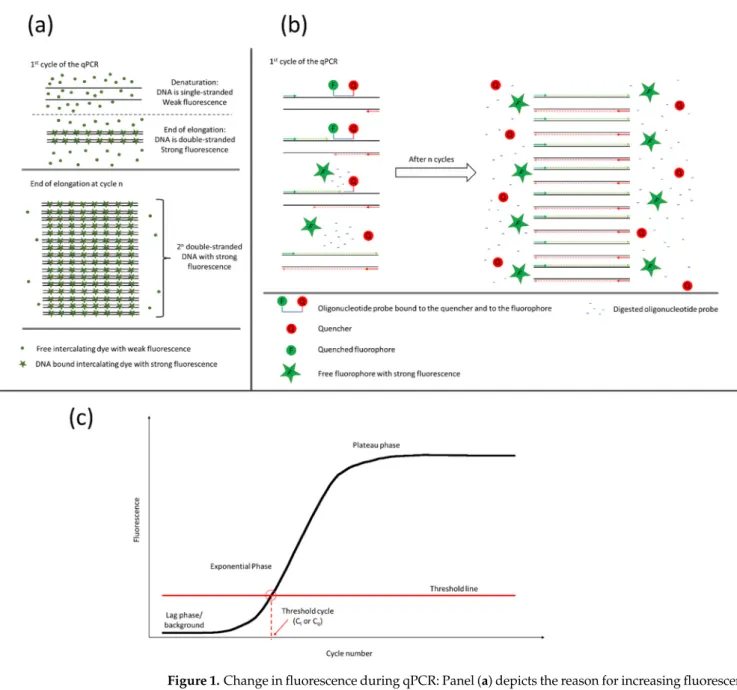
The qPCR operates with fluorescent dyes. As the product number increases cycle by cycle, the emitted fluorescent light becomes stronger. There are two different types of qPCR, the intercalating dye-based and probe-based. In case of a dye-based qPCR, the reason for the increasing fluorescent intensity is based on the fluorescent dye’s ability to emit light strongly only when it is intercalated into a double-stranded DNA (Figure1a). As the cycle number increases, more and more double-stranded DNA will be present in the sample so more light will be emitted. In a probe-based qPCR, besides the primers, a fluorescently labelled oligonucleotide probe is also added to the reaction. The probe hybridizes to the template between the two primers on one strand. It is bound to the fluorophore and the quencher, which quenches the fluorophore when they are in close vicinity. During the synthesis of the new strand, the DNA polymerase digests the probe, setting free the fluorophore and the quencher. The fluorophore moves away from the quencher and starts emitting light (Figure1b). In both cases, the increasing fluorescence can be described with a sigmoid curve (Figure1c). When the signal reaches the lower detection limit of the instrument, the fluorescence starts to increase exponentially. During the exponential phase, the reagents are exhausted and the curve goes into saturation. Where the curve crosses the threshold line, the threshold cycle or quantification cycle (Ctor Cq) is defined. The threshold line is set by three rules: the threshold should be (1) above the background noise, (2) on the log phase undisturbed by the plateau, and (3) at a point where all amplification curves are parallel. The Ctvalue is proportional to the initial template concentration [5].
Probe-based qPCR is highly specific for the light is emitted only when the probe can hybridize to the target sequence between the primers. Therefore, this method is considered a gold standard in microbial diagnostics [6].
The intercalating fluorescent dyes such as SYBR®Green, SYTO dyes, EvaGreen®, etc., emit light when bound to the double-stranded DNA and illuminated with UV light [7].
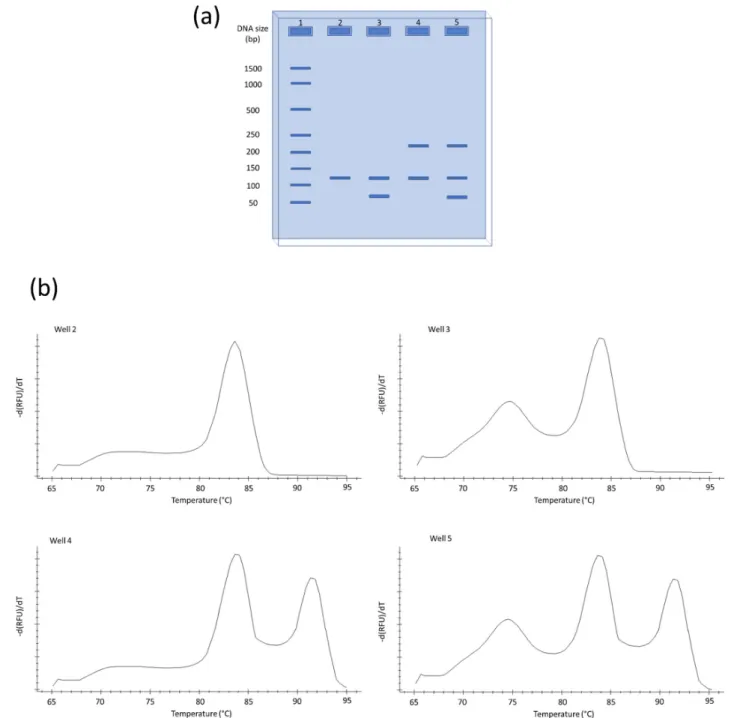
Although this technique is cost-effective compared to the probe-based qPCR, the design of the oligonucleotide primers should be carried out carefully. False products like primer dimers may generate bias in quantification. Melting point analysis can indicate the artefact’s presence in the samples, and the reaction or oligonucleotides can be optimized accordingly (Figure2). The melting peaks show the melting point of each of the products. With the help of melting point analysis, false products can be caught without gel electrophoresis.
The melting point of the DNA depends basically on two main factors, the length and the GC content of the fragment. Longer fragments have higher, shorter fragments have lower, melting points, and fragments with the same length but higher GC content will have higher melting points than their AT-rich counterparts. Therefore, melting point analysis is more sensitive than gel electrophoresis for the detection of false products. A computational method to correct qPCR results with the help of melting curves has recently been proposed [8].
Sci2022,4, 4 3 of 10
Sci 2022, 4, x FOR PEER REVIEW 3 of 11
is highly important in clinical diagnosis. In the case of SARS-CoV2 diagnosis, a significant ratio of the samples is false-negative in the advanced stages of the disease due to inade- quate sample collection [12].
The main purpose of this study was to design a simple laboratory practical approach to qPCR technology, in which students have opportunities to understand the underlying principles of qPCR and its advantages in microbiological diagnosis.
Figure 1. Change in fluorescence during qPCR: Panel (a) depicts the reason for increasing fluores- cence through the cycles of qPCR using intercalating dye. The dye has only weak fluorescence if not bound by DNA. At the end of each cycle where the products are present in double-stranded form, the intercalating dye binds the DNA and emits a strong light. More double-stranded products mean stronger fluorescence. Panel (b) shows the principles of probe-based qPCR. The probe-based qPCR approach uses target-specific oligonucleotide probes labelled with a fluorescent dye and a quencher molecule. During the synthesis of the new strand, the DNA polymerase digests the probe, setting free the fluorophore and the quencher. The fluorophore moves away from the quencher and starts emitting light. Both qPCR techniques result in similar fluorescent curves, as shown on panel (c). The curve can be split into 3 main phases. The first phase is the lag phase, where only the background noise is detected. In the second phase, the fluorescence increases exponentially, and runs fast into the plateau phase. In the plateau phase, the fluorescence stops increasing due to the depleted rea- gents. The threshold line cuts the curve in the exponential phase defining the threshold cycle.
Figure 1.Change in fluorescence during qPCR: Panel (a) depicts the reason for increasing fluorescence through the cycles of qPCR using intercalating dye. The dye has only weak fluorescence if not bound by DNA. At the end of each cycle where the products are present in double-stranded form, the intercalating dye binds the DNA and emits a strong light. More double-stranded products mean stronger fluorescence. Panel (b) shows the principles of probe-based qPCR. The probe-based qPCR approach uses target-specific oligonucleotide probes labelled with a fluorescent dye and a quencher molecule. During the synthesis of the new strand, the DNA polymerase digests the probe, setting free the fluorophore and the quencher. The fluorophore moves away from the quencher and starts emitting light. Both qPCR techniques result in similar fluorescent curves, as shown on panel (c). The curve can be split into 3 main phases. The first phase is the lag phase, where only the background noise is detected. In the second phase, the fluorescence increases exponentially, and runs fast into the plateau phase. In the plateau phase, the fluorescence stops increasing due to the depleted reagents.
The threshold line cuts the curve in the exponential phase defining the threshold cycle.
Sci2022,Sci 2022, 4, x FOR PEER REVIEW 4, 4 4 of 11 4 of 10
Figure 2. Correct and false PCR products shown on a schematic agarose gel (panel (a)) and melting peaks (panel (b)). In well 1, a DNA ladder is run, the size of the bands is on the left side of the gel.
Well 2 contains the correct PCR product without any contamination. In wells 3–5, besides the correct product, there are shorter and/or longer false products derived from mispriming or primer dimers.
The melting peaks are derivatives of melting curves obtained during melting point analysis.
2. Materials and Methods 2.1. Biological Material
Escherichia coli K-12 (ATCC 10798) was cultivated in Lysogeny Broth (10 g/L tryptone, 5 g/L yeast extract, 10 g/L NaCl) at 37 °C shaken at 160 rpm until OD600 = 1 (~8 × 10⁸ cells/mL). The cells were collected by centrifugation (10,000× g, 10 min) and concentrated 1.25 times in normal saline solution (9 g/L NaCl) resulting in a cell concentration of ~109 cells/mL.
Figure 2.Correct and false PCR products shown on a schematic agarose gel (panel (a)) and melting peaks (panel (b)). In well 1, a DNA ladder is run, the size of the bands is on the left side of the gel.
Well 2 contains the correct PCR product without any contamination. In wells 3–5, besides the correct product, there are shorter and/or longer false products derived from mispriming or primer dimers.
The melting peaks are derivatives of melting curves obtained during melting point analysis.
The outbreak of SARS-CoV-2 sped up the development of new systems using qPCR, e.g., in May of 2020, there were 81 kits and systems approved by the US FDA. Several low-cost intercalating dye-based methods for SARS-CoV2 diagnosis were published to overcome the financial struggle and elevate the throughput of virus diagnostics [9,10].
In the case of SARS-CoV-2 PCR assays targeting ORF1a and ORF1b, S and N genes can detect less than 10 genome equivalents [11]. It should be also mentioned that successful sampling is highly important in clinical diagnosis. In the case of SARS-CoV2 diagnosis, a significant ratio of the samples is false-negative in the advanced stages of the disease due to inadequate sample collection [12].
Sci2022,4, 4 5 of 10
The main purpose of this study was to design a simple laboratory practical approach to qPCR technology, in which students have opportunities to understand the underlying principles of qPCR and its advantages in microbiological diagnosis.
2. Materials and Methods 2.1. Biological Material
Escherichia coliK-12 (ATCC 10798) was cultivated in Lysogeny Broth (10 g/L tryptone, 5 g/L yeast extract, 10 g/L NaCl) at 37◦C shaken at 160 rpm until OD600= 1 (~8×10⁸cells/mL).
The cells were collected by centrifugation (10,000×g, 10 min) and concentrated 1.25 times in normal saline solution (9 g/L NaCl) resulting in a cell concentration of ~109cells/mL.
2.2. Isolation of DNA
DNA from 1 mL of the resuspended culture was extracted with QIAamp®DNA Mini kit (Qiagen, Hilden, Germany) according to the manufacturer’s instructions.
2.3. Serial Dilution
An eight-step serial dilution with a scale of tens was performed on the purified DNA. The most concentrated sample corresponds to 109cells/mL while the most diluted corresponds to 102cells/mL.
2.4. Quantitative Polymerase Chain Reaction
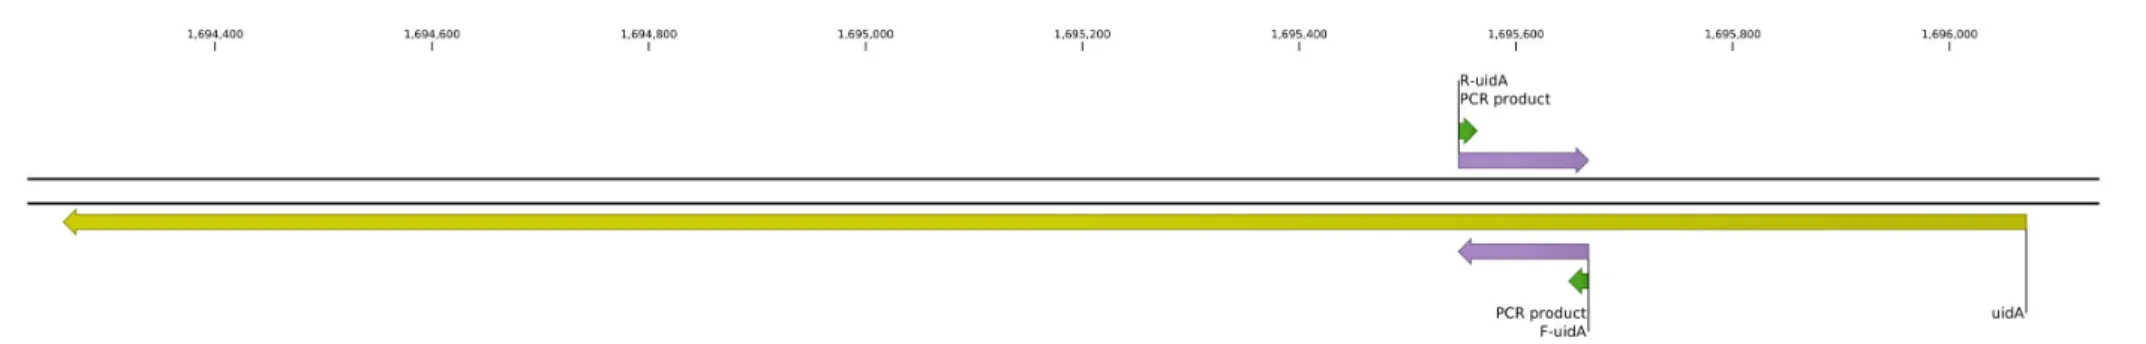
The concentration of theE. coliin each dilution was analysed via qPCR. For the detec- tion of theuidAgene, the following primers were used: 50-CAACGAACTGAACTGGCAG- 30and 50-CATTACGCTGCGATGGAT-30[13,14]. All primers were synthesized by Integrated DNA Technologies Inc. (Montreal, Quebec, Canada). The primer hybridization sites on the genomic DNA and the amplicon are shown on Figure3. The qPCR was conducted with the extracted and diluted DNA, primers (10 pmol/µL) and SYBR®Green JumpStartTMTaq ReadyMix (Merck KGaA, Darmstadt, Germany) in a total volume of 20µl, with a CFX96 Touch real-time PCR detection system (Bio-Rad, Hercules, CA, USA). Thermal cycling was initiated with a denaturation step of 10 min at 95◦C, followed by 40 cycles each of 5 s at 95◦C, 20 s at 60◦C and 25 s at 72◦C. Cycle threshold (Ct) values were determined by automated threshold with Bio-Rad CFX Maestro Software version 2.2. Primer efficiency was calculated automatically by the software based on the following equation:
Efficiency (%) = (10−1/slope−1)×100, (1) where ‘slope’ is the slope of the calibration curve.
2.5. Exercise Design
The first step in this laboratory session was to divide the students into 4 groups, where each group consisted of 3–4 students. Each group received 1 mL ofE. colisuspension (109cells/mL), then the students carried out four exercises. First, they extracted DNA from the original suspension ofE. coli. In the second step, they serially diluted the purified DNA, then they performed the qPCR. In the last step, the students involving the instructor presented and discussed their results obtained from the qPCR graph.
2.6. Safety Considerations
At the beginning of the laboratory session, students were briefly informed about the safety rules associated with working with biological samples, in order to avoid accidental contamination. In addition, students were informed about laboratory waste disposal and introduced to the location of the nearest fire extinguisher and first-aid kit. Disposable gloves, safety goggles, and a laboratory coat must be worn in the laboratory.
Sci2022,4, 4Sci 2022, 4, x FOR PEER REVIEW 6 of 11 6 of 10
Figure 3. Genomic positioning of the primer binding sites in the E. coli K12 substr. MG1655 genome (NC_000913). Green arrows indicate the primer binding sites, purple arrows indicate the two strands of the PCR product (genomic position: 1,695,547–1,695,667 bp), yellow arrow show the genomic position of uidA gene and the black lines are the two strands of the genomic DNA. The scale on the top indicates the genomic positions and should be read in base pairs.
Figure 3.Genomic positioning of the primer binding sites in theE. coliK12 substr. MG1655 genome (NC_000913). Green arrows indicate the primer binding sites, purple arrows indicate the two strands of the PCR product (genomic position: 1,695,547–1,695,667 bp), yellow arrow show the genomic position ofuidAgene and the black lines are the two strands of the genomic DNA. The scale on the top indicates the genomic positions and should be read in base pairs.
Sci2022,4, 4 7 of 10
3. Results
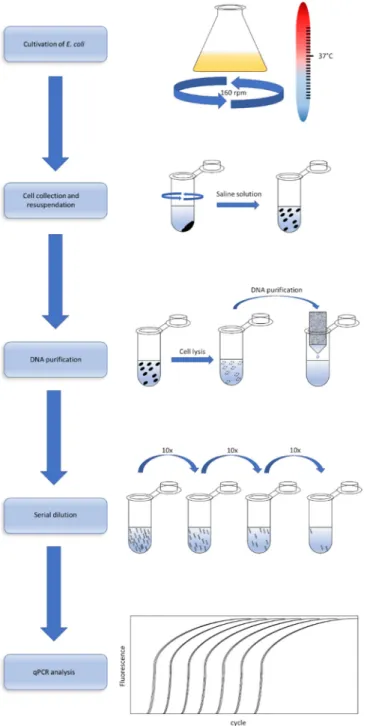
The exercises designed were assigned to four groups of students. The workflow of the laboratory procedure is summarized in Figure4. Students in each group extracted the DNA from the originalE. colisuspension, which corresponds to 109bacterial cells. Then, they serially diluted the purified DNA and carried out the qPCR experiments using each dilution.
The groups used the primers targeting theuidAgene (coding for beta-glucuronidase) and amplify a 121-bps long part of the gene.
Sci 2022, 4, x FOR PEER REVIEW 7 of 11
3. Results
The exercises designed were assigned to four groups of students. The workflow of the laboratory procedure is summarized in Figure 4. Students in each group extracted the DNA from the original E. coli suspension, which corresponds to 109 bacterial cells. Then, they serially diluted the purified DNA and carried out the qPCR experiments using each dilution. The groups used the primers targeting the uidA gene (coding for beta-glucuron- idase) and amplify a 121-bps long part of the gene.
Figure 4. Workflow of the laboratory exercises. Cultures were grown on 37 °C in an orbital shaker incubator. Cells were collected by centrifugation, then resuspended in saline solution. The cell sus- pension was treated with the QiaAmp® DNA Mini kit’s lysis solution, then the cell lysates were loaded to the QIAamp® Mini Spin Columns. After washing and elution, serial dilutions were made from the DNA samples by the factor of 10. The dilution series were utilized in the qPCR reactions.
Figure 4.Workflow of the laboratory exercises. Cultures were grown on 37◦C in an orbital shaker incubator. Cells were collected by centrifugation, then resuspended in saline solution. The cell suspension was treated with the QiaAmp®DNA Mini kit’s lysis solution, then the cell lysates were loaded to the QIAamp®Mini Spin Columns. After washing and elution, serial dilutions were made from the DNA samples by the factor of 10. The dilution series were utilized in the qPCR reactions.
Sci2022,4, 4 8 of 10
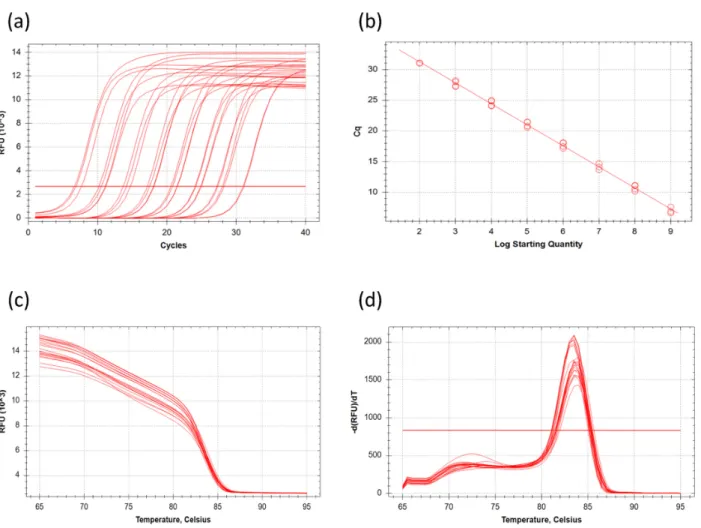
Figure5shows the Ctvalues obtained by all groups and the calibration curve cal- culated from the results. Groups 2 and 4 did not have amplification in the lowest DNA concentration sample. Group 1 had a higher Ctvalue in the first and third reactions and an abnormal amplification curve. These four samples were disclosed from further analysis and are not indicated in Figure2. The mean Ctvalue of undiluted DNA samples (109) was 7.08±0.52, while the lowest concentrated samples (102) reached the threshold with 31.07±0.06 Ct. On average 3.39 cycles were between the neighboring dilutions in the same series. This value is close to the theoretical 3.32 cycles difference between the elements of a 10 times dilution series. There was a slight difference between the samples of the groups for the Ctvalue of the same dilution varies with an average of 0.87 cycles. This deviation between the parallels might be caused by the pipetting error of distinct students.
The correlation between DNA concentration and cycle number was strong (R2= 0.993) and all parallels fit the trendline well. Groups 3 and 4 measured slightly lower Ctvalues for the same DNA concentration compared to groups 1 and 2 due to pipetting errors. All the data were appropriate, building the calibration curve with the equation y =−3.420x + 38.079 (Figure5b); the primer efficiency was 96.06%. At the end of the laboratory exercise, the students discussed their results, and interpreted the calibration curve. To improve their understanding of the main point of the experiment, students had to estimate the number of bacterial cells of unknown samples with the aid of the equation of the line.
Sci 2022, 4, x FOR PEER REVIEW 8 of 11
Figure 5 shows the Ct values obtained by all groups and the calibration curve calcu- lated from the results. Groups 2 and 4 did not have amplification in the lowest DNA con- centration sample. Group 1 had a higher Ct value in the first and third reactions and an abnormal amplification curve. These four samples were disclosed from further analysis and are not indicated in Figure 2. The mean Ct value of undiluted DNA samples (109) was 7.08 ± 0.52, while the lowest concentrated samples (102) reached the threshold with 31.07
± 0.06 Ct. On average 3.39 cycles were between the neighboring dilutions in the same se- ries. This value is close to the theoretical 3.32 cycles difference between the elements of a 10 times dilution series. There was a slight difference between the samples of the groups for the Ct value of the same dilution varies with an average of 0.87 cycles. This deviation between the parallels might be caused by the pipetting error of distinct students. The cor- relation between DNA concentration and cycle number was strong (R2 = 0.993) and all parallels fit the trendline well. Groups 3 and 4 measured slightly lower Ct values for the same DNA concentration compared to groups 1 and 2 due to pipetting errors. All the data were appropriate, building the calibration curve with the equation y = −3.420x + 38.079 (Figure 5b); the primer efficiency was 96.06%. At the end of the laboratory exercise, the students discussed their results, and interpreted the calibration curve. To improve their understanding of the main point of the experiment, students had to estimate the number of bacterial cells of unknown samples with the aid of the equation of the line.
Figure 5. Results of the qPCR experiment: The sigmoid curves of the amplification are shown on panel (a). RFU: relative fluorescence units. The horizontal red line represents the threshold. The calibration curve obtained from the dilution series is shown on panel (b). R2 = 0.993 where R2 is the square of the correlation coefficient and shows how well our model fits the real data points. R2 = 1 Figure 5.Results of the qPCR experiment: The sigmoid curves of the amplification are shown on panel (a). RFU: relative fluorescence units. The horizontal red line represents the threshold. The calibration curve obtained from the dilution series is shown on panel (b). R2= 0.993 where R2is the square of the correlation coefficient and shows how well our model fits the real data points. R2= 1 means
Sci2022,4, 4 9 of 10
a perfect fit, while lower values will represent less-perfect fits. Log starting quantity equals the theoretical cell number of the samples. Melting curves of the samples are shown on panel (c). This is a direct representation of fluorescence change in the samples in the function of the temperature.
As the temperature increases in the reaction tubes, the fluorescence drops gradually. The melting temperature is found where the melting curve becomes precipitous. If the curve has more precipitous sections, there will be multiple products with different melting temperatures in the sample. The melting peaks on panel (d) show the melting point more spectacularly (see Figure2for description).
4. Discussion
Emerging and re-emerging infections are global public health concerns. Accurate laboratory testing of the causative agent is essential for early discovery, isolation, and treatment, in order to cut off the transmission route. The outbreak of SARS-CoV-2 has drawn tremendous attention to the importance of clinical microbiology and the different molecular and serological methods, such as rapid antigen tests, PCR, and evaluation of the serum antibody levels. Viral RNA can be detected in the upper and lower respiratory tract, stool, blood, and urine of SARS-CoV-2 infected patients. Due to its sensitivity and specificity of qPCR is the preferred and most widely used method for detecting the presence of viral nucleic acid in these samples [15]. Collective understanding of qPCR’s basic principles is essential to increase trust in clinical diagnostics and pull out the venom of sceptic voices who spread disinformation out of profit or gullibility.
Unfortunately, the introduction of different molecular methods to undergraduate students in biology class is hampered by the lack of equipment and the cost of the reagents.
Moreover, the extremely rapid development of science has led to the fact that relatively few biology teachers have practical experience of DNA techniques during their training.
This situation motivated us to design a simple laboratory practical class, in which students have opportunities to understand the underlying principles of qPCR and its advantages in microbiological diagnosis. Through this activity, students can perform DNA extraction fromE. coliand carry out qPCR amplification, which are routine diagnostical tools in clinical microbiology. Moreover, during the exercise, students can develop skills such as handling experimental assays, and the ability to solve problems and discuss their observations. Finally, these exercises provide not only insight into the laboratory work, but also connect theory to practice and stimulate interest and enjoyment of science.
At the end of the class, the student should be able to conclude that qPCR can be used for the detection of nucleic acid in clinical samples, and the Ctvalue negatively correlates with the number of the given microorganism. The designed experiment can be performed over one laboratory class of 4 h or it can be divided into 3 sessions: (1) isolation of the DNA, (2) dilution and PCR assay, and (3) interpretation of the results.
For its cost-effectiveness, we chose the fluorescent dye-based qPCR method to per- form in this practical class. Although, in the diagnosis of SARS-CoV-2 infection, re- verse transcription-coupled qPCR (RT-qPCR) is used, since this virus possesses an RNA genome, in our designed protocol, DNA was used as templates, due to the instability of RNA molecules.
The presented protocol was successfully implemented in a microbiological laboratory course held for undergraduate students. The obtained results were appropriate building the calibration curve, only four samples were disclosed, due to abnormal amplification.
This practical class can be extended to introduce additional molecular diagnostical methods, such as isolation of RNA, multiplex qPCR, or RT-qPCR, where there is a reverse transcription step before the qPCR.
5. Conclusions
The goal of this laboratory practical class was for high school students to learn how to perform qPCR and to represent the results obtained in graphs. The laboratory exercises presented in this study promotes active learning about the impact of molecular methods and provides students with an opportunity to develop practical skills in the field of laboratory
Sci2022,4, 4 10 of 10
work. Finally, this activity brings the undergraduate students closer to the clinical practice and they can see the importance of science.
Author Contributions:T.M. wrote parts related to the materials and methods, the discussion and designed the experimental protocol. K.L. wrote parts related to the introduction and the results and prepared the figures. G.S. came up with the original idea of the study and revised the final manuscript. K.B. revised the final manuscript, supervised the study, and provided the funding. All authors have read and agreed to the published version of the manuscript.
Funding:The research was funded by the Pedagogy Research Program of the Hungarian Academy of Sciences (2016–2020).
Institutional Review Board Statement:Not applicable.
Informed Consent Statement:Not applicable.
Data Availability Statement:Not applicable.
Acknowledgments:The authors thank Veronika Péter-Kovács, JózsefnéKovács, IldikóVadásznéHorváth, and Brigitta Udvarhelyi (Tömörkény István High School, Szeged, Hungary) for pedagogical advice.
Conflicts of Interest:The authors declare no conflict of interest.
References
1. Saiki, R.K.; Gelfand, D.H.; Stoffel, S.; Scharf, S.J.; Higuchi, R.; Horn, G.T.; Mullis, K.B.; Erlich, H.A. Primer-Directed Enzymatic Amplification of DNA with a Thermosfiguere DNA Polymerase.Science1988,239, 487–491. [CrossRef] [PubMed]
2. Dong, L.; Meng, Y.; Sui, Z.; Wang, J.; Wu, L.; Fu, B. Comparison of four digital PCR platforms for accurate quantification of DNA copy number of a certified plasmid DNA reference material.Sci. Rep.2015,5, srep13174. [CrossRef] [PubMed]
3. Bosman, K.J.; Nijhuis, M.; Van Ham, P.M.; Wensing, A.M.J.; Vervisch, K.; Vandekerckhove, L.; De Spiegelaere, W. Comparison of digital PCR platforms and semi-nested qPCR as a tool to determine the size of the HIV reservoir.Sci. Rep. 2015,5, 13811.
[CrossRef] [PubMed]
4. Kralik, P.; Ricchi, M. A Basic Guide to Real Time PCR in Microbial Diagnostics: Definitions, Parameters, and Everything.Front.
Microbiol.2017,8, 108. [CrossRef] [PubMed]
5. Bustin, S.A.; Benes, V.; Garson, J.A.; Hellemans, J.; Huggett, J.; Kubista, M.; Mueller, R.; Nolan, T.; Pfaffl, M.W.; Shipley, G.L.; et al.
The MIQE Guidelines: Minimum Information for Publication of Quantitative Real-Time PCR Experiments.Clin. Chem.2009,55, 611–622. [CrossRef]
6. Navarro, E.; Serrano-Heras, G.; Castaño, M.; Solera, J. Real-time PCR detection chemistry.Clin. Chim. Acta2015,439, 231–250.
[CrossRef]
7. Gudnason, H.; Dufva, M.; Bang, D.D.; Wolff, A. Comparison of multiple DNA dyes for real-time PCR: Effects of dye concentration and sequence composition on DNA amplification and melting temperature.Nucleic Acids Res.2007,35, e127. [CrossRef]
8. Ruijter, J.M.; Ruiz-Villalba, A.; Hoff, A.J.J.V.D.; Gunst, Q.D.; Wittwer, C.T.; Hoff, M.J.B.V.D. Removal of artifact bias from qPCR results using DNA melting curve analysis.FASEB J.2019,33, 14542–14555. [CrossRef]
9. Zhu, H.; Zhang, H.; Xu, Y.; Laššáková, S.; Korabeˇcná, M.; Neužil, P. PCR past, present and future.Biotechniques2020,69, 317–325.
[CrossRef]
10. Marinowic, D.R.; Zanirati, G.; Rodrigues, F.V.F.; Grahl, M.V.C.; Alcará, A.M.; Machado, D.C.; Da Costa, J.C. A new SYBR Green real-time PCR to detect SARS-CoV-2.Sci. Rep.2021,11, 2224. [CrossRef]
11. Chu, D.K.W.; Pan, Y.; Cheng, S.M.S.; Hui, K.P.Y.; Krishnan, P.; Liu, Y.; Ng, D.Y.M.; Wan, C.K.C.; Yang, P.; Wang, Q.; et al. Molecular Diagnosis of a Novel Coronavirus (2019-nCoV) Causing an Outbreak of Pneumonia.Clin. Chem.2020,66, 549–555. [CrossRef]
12. Kinloch, N.N.; Ritchie, G.; Brumme, C.; Dong, W.; Dong, W.; Lawson, T.; Jones, R.B.; Montaner, J.S.G.; Leung, V.; Romney, M.G.;
et al. Suboptimal Biological Sampling as a Probable Cause of False-Negative COVID-19 Diagnostic Test Results.J. Infect. Dis.
2020,222, 899–902. [CrossRef]
13. Abberton, C.L.; Bereschenko, L.; van der Wielen, P.W.J.J.; Smith, C.J. Survival, Biofilm Formation, and Growth Potential of Environmental and Enteric Escherichia coli Strains in Drinking Water Microcosms.Appl. Environ. Microbiol.2016,82, 5320–5331.
[CrossRef] [PubMed]
14. Machado-Moreira, B.; Monteiro, S.; Santos, R.; Martinez-Murcia, A.; Rajkovic, A.; Smigic, N.; Richards, K.G.; Abram, F.; Burgess, C.M. Impact of beef extract used for sample concentration on the detection of Escherichia coli DNA in water samples via qPCR.
J. Microbiol. Methods2020,168, 105786. [CrossRef] [PubMed]
15. Zhang, W.; Du, R.-H.; Li, B.; Zheng, X.-S.; Yang, X.-L.; Hu, B.; Wang, Y.-Y.; Xiao, G.-F.; Yan, B.; Shi, Z.-L.; et al. Molecular and serological investigation of 2019-nCoV infected patients: Implication of multiple shedding routes.Emerg. Microbes Infect.2020,9, 386–389. [CrossRef] [PubMed]