sciences
Article
Spinel Iron Oxide by the Co-Precipitation Method: Effect of the Reaction Atmosphere
Sawssen Slimani1,2,3,*, Carlo Meneghini4 , Maryam Abdolrahimi3,4, Alessandro Talone3,4 ,
Jean Pierre Miranda Murillo1 , Gianni Barucca5 , Nader Yaacoub6, Patrizia Imperatori3, Erzsébet Illés7 , Mourad Smari2 , Essebti Dhahri2 and Davide Peddis1,3,*
Citation: Slimani, S.; Meneghini, C.;
Abdolrahimi, M.; Talone, A.; Murillo, J.P.M.; Barucca, G.; Yaacoub, N.;
Imperatori, P.; Illés, E.; Smari, M.;
et al. Spinel Iron Oxide by the Co-Precipitation Method: Effect of the Reaction Atmosphere.Appl. Sci.2021, 11, 5433. https://doi.org/10.3390/
app11125433
Academic Editors: Pietro Calandra, Domenico Lombardo,
Wei-Ning Wang and Raed Abu-Reziq
Received: 12 March 2021 Accepted: 4 June 2021 Published: 11 June 2021
Publisher’s Note:MDPI stays neutral with regard to jurisdictional claims in published maps and institutional affil- iations.
Copyright: © 2021 by the authors.
Licensee MDPI, Basel, Switzerland.
This article is an open access article distributed under the terms and conditions of the Creative Commons Attribution (CC BY) license (https://
creativecommons.org/licenses/by/
4.0/).
1 Dipartimento di Chimica e Chimica Industriale, Universitàdi Genova, Via Dodecaneso 31, 16146 Genova, Italy; jean_genoa96@live.it
2 Laboratoire de Physique Appliquée, Facultédes Sciences, Universitéde Sfax, B.P. 1171, Sfax 3000, Tunisia;
smarimourad97@gmail.com (M.S.); essebti@yahoo.com (E.D.)
3 Istituto di Struttura della Materia—Consiglio Nazionale delle Ricerche, via Salaria Km 29.300,
00015 Monterotondo Scalo (Rm), Italy; abdolrahimi.ps66@yahoo.com (M.A.); atalone84@gmail.com (A.T.);
patrizia.imperatori@mlib.ism.cnr.it (P.I.)
4 Department of Sciences, Roma Tre University of Rome, Via della Vasca Navale 84, 00146 Rome, Italy;
carlo.meneghini@uniroma3.it
5 Dipartimento SIMAU, UniversitàPolitecnica delle Marche, Via Brecce Bianche, 60131 Ancona, Italy;
g.barucca@staff.univpm.it
6 LUNAM, Institut des Molécules et Matériaux du Mans CNRS UMR-6283, Universitédu Maine, F-72085 Le Mans, France; nader.yaacoub@univ-lemans.fr
7 Department of Food Engineering, University of Szeged, Mars tér 5-7., H-6724 Szeged, Hungary;
Illes.Erzsebet@chem.u-szeged.hu
* Correspondence: Sawssen.Slimani@edu.unige.it (S.S.); davide.peddis@unige.it (D.P.)
Abstract:Synthesis atmosphere (i.e., air and nitrogen) effects on the physical properties and forma- tion mechanism of spinel iron oxide nanoparticles prepared via the co-precipitation method have been investigated using a multi-technique approach. The obtained magnetic nanoparticles (MNPs) were characterized using the X-ray diffraction, transmission electron microscopy (TEM), SQUID magnetometry, Mössbauer spectroscopy and X-ray absorption near-edge Structure spectroscopy techniques. The synthesis procedure leads to the formation of a spinel structure with an average crys- tallite size of 9.0(9) nm. The morphology of the particles synthetized under an inert atmosphere was quasi-spherical, while the nanoparticles prepared in air present a faceted shape. The small differences observed in morphological properties are explained by the influence of the reaction atmosphere on the formation mechanism of the MNPs. The magnetic characterization indicates that both samples exhibit superparamagnetic behavior at 300 K. The investigation by means of the Langevin approach at 300 K also leads to equal values for the mean size of the magnetic cores (Dm). Additionally, the analysis of the Mössbauer spectra revealed the lack of spin disorder for both samples, resulting in a high saturation magnetization. The fit of XANES spectrum suggests that about 2/3 of the iron ions reside in a local environment close to that ofγ-Fe2O3and about 1/3 close to that of Fe3O4for the sample synthetized in inert atmosphere.
Keywords:reaction atmosphere; co-precipitation; formation mechanism
1. Introduction
Spinel ferrite magnetic nanoparticles (MNPs) are attracting increasing interest due to the numerous areas of application that they have potential uses in, including biomedicine [1–3], magnetic resonance imaging (MRI) contrasting agents [4], drug deliv- ery [5,6], and wastewater treatment [7]. A characteristic property exploited in all these applications is their superparamagnetism (SPM) [8]. Typically, decreasing particle size until a critical value rc, induces the transition of the material from a magnetic multi-domain
Appl. Sci.2021,11, 5433. https://doi.org/10.3390/app11125433 https://www.mdpi.com/journal/applsci
Appl. Sci.2021,11, 5433 2 of 12
state (MD) to a magnetic single domain state (SD) [9]. On decreasing the particle size, the energy barrier,∆E (i.e., the energy required for the magnetic moment to flip between two minima) value becomes comparable to or smaller than that of thermal fluctuations (kBT) giving rise then to the so called superparamagnetic (SPM) regime in the system. Among the spinel ferrites, the most commonly used are magnetite (Fe3O4) and maghemite (γ-Fe2O3) due to their interesting properties such as high saturation magnetization, low toxicity and chemical stability [10]. However, the morpho-structural features and the magnetic proper- ties of such materials are strongly dependent on the synthesis method used. Accordingly, several synthesis methods have been reported in the literature such as sol-gel [11], thermal decomposition [12,13], microemulsion [14], and co-precipitation [15–18]. Among them, co-precipitation is one of the most used methods due to the favorable synthetic conditions (i.e., high reaction yield, safe and inexpensive precursors and solvent). The effect of several synthesis parameters (e.g., type of precipitating agent, stoichiometric ratio, temperature, etc.) on the chemical composition, morphology, size distribution and magnetic properties of MNPs have been investigated [19–24], but few, and often contradictory works, on the effect of reaction atmosphere have been carried out. It has been reported that a normal reaction atmosphere (i.e., air), leads to higher saturation magnetization (Ms) and narrower size distribution [25,26]. Other studies indicate that a higher Msand a sharper size dis- tribution were obtained using a controlled reaction atmosphere (i.e., inert precipitation medium) [27,28]. Accordingly, this paper focuses on the effect of reaction atmosphere on the morpho-structural and magnetic properties of spinel iron oxide nanoparticles. To clarify the contradictory data in the literature, a multi-technique approach has been used to investigate the effect of reaction atmosphere on the morpho-structural and magnetic properties of the materials. Spinel iron oxide nanoparticles have been prepared by a co- precipitation approach using air and an inert (i.e., nitrogen) reaction atmosphere. The thorough characterization of materials just shows small differences in morphological prop- erties that can been explained by the influence of the reaction atmosphere on the formation mechanism of the nanoparticles.
2. Materials and Methods
Spinel iron oxide nanoparticles were synthesized by the co-precipitation method using an aqueous solution of Fe2+and Fe3+with the stoichiometric ratio 1:2, by alkalization with 30% ammonia solution. The synthesis was done according to the following operating procedure: at 60◦C, a mixture of 6.21 mmol FeCl3.6H2O (>99%, Sigma-Aldrich, Schnelldorf, Germany) and 3.15 mmol FeCl2.4H2O (>99%, Sigma-Aldrich, Schnelldorf Germany) was dissolved in 100 mL 0.01 M HCl solution (Analysis iso, 37%, Carlo Erba, Paris, France.) previously purified by alternating vacuum and nitrogen (N2) gas cycles three times. The N2atmosphere was maintained and the solution was alkalinized with 30% ammonium hydroxide (ACS, 30%, Carlo Erba, Paris, France). After two hours, the resulting precipitate was washed with distilled water in several cycles assisted by centrifugation, then dried overnight in the oven at 60◦C. Finally, the obtained powder was labeled as FO−CA. To verify the effect of reaction atmosphere, a second sample, labeled as FO−NA, was prepared in air, leaving the other experimental conditions unaltered. It is worth mentioning that these experiments have been repeated more than one time, (see supporting information for further details).
The crystalline structure was characterized by X-ray diffraction (XRD) measurements, using a TT 3003 diffractometer (Seifert, Ahrensburg, Germany) equipped with a secondary graphite monochromator, employing CuKαradiation (λ= 1.5418 Å). Data were collected in the 10◦−70◦2ϑrange with a step size of 0.04◦and counting 4 sec per step. Transmission electron microscopy (TEM) analysis was carried out using a CM200 microscope (Philips, Amsterdam, The Netherlands.) operating at 200 kV and equipped with a LaB6 filament.
The samples in form of powder were dispersed in ethanol using ultrasonication. A drop of suspension was deposited on a commercial TEM grid covered with a carbon thin film and
maintained in air until complete evaporation of ethanol. Frequency counts of particles size are fitted with a log-normal function [29] using ImageJ software [30]:
P= 1
Dσ√ 2πexp
"
−ln
2(D/hDTEMi) 2σ2
#
(1)
whereσis the standard deviation and DTEMis the median of the log-normal distribution.
Mössbauer spectra were recorded in transmission geometry using a57Co/Rhγ-ray source mounted on an electromagnetic driving unit undergoing a triangular velocity form.
Experiments were carried out at 12 K using a bath cryostat. The quantity of powder is optimized at about 5 mg of Fe/cm2. The fitting procedure was done using the home-made unpublished MOSFIT software involving magnetic sextets and quadrupolar components with Lorentzian lines. DC magnetization measurements were performed with a supercon- ducting quantum interference device (SQUID) magnetometer (Hmax= 5.5 T; T = 5–400 K).
The sample in solid form was fixed using epoxy resin in polycarbonate capsule to prevent any movement of the powder during the measurement. All the magnetic measurements were normalized by the real mass of the sample. Saturation magnetization value (MS) was determined from the portion at high field of M=(H) curves using as a formula:
M=MS
1−A
H− B H2
(2) Fe K-edge (7112 eV) XAFS measurements were carried out at the XAFS beamline of the ELETTRA synchrotron [31]. X-ray absorption spectra were measured in transmission geometry at room temperature, measuring the X-ray intensities before (Io) and transmitted (It) through the sample using two gas optimized ionization chambers. An Fe metal foil is placed after the Itdetector and a third ionization chamber measured the transmitted X-ray flux (Iref) which is used to monitor the X-ray energy calibration during the exper- iment. XAFS samples were prepared by mixing a small amount of MNPs powder with polyvinylpyrrolidone (PVP) polymer in approximately 1/10 weight concentration. About 100 mg of the mixtures were compressed in thin solid pellets suitable to be mounted on the sample holder by Kapton tape. To improve the data statistics and reduce artefacts due to X-ray beam drifts, at least three scans were collected for each sample and averaged after checking for the correct energy scale. In addition, Fe-K edge spectra from commer- cial reference compounds were measured, in particular pure Fe metal foil, FeO, Fe3O4
andγ-Fe2O3oxide powders, in order to be used as standard references for Fe0, Fe2+and Fe3+oxidation states. The total absorption signal through the sample was calculated as a(E) = ln (Io/It) [32]. The raw absorption spectra a(E), of NP and reference samples were processed for pre-edge background subtraction and post-edge jump normalization accord- ingly to standard XAFS data analysis procedures and analyzed in the XANES region using a Linear Combination Fit procedure using the Athena program (from the Demeter software package [33] (see the Supporting Information for further details).
3. Results and Discussions 3.1. Morpho-Structural Properties
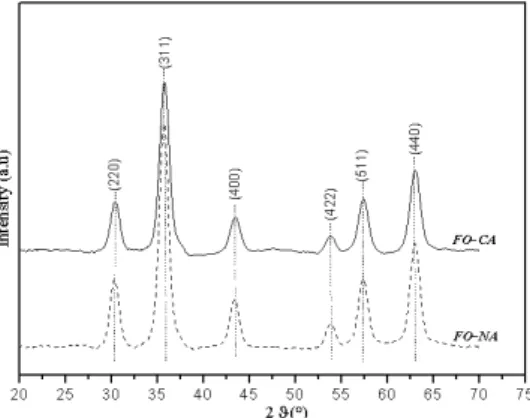
XRD patterns (Figure1) of both samples were indexed according to the spinel iron oxide (FO) structure (JCPDS card No.75-449). No extra phase has been detected and an average crystallite size of 9.0(9)nm was obtained for both samples by the Williamson-Hall method [34] (Table1).
Appl. Sci.2021,11, 5433 4 of 12
Appl. Sci. 2021, 11, x FOR PEER REVIEW 4 of 12
Figure 1. XRD patterns of samples synthesized in controlled atmosphere, nitrogen (FO-CA, solid line) and in normal atmosphere, air (FO-NA, dashed line).
Table 1. Crystallites size from X-ray Diffraction (DXRD), particle diameter from TEM (DTEM) and mag- netic diameter (Dm) for FO-CA and FO-NA nanoparticles, uncertainties on the last digit are given in parentheses.
Sample DXRD (nm) DTEM (nm) Dm(nm)
FO_CA 9.0(9) 9.0(9) 11(1)
FO_NA 9.0(9) 11(1) 12(1)
To investigate the magnetic structure of the sample Mössbauer spectroscopy under intense magnetic field (8T), applied parallel to the γ –beam has been recorded at low tem- perature (12 K) (Figure 2). When Mössbauer spectra of ferrites are recorded under an in- tense magnetic field, the magnetic splitting of the A-site Fe3+ ions increases and the B-site splitting decreases. Therefore, the applied field makes it possible to separate the A and B patterns and to obtain information about the inversion degree. For a thin sample, where thickness effects are negligible and where the direction of the hyperfine field is at random with respect to the gamma ray direction, the relative area of the Zeeman sextet are in the ratio:
3: 2p: 1: 1: 2p: 3 (3)
where p is dependent on the canting angle ϑ:
p = 2 sin θ
1 + cos θ (4)
By normalizing the total area to 1, the area of lines 2–5 (A2,5) is equal to:
A , =1
2sin θ (5)
In case of the absence of the canting effect, lines 2–5 disappear [35,36].
Fitting parameters are reported in Table 2. Spectra of both samples clearly show the inverse spinel structure of the particles. The high oxidation degree of magnetite was con- firmed by the low isomer shifts (δ) values [37]. Indeed, the mean isomer, which probes the electronic density at the 57Fe nuclei, that is the valence state, are consistent with the pres- ence of pure Fe3+ ions for both samples. The measurement at 77 K (see supporting infor- mation for further details) confirm this scenario with an isomer shift (0.45 mm/s) is about compatible with the presence of maghemite. X-ray Absorption Near-Edge Structure (XANES) spectroscopy measurements have also been performed on the FO−CA sample further confirming the presence of mainly maghemite (see supporting information for fur- ther details). The second and fifth lines have a non-zero intensity, indicating the presence of a non-collinear (canted) structure for iron magnetic moments with respect to the ap- plied field. The canting angle( ) of iron spins in tetrahedral and octahedral sites for FO−CA and FO−NA is relatively small suggesting the high crystallinity of the particles.
Figure 1.XRD patterns of samples synthesized in controlled atmosphere, nitrogen (FO-CA, solid line) and in normal atmosphere, air (FO-NA, dashed line).
Table 1. Crystallites size from X-ray Diffraction (DXRD), particle diameter from TEM (DTEM) and magnetic diameter (Dm) for FO-CA and FO-NA nanoparticles, uncertainties on the last digit are given in parentheses.
Sample DXRD(nm) DTEM(nm) Dm(nm)
FO_CA 9.0(9) 9.0(9) 11(1)
FO_NA 9.0(9) 11(1) 12(1)
To investigate the magnetic structure of the sample Mössbauer spectroscopy under intense magnetic field (8T), applied parallel to theγ –beam has been recorded at low temperature (12 K) (Figure2). When Mössbauer spectra of ferrites are recorded under an intense magnetic field, the magnetic splitting of the A-site Fe3+ions increases and the B-site splitting decreases. Therefore, the applied field makes it possible to separate the A and B patterns and to obtain information about the inversion degree. For a thin sample, where thickness effects are negligible and where the direction of the hyperfine field is at random with respect to the gamma ray direction, the relative area of the Zeeman sextet are in the ratio:
3 : 2p : 1 : 1 : 2p : 3 (3)
where p is dependent on the canting angleϑ: p= 2 sin
2θ
1+cos2θ (4)
By normalizing the total area to 1, the area of lines 2–5 (A2,5) is equal to:
A2,5= 1
2sin2θ (5)
In case of the absence of the canting effect, lines 2–5 disappear [35,36].
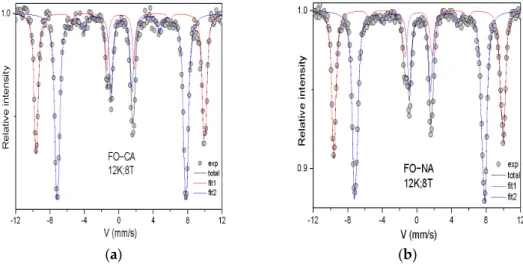
Fitting parameters are reported in Table2. Spectra of both samples clearly show the inverse spinel structure of the particles. The high oxidation degree of magnetite was confirmed by the low isomer shifts (δ) values [37]. Indeed, the mean isomer, which probes the electronic density at the57Fe nuclei, that is the valence state, are consistent with the presence of pure Fe3+ions for both samples. The measurement at 77 K (see supporting information for further details) confirm this scenario with an isomer shift (0.45 mm/s) is about compatible with the presence of maghemite. X-ray Absorption Near-Edge Structure (XANES) spectroscopy measurements have also been performed on the FO−CA sample further confirming the presence of mainly maghemite (see supporting information for further details). The second and fifth lines have a non-zero intensity, indicating the presence of a non-collinear (canted) structure for iron magnetic moments with respect to the applied
field. The canting angle(θ) of iron spins in tetrahedral and octahedral sites for FO−CA and FO−NA is relatively small suggesting the high crystallinity of the particles.
Appl. Sci. 2021, 11, x FOR PEER REVIEW 5 of 12
(a) (b)
Figure 2. 57Fe Mössbauer spectra measured at 12 K under high magnetic field (8 T) and fitted with 2 sextets corresponding to iron in A−site, and B−site (fitted using a Lorentzian lines) for (a) FO−CA and (b) FO−NA.
Table 2. Summary of obtained values. of hyperfine parameters (Isomer Shift, Quadrupolar Shift, Effective and Hyperfine fields, Angle θ, and weight) obtained at 12 K under external field of 8T.
Sample Sites 𝜹
(mm.S−1)
𝟐𝜺 (mm.S−1)
𝑩𝒆𝒇𝒇 (T)
𝑩𝒉𝒚𝒑 (T)
𝜽
(°) %
FO−CA A 0.36 −0.01 60.5 52.8 16 38
B 0.50 −0.00 46.2 53.8 20 62
FO−NA A 0.35 −0.03 60.4 52.8 16 39
B 0.51 −0.03 46.1 53.9 15 61
Sample morphology has been investigated by transmission electron microscopy. Fig- ure 3a,b show bright field TEM images showing general views of FO−CA and FO−NA, respectively. Samples contain aggregates of nanoparticles whose dimensions have been deduced by TEM images and statistically analyzed. A log-normal size distribution was obtained for both FO−CA and FO−NA, (see supporting information for further details) with mean size equal, within experimental error, for both samples, (Table 1). To further investigate the crystallographic structure, selected area electron diffraction (SAED) meas- urements have been performed on FO−CA and FO−NA. SAED patterns are composed of diffraction rings having the same diameters and intensities for both samples (see support- ing information for further details). The interplanar distances associated with the diffrac- tion rings reveal that they are both composed of polycrystalline iron oxide with a spinel structure, confirming XRD results. High−resolution TEM (HR−TEM) observations al- lowed us to better investigate the particles morphology. Figure 3c,d show HR−TEM im- ages of FO−CA and FO−NA particles, respectively. Looking at the atomic planes, it is ev- ident that FO−CA particles have a quasi-spherical shape while the FO−NA ones are gen- erally faceted. Generally speaking, in colloidal synthesis, the formation of crystals is dis- cussed in terms of nucleation and growth theory where chemical species are supposed to assemble directly from solution [38]. Accordingly, the best way to control the particle size and shape, is to separate these two steps (i.e., the nucleation step should be avoided dur- ing the growth of the nuclei [39]). Unfortunately in the co-precipitation method, it is not possible to separate the nucleation and the growth steps [40,41]. In typical co-precipitation synthesis, the pH of ferrous and ferric solution is increased via the addition of the base.
Depending on the method of base addition [38] (e.g., continuous or abrupt addition) dif- ferent formation pathways of magnetite nanoparticles can be observed [42,43]. In the in- vestigated synthesis procedure, the base was added in abrupt way (i.e., pH quickly in- creases from 2 to 9.2), resulting in significant pH gradient leading to the formation of
Figure 2.57Fe Mössbauer spectra measured at 12 K under high magnetic field (8 T) and fitted with 2 sextets corresponding to iron in A−site, and B−site (fitted using a Lorentzian lines) for (a) FO−CA and (b) FO−NA.
Table 2. Summary of obtained values. of hyperfine parameters (Isomer Shift, Quadrupolar Shift, Effective and Hyperfine fields, Angleθ, and weight) obtained at 12 K under external field of 8T.
Sample Sites δ
(mm.S−1) 2ε (mm.S−1)
Beff (T)
Bhyp (T)
θ
(◦) %
FO−CA A 0.36 −0.01 60.5 52.8 16 38
B 0.50 −0.00 46.2 53.8 20 62
FO−NA A 0.35 −0.03 60.4 52.8 16 39
B 0.51 −0.03 46.1 53.9 15 61
Sample morphology has been investigated by transmission electron microscopy.
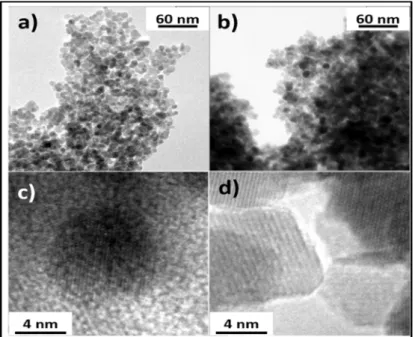
Figure3a,b show bright field TEM images showing general views of FO−CA and FO−NA, respectively. Samples contain aggregates of nanoparticles whose dimensions have been deduced by TEM images and statistically analyzed. A log-normal size distribution was obtained for both FO−CA and FO−NA, (see supporting information for further details) with mean size equal, within experimental error, for both samples, (Table1). To further investigate the crystallographic structure, selected area electron diffraction (SAED) mea- surements have been performed on FO−CA and FO−NA. SAED patterns are composed of diffraction rings having the same diameters and intensities for both samples (see sup- porting information for further details). The interplanar distances associated with the diffraction rings reveal that they are both composed of polycrystalline iron oxide with a spinel structure, confirming XRD results. High−resolution TEM (HR−TEM) observations allowed us to better investigate the particles morphology. Figure3c,d show HR−TEM images of FO−CA and FO−NA particles, respectively. Looking at the atomic planes, it is evident that FO−CA particles have a quasi-spherical shape while the FO−NA ones are generally faceted. Generally speaking, in colloidal synthesis, the formation of crystals is discussed in terms of nucleation and growth theory where chemical species are supposed to assemble directly from solution [38]. Accordingly, the best way to control the particle size and shape, is to separate these two steps (i.e., the nucleation step should be avoided during the growth of the nuclei [39]). Unfortunately in the co-precipitation method, it is not possible to separate the nucleation and the growth steps [40,41]. In typical co-precipitation
Appl. Sci.2021,11, 5433 6 of 12
synthesis, the pH of ferrous and ferric solution is increased via the addition of the base. De- pending on the method of base addition [38] (e.g., continuous or abrupt addition) different formation pathways of magnetite nanoparticles can be observed [42,43]. In the investigated synthesis procedure, the base was added in abrupt way (i.e., pH quickly increases from 2 to 9.2), resulting in significant pH gradient leading to the formation of lepidocrocite(γ- FeOOH) at pH 7−8 [44–47],then transformed into spinel iron oxide at higher pH. Moreover, the presence of oxygen in a reaction medium is a key factor in promoting the oxidation of Fe2+to Fe3+[48,49]. In our case, the produced nanoparticles under different synthesis conditions(O2/N2) show different particles shape. The surface structure passes from quasi- spherical in FO−CA sample to faceted for FO−NA sample. For the latter, the excess of O2
(air) creates higher Fe2+/Fe3+oxidation rate, results in transforming most of the Fe(OH)2
toγ-FeOOH then through a topotactic process transforms into magnetite [47,50]. This formation path way leads to irregularly shaped particles as observed in TEM image. In case of FO−CA sample, the synthesis under inert atmosphere lead to slow oxidation rate until the complete mixing of the solution (i.e., homogeneity in the pH of the solution) then direct transformation to magnetite involving the remaining Fe2+in solution resulting in more uniformed and spherical particles shape [51].
Appl. Sci. 2021, 11, x FOR PEER REVIEW 6 of 12
lepidocrocite(γ-FeOOH) at pH 7−8 [44–47],then transformed into spinel iron oxide at higher pH. Moreover, the presence of oxygen in a reaction medium is a key factor in pro- moting the oxidation of Fe2+ to Fe3+ [48,49]. In our case, the produced nanoparticles under different synthesis conditions(O2/N2) show different particles shape. The surface structure passes from quasi-spherical in FO−CA sample to faceted for FO−NA sample. For the lat- ter, the excess of O2 (air) creates higher Fe2+/Fe3+ oxidation rate, results in transforming most of the Fe(OH)2 to γ-FeOOH then through a topotactic process transforms into mag- netite [47,50]. This formation path way leads to irregularly shaped particles as observed in TEM image. In case of FO−CA sample, the synthesis under inert atmosphere lead to slow oxidation rate until the complete mixing of the solution (i.e., homogeneity in the pH of the solution) then direct transformation to magnetite involving the remaining Fe2+ in solution resulting in more uniformed and spherical particles shape [51].
Figure 3. Bright field TEM image of (a) FO−CA and (b) FO−NA showing the nanoparticle struc- ture of the samples. High resolution TEM image of (c) FO−CA and (d) FO−NA revealing the quasi−spherical and faceted shape of the particles synthesized in nitrogen or air reaction atmos- phere, respectively.
3.2. Magnetic Properties
The temperature dependence of magnetization has been recorded according to ZFC−FC protocols at low magnetic field. The measurement was carried out as follows:
first the sample was cooled down from room temperature to 5 K, then a static magnetic field of 2.5 mT was applied and MZFC was measured during the warming up of the sample.
Once the desired temperature (300 K) was reached, the applied magnetic field was main- tained, and MFC was measured during the cooling down to 5 K. ZFC−FC magnetization curves of FO−NA and FO−CA samples (Figure 4), indicate a typical behavior for an as- sembly of interacting single domain particles. The temperature corresponding to the max- imum in ZFC curve, Tmax, is directly proportional to the average blocking temperature, and it was equal for both samples within experimental error (Table 3). Moreover, an irre- versible magnetic behavior between ZFC and FC curves was observed ; the related tem- perature (Tirr) can be ascribed to the blocking temperature of the biggest particles [45] (Tirr was estimated from the difference between MFC and MZFC when it becomes lower than 3%). By decreasing the temperature, the FC curves present a plateau-like shape, indicating the presence of strong interparticle interactions as confirmed by the relatively high values of Tmax [52].
Figure 3. Bright field TEM image of (a) FO−CA and (b) FO−NA showing the nanoparticle structure of the samples. High resolution TEM image of (c) FO−CA and (d) FO−NA reveal- ing the quasi−spherical and faceted shape of the particles synthesized in nitrogen or air reaction atmosphere, respectively.
3.2. Magnetic Properties
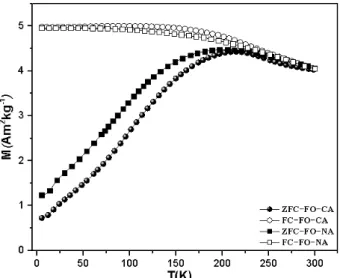
The temperature dependence of magnetization has been recorded according to ZFC−FC protocols at low magnetic field. The measurement was carried out as follows: first the sample was cooled down from room temperature to 5 K, then a static magnetic field of 2.5 mT was applied and MZFCwas measured during the warming up of the sample. Once the desired temperature (300 K) was reached, the applied magnetic field was maintained, and MFCwas measured during the cooling down to 5 K. ZFC−FC magnetization curves of FO−NA and FO−CA samples (Figure4), indicate a typical behavior for an assembly of interacting single domain particles. The temperature corresponding to the maximum in ZFC curve, Tmax, is directly proportional to the average blocking temperature, and it was equal for both samples within experimental error (Table3). Moreover, an irreversible magnetic behavior between ZFC and FC curves was observed; the related temperature (Tirr) can be ascribed to the blocking temperature of the biggest particles [45] (Tirr was
estimated from the difference between MFCand MZFCwhen it becomes lower than 3%).
By decreasing the temperature, the FC curves present a plateau-like shape, indicating the presence of strong interparticle interactions as confirmed by the relatively high values of Tmax[52].
Appl. Sci. 2021, 11, x FOR PEER REVIEW 7 of 12
Figure 4. ZFC (full circle/squares) and FC (empty circle/square) magnetization curves measured at 2.5 mT.
Figure 5a,b show the temperature dependence of thermoremanent magnetization (TRM) and its derivative. In the TRM protocol the sample was cooled down to 5 K in magnetic field of 2.5 mT, then the field was turned off and the remanent magnetization was measured during the warming.For non-interacting nanoparticles with uniaxial ani- sotropy, the derivative of MTRM is related to the anisotropy energy barrier distribution [35]:
f(∆E ) ∝ − dM
dT (6)
Due to the presence of interparticle interactions, the derivative of MTRM can only be considered as a rough estimation of the ∆Ea distribution. The blocking temperature can be defined as the temperature for which the relaxation time is equal to the measuring time of the experimental technique. In a real system of nanoparticles, where a finite size distri- bution always exists, TB is often defined as the temperature at which 50% of the particles overcome their anisotropy energy barriers. The obtained values of TB, Tmax and Tirr are equal within the experimental error confirming that no significant difference in magneti- zation dynamics is present between the two samples. The distribution of anisotropy en- ergy also shows a sharp peak at low temperature (i.e., TLow ~25 K), already observed in maghemite samples and can be ascribed to surface effects [9].
The phenomenological approach of Hansen and Mørup (H.M) has also been applied as a second estimation of the distribution of energy barriers in small particles from ZFC- FC magnetization curves using the equation [53]:
< T . . >= T [1.792 + 0.186ln(T T − 0.918)] − 1 + 0.0039T (7) Similarly to the previous results, samples also show equal TB values according to the H.M. approach (Table 3).
Figure 4.ZFC (full circle/squares) and FC (empty circle/square) magnetization curves measured at 2.5 mT.
Table 3.Temperature Corresponding to the Maximum in ZFC Curve (Tmax), Irreversibility Tempera- ture (Tirr), and Blocking Temperature (TB-TRM) From TRM measurement and the blocking temperature from Hansen and Mørup approach (TB.H.M) for FO−CA and FO−NA samples, uncertainties on the last digit are given in parentheses.
Sample Tmax(K) TB-TRM(K) Tirr(K) (3%) TB.H.M(k)
FO−CA 203(20) 104(10) 270(27) 125(12)
FO−NA 202(20) 100(10) 273(27) 124(12)
Figure5a,b show the temperature dependence of thermoremanent magnetization (TRM) and its derivative. In the TRM protocol the sample was cooled down to 5 K in magnetic field of 2.5 mT, then the field was turned off and the remanent magnetization was measured during the warming. For non-interacting nanoparticles with uniaxial anisotropy, the derivative of MTRMis related to the anisotropy energy barrier distribution [35]:
f(∆Ea)∝−dMTRM
dT (6)
Due to the presence of interparticle interactions, the derivative of MTRMcan only be considered as a rough estimation of the∆Eadistribution. The blocking temperature can be defined as the temperature for which the relaxation time is equal to the measuring time of the experimental technique. In a real system of nanoparticles, where a finite size distribution always exists, TB is often defined as the temperature at which 50% of the particles overcome their anisotropy energy barriers. The obtained values of TB, Tmaxand Tirrare equal within the experimental error confirming that no significant difference in magnetization dynamics is present between the two samples. The distribution of anisotropy energy also shows a sharp peak at low temperature (i.e., TLow~25 K), already observed in maghemite samples and can be ascribed to surface effects [9].
Appl. Sci.2021,11, 5433 8 of 12
Appl. Sci. 2021, 11, x FOR PEER REVIEW 8 of 12
(a) (b)
Figure 5. MTRM curve (full circles), measured after cooling at 2.5 mT and anisotropy energy barrier distribution (empty circles) for (a) FO−CA and (b) FO−NA samples.
Table 3. Temperature Corresponding to the Maximum in ZFC Curve (Tmax), Irreversibility Temper- ature (Tirr), and Blocking Temperature (TB−TRM) From TRM measurement and the blocking temper- ature from Hansen and Mørup approach (TB.H.M) for FO−CA and FO−NA samples, uncertainties on the last digit are given in parentheses.
Sample Tmax(K) TB-TRM (K) Tirr(K) (3%) TB.H.M (k)
FO−CA 203(20) 104(10) 270(27) 125(12)
FO−NA 202(20) 100(10) 273(27) 124(12)
The dependence of magnetization on an external magnetic field has been investi- gated at 300 K and 5 K. At 300 K, the results show superparamagnetic behavior for both samples (Figure 6a). Typically, for a material with superparamagnetic behavior, magnet- ization curves can also be used in order to extract the mean size of the magnetic core (Dm) (see supporting information for further details) using the Langevin function [54]. A small deviation of the fit from the experimental data has been observed, which can be related to the non-negligible interparticle interactions within the samples [55]. However, the value of Dm is in good agreement with experimental DTEM and DXRD. At 5 K (Figure 6b), the hys- teresis loops show low values of reduced remanence magnetization (Mr/Ms) and coercive field (HC) (Table 4) in agreement with that is reported in literature[9]. The obtained high Ms value (close to the bulk one Ms = 92 Am2Kg−1) indicates high crystallinity and magnetic ordering of the particles [56].
(a) (b)
Figure 6. Hysteresis loops recorded at (a) 300 K and at (b) at 5 K, Inset (b): details around zero field.
Figure 5.MTRMcurve (full circles), measured after cooling at 2.5 mT and anisotropy energy barrier distribution (empty circles) for (a) FO−CA and (b) FO−NA samples.
The phenomenological approach of Hansen and Mørup (H.M) has also been applied as a second estimation of the distribution of energy barriers in small particles from ZFC-FC magnetization curves using the equation [53]:
hTB.H.Mi=Tmax[1.792+0.186 ln(Tirr/Tmax−0.918)]−1+0.0039Tirr (7) Similarly to the previous results, samples also show equal TBvalues according to the H.M. approach (Table3).
The dependence of magnetization on an external magnetic field has been investigated at 300 K and 5 K. At 300 K, the results show superparamagnetic behavior for both samples (Figure6a). Typically, for a material with superparamagnetic behavior, magnetization curves can also be used in order to extract the mean size of the magnetic core (Dm) (see supporting information for further details) using the Langevin function [54]. A small deviation of the fit from the experimental data has been observed, which can be related to the non-negligible interparticle interactions within the samples [55]. However, the value of Dmis in good agreement with experimental DTEMand DXRD. At 5 K (Figure6b), the hysteresis loops show low values of reduced remanence magnetization (Mr/Ms) and coercive field (HC) (Table4) in agreement with that is reported in literature [9]. The obtained high Msvalue (close to the bulk one Ms = 92 Am2Kg−1) indicates high crystallinity and magnetic ordering of the particles [56].
Appl. Sci. 2021, 11, x FOR PEER REVIEW 8 of 12
(a) (b)
Figure 5. MTRM curve (full circles), measured after cooling at 2.5 mT and anisotropy energy barrier distribution (empty circles) for (a) FO−CA and (b) FO−NA samples.
Table 3. Temperature Corresponding to the Maximum in ZFC Curve (Tmax), Irreversibility Temper- ature (Tirr), and Blocking Temperature (TB−TRM) From TRM measurement and the blocking temper- ature from Hansen and Mørup approach (TB.H.M) for FO−CA and FO−NA samples, uncertainties on the last digit are given in parentheses.
Sample Tmax(K) TB-TRM (K) Tirr(K) (3%) TB.H.M (k)
FO−CA 203(20) 104(10) 270(27) 125(12)
FO−NA 202(20) 100(10) 273(27) 124(12)
The dependence of magnetization on an external magnetic field has been investi- gated at 300 K and 5 K. At 300 K, the results show superparamagnetic behavior for both samples (Figure 6a). Typically, for a material with superparamagnetic behavior, magnet- ization curves can also be used in order to extract the mean size of the magnetic core (Dm) (see supporting information for further details) using the Langevin function [54]. A small deviation of the fit from the experimental data has been observed, which can be related to the non-negligible interparticle interactions within the samples [55]. However, the value of Dm is in good agreement with experimental DTEM and DXRD. At 5 K (Figure 6b), the hys- teresis loops show low values of reduced remanence magnetization (Mr/Ms) and coercive field (HC) (Table 4) in agreement with that is reported in literature[9]. The obtained high Ms value (close to the bulk one Ms = 92 Am2Kg−1) indicates high crystallinity and magnetic ordering of the particles [56].
(a) (b)
Figure 6. Hysteresis loops recorded at (a) 300 K and at (b) at 5 K, Inset (b): details around zero field. Figure 6.Hysteresis loops recorded at (a) 300 K and at (b) at 5 K, Inset (b): details around zero field.
Table 4.Saturation magnetization (Ms) at 5 K and 300 K, reduced remanence magnetization (Mr/Ms) and coercive field (Hc) for FO−CA and FO−NA samples, uncertainties on the last digit are given in parentheses.
Sample Ms(Am2Kg−1) at 300 K
Ms(Am2Kg−1)
at 5 K Mr/Ms at 5 K Hc(mT)
FO−CA 70.9(7) 88(3) 0.25 28.7(3)
FO−NA 69.4(1) 77(3) 0.25 28.1(3)
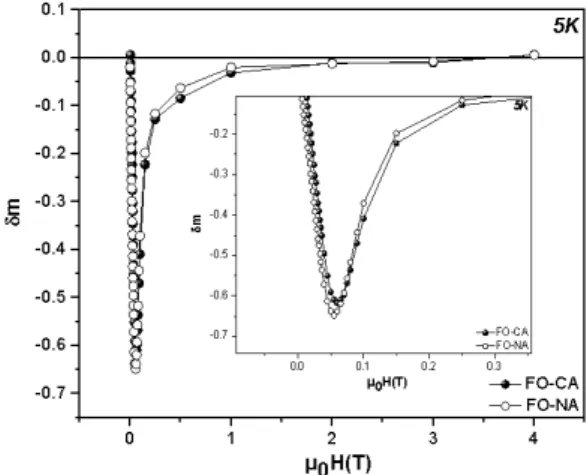
To evaluate the type and the strength of interparticle interactions,δm(H) plots at 5 K (Figure7) have been investigated using direct current demagnetization (DCD) and isothermal remnant magnetization (IRM) protocols (see supporting information for further details). Generally, a positive peak in theδm vs-µ0H curve is an indication of magnetizing interactions(e.g., exchange interactions) among nanoparticles while a negative peak sug- gests the existence of demagnetizing interactions (e.g., dipole-dipole interactions) [57].δm plots confirming the presence of strong dipolar interactions, with equal strength in both samples. Since no significant difference between the two samples can be detected in terms of magnetic measurements, this gives us more evidence that the reaction atmosphere does not affect the magnetic properties of FO−CA and FO−NA samples in our case.
Table 4. Saturation magnetization (Ms) at 5 K and 300 K, reduced remanence magnetization (Mr/Ms) and coercive field (Hc) for FO−CA and FO−NA samples, uncertainties on the last digit are given in parentheses.
Sample Ms (Am2Kg−1) at 300K Ms (Am2Kg−1) at 5 K Mr/Ms at 5 K Hc(mT)
FO−CA 70.9(7) 88(3) 0.25 28.7(3)
FO−NA 69.4(1) 77(3) 0.25 28.1(3)
To evaluate the type and the strength of interparticle interactions, δm(H) plots at 5 K (Figure 7) have been investigated using direct current demagnetization (DCD) and iso- thermal remnant magnetization (IRM) protocols (see supporting information for further details). Generally, a positive peak in the δm vs-µ0H curve is an indication of magnetizing interactions(e.g., exchange interactions) among nanoparticles while a negative peak sug- gests the existence of demagnetizing interactions (e.g., dipole-dipole interactions) [57]. δm plots confirming the presence of strong dipolar interactions, with equal strength in both samples. Since no significant difference between the two samples can be detected in terms of magnetic measurements, this gives us more evidence that the reaction atmosphere does not affect the magnetic properties of FO−CA and FO−NA samples in our case.
The more explanations could be found in Figure S1–S6, and Table S1.
Figure 7. δm plots for FO−CA and FO−NA samples.
4. Conclusions
The effect of atmosphere on the magnetic nanoparticles synthesized by the co-pre- cipitation chemical method was investigated using a multi-technique approach. XRD and TEM measurements indicate the high crystallinity of FO−CA and FO−NA nanoparticles.
However, TEM analysis highlights that the FO−CA sample shows more quasi-spherical particles, while FO−NA synthesized in air presents a relatively more residue of lepido- crocite in the final product. While no significant variation was observed for the magnetic properties (i.e., field and temperature dependence of magnetization, strength of interpar- ticle interactions) in our study. The magnetic response of the materials is compatible with the presence of highly crystalline particles (i.e., of the low magnetic disorder) which was also confirmed by the Mössbauer spectrometry through the absence of spin canting effect.
Supplementary Materials: The following are available online at www.mdpi.com/xxx/s1, Figure S1.
Selected area electron diffraction (SAED) patterns of FO−NA and FO−CA; Table S1. Summary of obtained values of hyperfine parameters (Isomer Shift, Quadrupolar Shift, Effective and Hyperfine fields, and weight) obtained at 77 K; Figure S2. Particle size distribution fitted with log-normal func- tion; Figure S3. Magnetic size distribution for FO-CA and FO-NA nanoparticles using Langevin function at 300 K; Figure S4. Remnant magnetization curves according to DCD and IRM protocols for (a) FO−CA and (b) FO−NA samples; Figure S5.57Fe Mössbauer spectra measured at 77 K for (a)
Figure 7.δm plots for FO−CA and FO−NA samples.
The more explanations could be found in Figures S1–S6, and Table S1.
4. Conclusions
The effect of atmosphere on the magnetic nanoparticles synthesized by the co- precipitation chemical method was investigated using a multi-technique approach. XRD and TEM measurements indicate the high crystallinity of FO−CA and FO−NA nanopar- ticles. However, TEM analysis highlights that the FO−CA sample shows more quasi- spherical particles, while FO−NA synthesized in air presents a relatively more residue of lepidocrocite in the final product. While no significant variation was observed for the magnetic properties (i.e., field and temperature dependence of magnetization, strength of interparticle interactions) in our study. The magnetic response of the materials is com- patible with the presence of highly crystalline particles (i.e., of the low magnetic disorder) which was also confirmed by the Mössbauer spectrometry through the absence of spin canting effect.
Supplementary Materials:The following are available online athttps://www.mdpi.com/article/10 .3390/app11125433/s1, Figure S1. Selected area electron diffraction (SAED) patterns of FO−NA and FO−CA; Table S1. Summary of obtained values of hyperfine parameters (Isomer Shift, Quadrupolar Shift, Effective and Hyperfine fields, and weight) obtained at 77 K; Figure S2. Particle size distribution
Appl. Sci.2021,11, 5433 10 of 12
fitted with log-normal function; Figure S3. Magnetic size distribution for FO-CA and FO-NA nanopar- ticles using Langevin function at 300 K; Figure S4. Remnant magnetization curves according to DCD and IRM protocols for (a) FO−CA and (b) FO−NA samples; Figure S5. 57Fe Mössbauer spectra measured at 77 K for (a) FO−CA and (b) FO−NA; the spectra are fitted with 2 sextets corresponding to A-site and B-site (fitted using a Lorentzian distribution); Figure S6. Linear Combination fit analysis of FO−CA nanoparticles.
Author Contributions:Conceptualization, D.P.; methodology, D.P., E.D., M.S.; validation, D.P. and E.D.; investigation, D.P.; data curation, S.S., C.M., M.A., N.Y. and G.B.; writing—Original draft preparation, S.S.; writing—Review and editing; S.S., C.M., M.A., A.T., J.P.M.M., G.B., N.Y., P.I., E.I., M.S., E.D. and D.P visualization, S.S.; supervision, D.P. and E.D; project administration, D.P.; funding acquisition, D.P. All authors have read and agreed to the published version of the manuscript.
Funding:This research received no external funding.
Institutional Review Board Statement:Not applicable.
Informed Consent Statement:Not applicable.
Acknowledgments:The results and the analysis collected in the present article are the result of many collaborations developed over the years.
Conflicts of Interest:The authors declare no conflict of interest.
References
1. Neuberger, T.; Schöpf, B.; Hofmann, H.; Hofmann, M.; Von Rechenberg, B. Superparamagnetic Nanoparticles for Biomedical Applications: Possibilities and Limitations of a New Drug Delivery System.J. Magn. Magn. Mater.2005,293, 483–496. [CrossRef]
2. Khandhar, A.P.; Ferguson, R.M.; Krishnan, K.M. Monodispersed Magnetite Nanoparticles Optimized for Magnetic Fluid Hyperthermia: Implications in Biological Systems.J. Appl. Phys.2011,109, 2011–2014. [CrossRef]
3. Scano, A.; Cabras, V.; Marongiu, F.; Peddis, D.; Pilloni, M.; Ennas, G. New Opportunities in the Preparation of Nanocomposites from Biomedical Applications: Revised Mechanosynthesis of Magnetite-Silica Nanocomposites. Mater. Res. Express2017,4, 025004. [CrossRef]
4. Hu, F.; Wei, L.; Zhou, Z.; Ran, Y.; Li, Z.; Gao, M. Preparation of Biocompatible Magnetite Nanocrystals for in Vivo Magnetic Resonance Detection of Cancer.Adv. Mater.2006,18, 2553–2556. [CrossRef]
5. Gazeau, F.; Lévy, M.; Wilhelm, C. Optimizing Magnetic Nanoparticle Design for Nanothermotherapy. Nanomedicine2008,3, 831–844. [CrossRef] [PubMed]
6. Arruebo, M.; Fernández-Pacheco, R.; Ibarra, M.R.; Santamaría, J. Magnetic nanoparticles for drug delivery.Nano Today2007,2, 22–32. [CrossRef]
7. Esakkimuthu, T.; Sivakumar, D.; Akila, S. Application of Nanoparticles in Wastewater Treatment. Pollut. Res. 2014, 33, 567–571. [CrossRef]
8. Bedanta, S.; Petracic, O.; Kleemann, W. Supermagnetism. InHandbook of Magnetic Materials; Elsevier: Amsterdam, The Nether- lands, 2015; Volume 23, pp. 1–83. [CrossRef]
9. Muscas, G.; Concas, G.; Cannas, C.; Musinu, A.; Ardu, A.; Orrù, F.; Fiorani, D.; Laureti, S.; Rinaldi, D.; Piccaluga, G.; et al.
Magnetic Properties of Small Magnetite Nanocrystals.J. Phys. Chem. C2013,117, 23378–23384. [CrossRef]
10. Mohapatra, M.; Anand, S. Synthesis and Applications of Nano-Structured Iron Oxides/Hydroxides—A Review.Int. J. Eng. Sci.
Technol.2011,2, 127–146. [CrossRef]
11. Kayani, Z.N.; Arshad, S.; Riaz, S.; Naseem, S. Synthesis of Iron Oxide Nanoparticles by Sol-Gel Technique and Their Characteriza- tion.IEEE Trans. Magn.2014,50, 1–4. [CrossRef]
12. Dixit, S.; Jeevanandam, P. Synthesis of Iron Oxide Nanoparticles by Thermal Decomposition Approach.Adv. Mater. Res.2009,67, 221–226. [CrossRef]
13. Unni, M.; Uhl, A.M.; Savliwala, S.; Savitzky, B.H.; Dhavalikar, R.; Garraud, N.; Arnold, D.P.; Kourkoutis, L.F.; Andrew, J.S.;
Rinaldi, C. Thermal Decomposition Synthesis of Iron Oxide Nanoparticles with Diminished Magnetic Dead Layer by Controlled Addition of Oxygen.ACS Nano2017,11, 2284–2303. [CrossRef]
14. Okoli, C.; Sanchez-Dominguez, M.; Boutonnet, M.; Järås, S.; Civera, C.; Solans, C.; Kuttuva, G.R. Comparison and Functionaliza- tion Study of Microemulsion-Prepared Magnetic Iron Oxide Nanoparticles.Langmuir2012,28, 8479–8485. [CrossRef] [PubMed]
15. Massart, R. Preparation of Aqueous Magnetic Liquids in Alkaline and Acidic Media. IEEE Trans. Magn. 1981, 17, 1247–1248. [CrossRef]
16. Petcharoen, K.; Sirivat, A. Synthesis and Characterization of Magnetite Nanoparticles via the Chemical Co-Precipitation Method.
Mater. Sci. Eng. B2012,177, 421–427. [CrossRef]
17. Lee, S.J.; Jeong, J.R.; Shin, S.C.; Kim, J.C.; Kim, J.D. Synthesis and Characterization of Superparamagnetic Maghemite Nanoparti- cles Prepared by Coprecipitation Technique.J. Magn. Magn. Mater.2004,282, 147–150. [CrossRef]
18. Kusigerski, V.; Illes, E.; Blanusa, J.; Gyergyek, S.; Boskovic, M.; Perovic, M.; Spasojevic, V. Magnetic Properties and Heating Efficacy of Magnesium Doped Magnetite Nanoparticles Obtained by Co-Precipitation Method.J. Magn. Magn. Mater.2019,475, 470–478. [CrossRef]
19. Roth, H.C.; Schwaminger, S.P.; Schindler, M.; Wagner, F.E.; Berensmeier, S. Influencing Factors in the CO-Precipitation Process of Superparamagnetic Iron Oxide Nano Particles: A Model Based Study.J. Magn. Magn. Mater.2015,377, 81–89. [CrossRef]
20. Pereira, C.; Pereira, A.M.; Fernandes, C.; Rocha, M.; Mendes, R.; Fernández-García, M.P.; Guedes, A.; Tavares, P.B.; Grenéche, J.M.;
Araújo, J.P.; et al. Superparamagnetic MFe2O4(M=Fe, Co, Mn) Nanoparticles: Tuning the Particle Size and Magnetic Properties through a Novel One-Step Coprecipitation Route.Chem. Mater.2012,24, 1496–1504. [CrossRef]
21. Dey, S.; Dey, S.K.; Majumder, S.; Poddar, A.; Dasgupta, P.; Banerjee, S.; Kumar, S. Superparamagnetic Behavior of Nanosized Co0.2Zn0.8Fe2O4Synthesized by a Flow Rate Controlled Chemical Coprecipitation Method.Phys. B Condens. Matter2014,448, 247–252. [CrossRef]
22. Amirabadizadeh, A.; Salighe, Z.; Sarhaddi, R.; Lotfollahi, Z. Synthesis of ferrofluids based on cobalt ferrite nanoparticles: Influence of reaction time on structural, morphological and magnetic properties.J. Magn. Magn. Mater.2017,434, 78–85. [CrossRef]
23. Talgatov, E.T.; Auyezkhanova, A.S.; Seitkalieva, K.S.; Tumabayev, N.Z.; Akhmetova, S.N.; Zharmagambetova, A.K. Co- Precipitation Synthesis of Mesoporous Maghemite for Catalysis Application.J. Porous Mater.2020,27, 919–927. [CrossRef]
24. Saragi, T.; Depi, B.L.; Butarbutar, S.; Permana, B. The Impact of Synthesis Temperature on Magnetite Nanoparticles Size Synthesized by Co-Precipitation Method.J. Phys. Conf. Ser.2018,1013, 012190. [CrossRef]
25. Beyaz, S.; Kockar, H.; Tanrisever, T. Simple Synthesis of Superparamagnetic Magnetite Nanoparticles and Ion Effect on Magnetic Fluids.J. Optoelectron. Adv. Mater. Symp.2009,1, 447–450.
26. Karaagac, O.; Kockar, H. A Simple Way to Obtain High Saturation Magnetization for Superparamagnetic Iron Oxide Nanoparticles Synthesized in Air Atmosphere: Optimization by Experimental Design.J. Magn. Magn. Mater.2016,409, 116–123. [CrossRef]
27. Klencsár, Z.; Ábrahám, A.; Szabó, L.; Szabó, E.G.; Stichleutner, S.; Kuzmann, E.; Homonnay, Z.; Tolnai, G. The Effect of Preparation Conditions on Magnetite Nanoparticles Obtained via Chemical Co-Precipitation. Mater. Chem. Phys. 2019,223, 122–132. [CrossRef]
28. Alp, E.; Aydogan, N. A Comparative Study: Synthesis of Superparamagnetic Iron Oxide Nanoparticles in Air and N2Atmosphere.
Colloids Surf. A Physicochem. Eng. Asp.2016,510, 205–212. [CrossRef]
29. Limpert, E.; Stahel, W.A.; Abbt, M. Log-Normal Distributions across the Sciences: Keys and Clues. Bioscience2001, 51, 341–352. [CrossRef]
30. Schneider, C.A.; Rasband, W.S.; Eliceiri, K.W. NIH Image to ImageJ: 25 Years of Image Analysis. Nat. Methods2012, 9, 671–675. [CrossRef]
31. Di Cicco, A.; Aquilanti, G.; Minicucci, M.; Principi, E.; Novello, N.; Cognigni, A.; Olivi, L. Novel XAFS Capabilities at ELETTRA Synchrotron Light Source.J. Phys. Conf. Ser.2009,190, 012043. [CrossRef]
32. Schiesaro, I.; Battocchio, C.; Venditti, I.; Prosposito, P.; Burratti, L.; Centomo, P.; Meneghini, C. Physica E: Low-Dimensional Systems and Nanostructures Structural Characterization of 3d Metal Adsorbed AgNPs.Phys. E Low-Dimens. Syst. Nanostruct.
2020,123, 114162. [CrossRef]
33. Ravel, B.; Newville, M. Athena, Artemis, Hephaestus: Data Analysis for X-Ray Absorption Spectroscopy Using IFEFFIT.J.
Synchrotron Radiat.2005,12, 537–541. [CrossRef]
34. Suryanarayana, C.; Norton, M.G. Practical Aspects of X-Ray Diffraction. InX-Ray Diffraction; Springer: Boston, MA, USA, 1998;
pp. 63–94. [CrossRef]
35. Tronc, E.; Prené, P.; Jolivet, J.P.; Dormann, J.L.; Grenèche, J.M. Spin Canting inγ-Fe2O3Nanoparticles.Hyperfine Interact.1998, 112, 97–100. [CrossRef]
36. Coey, J.M.D. Noncollinear Spin Arrangement in Ultrafine Ferrimagnetic Crystallites.Phys. Rev. Lett.1971,27, 1140–1142. [CrossRef]
37. Menil, F. Systematic Trends of the 57Fe Mössbauer Isomer Shifts in (FeOn) and (FeFn) Polyhedra. Evidence of a New Correlation between the Isomer Shift and the Inductive Effect of the Competing Bond T-X (→Fe) (Where X Is O or F and T Any Element with a Formal Posit.J. Phys. Chem. Solids1985,46, 763–789. [CrossRef]
38. Laurent, S.; Forge, D.; Port, M.; Roch, A.; Robic, C.; Vander Elst, L.; Muller, R.N. Magnetic Iron Oxide Nanoparticles: Synthesis, Stabilization, Vectorization, Physicochemical Characterizations and Biological Applications.Chem. Rev.2008,108, 2064–2110.
[CrossRef] [PubMed]
39. Muscas, G.; Singh, G.; Glomm, W.R.; Mathieu, R.; Kumar, P.A.; Concas, G.; Agostinelli, E.; Peddis, D. Tuning the Size and Shape of Oxide Nanoparticles by Controlling Oxygen Content in the Reaction Environment: Morphological Analysis by Aspect Maps.
Chem. Mater.2015,27, 1982–1990. [CrossRef]
40. Baumgartner, J.; Dey, A.; Bomans, P.H.; Le Coadou, C.; Fratzl, P.; Sommerdijk, N.A.; Faivre, D. Nucleation and Growth of Magnetite from Solution.Nat. Mater.2013,12, 310–314. [CrossRef]
41. Jolivet, J.P.; Cassaignon, S.; Chanéac, C.; Chiche, D.; Tronc, E. Design of Oxide Nanoparticles by Aqueous Chemistry.J. Sol-Gel Sci.
Technol.2008,46, 299–305. [CrossRef]
42. Lagrow, A.P.; Besenhard, M.O.; Hodzic, A.; Sergides, A.; Bogart, L.K.; Gavriilidis, A.; Thanh, N.T.K. Unravelling the Growth Mechanism of the Co-Precipitation of Iron Oxide Nanoparticles with the Aid of Synchrotron X-Ray Diffraction in Solution.
Nanoscale2019,11, 6620–6628. [CrossRef]
Appl. Sci.2021,11, 5433 12 of 12
43. Besenhard, M.O.; LaGrow, A.P.; Hodzic, A.; Kriechbaum, M.; Panariello, L.; Bais, G.; Loizou, K.; Damilos, S.; Margarida Cruz, M.;
Thanh, N.T.K.; et al. Co-Precipitation Synthesis of Stable Iron Oxide Nanoparticles with NaOH: New Insights and Continuous Production via Flow Chemistry.Chem. Eng. J.2020,399, 125740. [CrossRef]
44. Sudakar, C.; Subbanna, G.N.; Kutty, T.R.N. Effect of Anions on the Phase Stability ofγ-FeOOH Nanoparticles and the Magnetic Properties of Gamma-Ferric Oxide Derived from Lepidocrocite.J. Phys. Chem. Solids2003,64, 2337–2349. [CrossRef]
45. Del Bianco, L.; Fiorani, D.; Testa, A.M.; Bonetti, E.; Savini, L.; Signoretti, S. Magnetothermal Behavior of a Nanoscale Fe/Fe Oxide Granular System.Phys. Rev. B Condens. Matter Mater. Phys.2002,66, 1–11. [CrossRef]
46. Oosterhout, G.W. van. Morphology of Synthetic Sub-Microscopic Crystals ofαandγFeOOH and ofγFe2O3Prepared from FeOOH.Acta Crystallogr.1960,13, 932–935. [CrossRef]
47. Ahn, T.; Kim, J.H.; Yang, H.M.; Lee, J.W.; Kim, J.D. Formation Pathways of Magnetite Nanoparticles by Coprecipitation Method.J.
Phys. Chem. C2012,116, 6069–6076. [CrossRef]
48. Nedkov, I.; Merodiiska, T.; Slavov, L.; Vandenberghe, R.E.; Kusano, Y.; Takada, J. Surface Oxidation, Size and Shape of Nano-Sized Magnetite Obtained by Co-Precipitation.J. Magn. Magn. Mater.2006,300, 358–367. [CrossRef]
49. Nyir˝o -Kósa, I.; Csákberényi Nagy, D.; Pósfai, M. Size and Shape Control of Precipitated Magnetite Nanoparticles.Eur. J. Mineral.
2009,21, 293–302. [CrossRef]
50. Cudennec, Y.; Lecerf, A. Topotactic Transformations of Goethite and Lepidocrocite into Hematite and Maghemite.Solid State Sci.
2005,7, 520–529. [CrossRef]
51. Sugimoto, T.; Matijevi´c, E. Formation of Uniform Spherical Magnetite Particles by Crystallization from Ferrous Hydroxide Gels.J.
Colloid Interface Sci.1980,74, 227–243. [CrossRef]
52. Demortière, A.; Panissod, P.; Pichon, B.P.; Pourroy, G.; Guillon, D.; Donnio, B.; Bégin-Colin, S. Size-Dependent Properties of Magnetic Iron Oxide Nanocrystals.Nanoscale2011,3, 225–232. [CrossRef]
53. Hansen, M.F.; Mørup, S. Estimation of Blocking Temperatures from ZFC/FC Curves. J. Magn. Magn. Mater. 1999, 203, 214–216. [CrossRef]
54. El-Hilo, M. Nano-Particle Magnetism with a Dispersion of Particle Sizes.J. Appl. Phys.2012,112, 103915. [CrossRef]
55. Chantrell, R.W.; Popplewell, J.; Charles, S.W. The effect of a particle size distribution on the coercovity and remanence of a fine particle system.Physica B+C1977,86–88, 1421–1422. [CrossRef]
56. Niu, J.M.; Zheng, Z.G. Effect of Temperature on Fe3O4Magnetic Nanoparticles Prepared by Coprecipitation Method.Adv. Mater.
Res.2014,900, 172–176. [CrossRef]
57. O’Grady, K.; Chantrell, R.W. Remanence Curves of Fine Particles Systems I: Experimental Studies.Magn. Prop. Fine Part.1992, 93–102. [CrossRef]