Analysis of Hue Spectra During Storage of Pepper (Capsicum annuum)
László Baranyai1*, Dénes L. Dénes1, József Felföldi1
1Corvinus University of Budapest, Somlói u. 14-16., Budapest, 1118 Hungary
*Corresponding author. E-mail: laszlo.baranyai@uni-corvinus.hu
Abstract
Color information is widely used in non-destructive quality assessment of perishable horticultural produces. The presented work investigated color changes of pepper (Capsicum annuum L.) samples received from retail system. The effect of storage temperature (10±2°C and 24±4°C) on surface color and firmness was analyzed. Hue spectra was calculated using sum of saturations. A ColorLite sph850 (400-700nm) spectrophotometer was used as reference instrument. Dynamic firmness was measured on three locations of the surface: tip cap, middle and shoulder. Significant effects of storage conditions and surface location on both color and firmness were observed. Hue spectra responded sensitively to color development of pepper. Prediction model (PLS) was used to estimate dynamic firmess based on hue spectra. Accuracy was very different depending on the location. Firmness of the tip cap was predicted with the highest accuracy (RMSEP=0.0335). On the other hand, middle region cannot be used for such purpose. Due to the simplicity and rapid processing, analysis of hue spectra is a promising tool for evaluation of color in postharvest and food industry.
Key words: color, spectra, vision, pepper, firmness.
1. Introduction
Pepper (Capsicum annuum L.), or paprika, is very important horticultural produce in Hungary. Consumers are looking for vegetables with long shelf life, firm flesh, pungent taste and promising appearance. Carotenoid pigments of mexican varieties were analyzed using an absorbance detector adjusted to the visible wavelength of 450 nm (Collera-Zúniga et.al, 2005). Important differences were found in both color and carotenoids composition.
Carotenoid pigments were extracted from various sources and CIELAB a*, b* color parameters were measured by Meléndez-Martínez et.al (2007). Alteration in functional groups resulted in significant difference in color. Flavonoids, compounds important in antioxidant activity, were also analyzed using spectrophotometer at 515 nm (Ghasemnezhad et.al, 2011). Flavonoid concentration varied greatly among varieties at stages of full maturity and full ripeness. Chlorophyll fluorescence imaging was used to monitor changes in Chlorophyll activity of pepper during storage (Zsom et.al, 2010). It was found that storage temperature affected Chlorophyll activity and content the most. The optimal storage condition of 8°C and 90%RH was recommended (Guerra et.al, 2011) for CIELAB a* color improvement and minimal weight loss of 1-1.6% within 10 days. Dynamic quality assessment based on acoustic stiffness method was used to follow firmness changes of 5 sweet pepper varieties during storage at 20°C (Muha et.al, 2005). Significant softening was found, accelerated especially after 5 days of storage. During this experiment, total weight loss of 8-16% was observed, depending on the variety.
The objective of the presented work was to analyze color changes on the surface of pepper using hue and saturation data. It was also investigated whether hue spectra can be used to estimate fruit fimness.
2. Materials and methods 2.1. Materials
The total sum of 70 pieces of sweet pepper (Capsicum annuum L.) was received from retail and used in the experiment. The sample was randomly split into two equal groups. The first group was placed in a cooling chamber adjusted to 10°C and the temperature was controlled within ±2°C. The second group was stored on room temperature of 24±4°C in order to accelerate color development. Measurements were carried out during 12 days of the experiment, except weekends.
2.2. Vision system
The machine vision system was assembled from a 3CCD camera (Hitachi HV-C20), halogen lamps (20W, 12 pieces placed symmetrically around the object) and zoom lens (Canon TV).
Digital images of 768x576 pixel size were captured in uncompressed bitmap format with 24 bits color depth (8 bits/channel) and the optical resolution was adjusted to 0.268 mm/pixel.
Black background was used to facilitate automatic segmentation and object recognition.
Color standards of MOMCOLOR 88-06-00 (white), 88-06-02 (red), 88-06-10 (green) and 88- 06-13 (blue) were also captured each day to control color stability and make necessary corrections, if any.
C++ software was developed to compute the hue spectra of the images. The hue (H) and saturation (S) of each pixel were calculated based on RGB signals (Eq.1).
H=tan−12R−(G+B)
√
3(G−B) S=1−3min(R,G,B)
R+G+B (1)
Saturation values were collected into histogram according to the hue angle. As a result, unsaturated colors, such as black background are automatically removed by zero saturation and colors visible on the image appear as peaks. These peaks alter their location and size in response to color changes.
2.3. Spectrophotometer
Spectrophotometer (ColorLite sph850) was used to collect the spectra of 400-700 nm in 10 nm steps and measure color in various color spaces: XYZ, L*a*b*, L*uv and xy. The light source of D65 was used with 2° incident angle. Measurements were performed in three replicates on each pepper to minimize noise. Additionally, due to the small sampling area of spectrophotometers, three regions were used in measurements: tip cap, middle and shoulder.
2.4. Firmness measurement
Dynamic firmness was measured on the above mentioned locations of the surface: tip cap, middle and shoulder. Spherical impactor of 8 mm diameter, made of rubber, was used. Time to the first peak was measured and fimness (D=1/t2) was expressed.
2.5. Statistical analysis
The open source software of R (version 2.13.2, R Foundation for Statistical Computing, Vienna, Austria) was used to perform data preprocessing, statistical analysis, produce summary reports and charts.
3. Results and discussion 3.1. Color development
The surface color of pepper changed significantly during storage (Table 1). Color readings of RGB data and derived HSI attributes were primarily affected by storage time. The effect of
temperature appeared stronger in HSI color space than in RGB. Color changes were confirmed by reference instrument ColorLite sph850.
Table 1: ANOVA analysis of color attributes
Color attribute Time Temperature Interaction
RGB Red 254.60** 0.16 12.97**
RGB Green 410.63** 8.91* 61.76**
RGB Blue 396.67** 8.83* 44.53**
HSI Hue 208.52** 35.33** 89.22**
HSI Saturation 171.39** 59.76** 49.47**
HSI Intensity 374.06** 3.68+ 39.71**
Significance codes: ** p<0.001, * p<0.01, + p<0.1
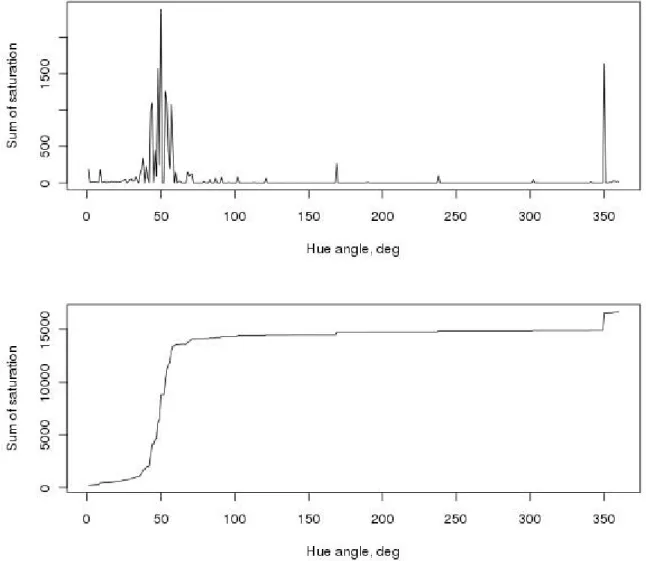
Typical hue spectra and its cumulative curve for pepper are shown in Figure 1. Peaks and steep changes around 50° indicate yellow color since they are between red (0°) and green (120°). According to the observed changes, optimal segment of 0-100° and 345-360° can be selected for statistical purposes. This is in agreement with the expected color development from green toward red.
Figure 1: Typical hue spectra (above) and its cumulative curve (below) for pepper
3.2. Dynamic firmness
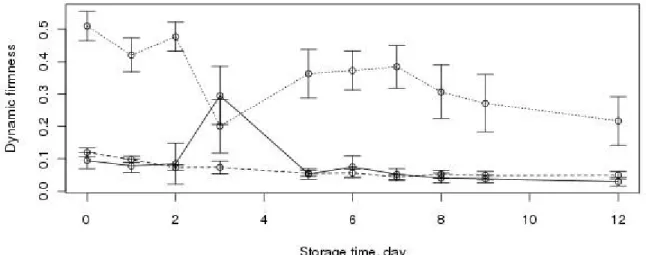
Besides color development, dynamic firmness was also observed to change significantly.
Additionally, firmness decay was found to depend on location of measurement (Fig.2).
Figure 2: Dynamic firmness changes during cool storage (–– tip cap, - - middle, ···· shoulder)
The internal structure of pepper and shrinkage of tissue might be the reason of the large differences between tip cap and shoulder. The effects contributing to dynamic firmness changes were investigated using ANOVA. Storage time was the most dominant factor (F=79.8) followed by interaction of time and location (F=17.6), and the main effect of storage temperature (F=9.9).
3.3. Firmness prediction
Partial Least Squares (PLS) regression model was used to predict dynamic firmness based on color information. Five latent variables were selected in each model. The optimal hue range of red-green was selected on the basis of observed standard deviation during the experiment. Table 2 presents prediction accuracy in terms of RMSEP. According to the lowest error values, tip cap might be the optimal location for firmness measurement. Its firmness readings can be in the closest agreement with visible surface color.
Table 2: Prediction accuracy (RMSEP) for firmness using PLS models
Temperature Tip cap Middle Shoulder
Sum of saturations
10°C 0.0335 0.1264 0.1806
24°C 0.0408 0.0971 0.1798
Cumulative data
10°C 0.0343 0.1270 0.1836
24°C 0.0423 0.1023 0.1970
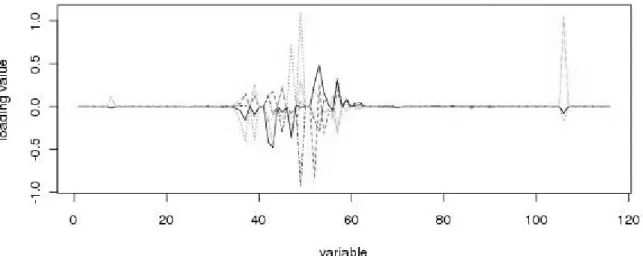
The loadings of the PLS model are presented in Figure 3. The high variance of coefficients of latent variables in the middle range indicate that quality assessment of sweet pepper may focus on colors near yellow (hue=60°).
Figure 3: Loadings of the PLS model
4. Conclusions
The surface color of pepper samples was investigated using hue spectra. Segmentation is not required in this case since pixels of low saturation automatically receive lower weight and peaks of important colors remain in this histogram. The statistical tool of PLS can be used for processing. Dynamic firmness was estimated using selected range of hue spectra. The best accuracy of RMSEP=0.0335 was obtained with tip cap. Hue spectra changed in accordance with color development of pepper. Presented technique of hue spectra analysis provides another tool for color evaluation in postharvest and food industry.
5. Acknowledgements
This work was supported by the New Széchenyi Plan projects TÁMOP-4.2.1/B-09/1 and TÁMOP-4.2.2/B-10.
6. Reference list
Collera-Zúniga, O., Jiménez, F.G. & Gordillo, R.M. (2005). Comparative study of carotenoid composition in three mexican varieties of Capsicum annuum L. Food Chemistry, 90, 109- 114.
Ghasemnezhad, M., Sherafati, M., & Payvast, G.A. (2011). Variation in phenolic compounds, ascorbic acid and antioxidant activity of five coloured bell pepper (Capsicum annum) fruits at two different harvest times. Journal of Functional Foods, 3, 44-49.
Guerra, M., Magdaleno, R., & Casquero, P.A. (2011). Effect of site and storage conditions on quality of industrial fresh pepper. Scientia Horticulturae, 130, 141-145.
Meléndez-Martínez, A.J., Britton, G., Vicario, I.M., & Heredia, F.J. (2007). Relationship between the colour and the chemical structure of carotenoid pigments. Food Chemistry, 101, 1145-1150.
Muha, V., Istella, S., & Tompos, D. (2005). Storability of paprika varieties measured by non- destructive acoustic method. International Journal of Horticultural Science, 11, 49-53.
Zsom, T., Zsom-Muha, V., Baranyai, L., Herppich, W.B., Felföldi, J., & Balla, Cs. (2010).
Non-destructive Determination of Post-harvest Ripening of Capsicum x annum ‘Kárpia’.
Proceedings of the Third International Conference Postharvest Unlimited 2008, Potsdam, 4-7 November, Acta Horticulturae (ISHS 2010), 858, 407-412.