Modeling Peer-to-Peer Connections over a Smartphone Network
Árpád Berta
University of Szeged Szeged, Hungary berta@inf.u-szeged.hu
Zoltán Szabó
University of Szeged Szeged, Hungary szaboz@inf.u-szeged.hu
Márk Jelasity
University of Szeged and MTA-SZTE Research Group on AI
Szeged, Hungary jelasity@inf.u-szeged.hu
Abstract
Smartphones offer a natural platform for building decen- tralized systems for the common good. A very important problem in such systems is understanding the limitations of building a peer-to-peer (P2P) overlay network, given that today’s networking infrastructure is designed with central- ized services in mind. We performed measurements over smartphones over several years and collected large amounts of data about, among other things, P2P connection success.
Here, we train models of P2P connection success using ma- chine learning based on several features that are observ- able by the devices. We argue that connection success is a non-trivial function of many such features. Besides this, the predictive models are also rather dynamic and a good model can perform rather badly if it is based on data that is more than a year old. The degree distribution of the P2P net- work based on this model has an interesting structure. We can identify two modes that roughly correspond to “very closed”, and “average” nodes, and a rather long tail that con- tains relatively open nodes. Our model allows us to perform realistic simulations of very large overlay networks, when combined with device measurement traces. This enables us to have a more informed design of decentralized applica- tions.
CCS Concepts:• Computer systems organization → Peer-to-peer architectures; • Computing methodolo- gies→Supervised learning by classification.
Keywords:peer-to-peer networks, modeling connections, smartphone trace
Permission to make digital or hard copies of all or part of this work for personal or classroom use is granted without fee provided that copies are not made or distributed for profit or commercial advantage and that copies bear this notice and the full citation on the first page. Copyrights for compo- nents of this work owned by others than ACM must be honored. Abstract- ing with credit is permitted. To copy otherwise, or republish, to post on servers or to redistribute to lists, requires prior specific permission and/or a fee. Request permissions from permissions@acm.org.
DICG’20, December 7–11, 2020, Delft, Netherlands
© 2020 Association for Computing Machinery.
ACM ISBN 978-1-4503-8197-0/20/12. . . $15.00 https://doi.org/10.1145/3428662.3428791
ACM Reference Format:
Árpád Berta, Zoltán Szabó, and Márk Jelasity. 2020. Modeling Peer- to-Peer Connections over a Smartphone Network. In1st Interna- tional Workshop on Distributed Infrastructure for Common Good (DICG’20), December 7–11, 2020, Delft, Netherlands. ACM, New York, NY, USA,6pages.https://doi.org/10.1145/3428662.3428791
1 Introduction
Over the past few decades, we have witnessed an explo- sive growth of mobile and smart devices. These devices are present in almost every aspect of our daily lives. This trend has led to the creation of numerous intelligent applications based on data mining [37] that, however, is usually per- formed at a central location based on the collected data. This conventional process has become evermore problematic due to the increasing public awareness of the privacy issue. In the last few years stricter privacy protection laws have come into force [1]. For this reason, there is an increasing inter- est in methods that allow us to keep our private data in our devices and process them using collaborative algorithms.
There are, of course, many ways to address this challenge [14,20]. One of the approaches is gossip learning [27] that is fully decentralized, hence no central server is needed.
Nodes exchange and aggregate models directly. This gives a good opportunity for startups or communities with low budgets to provide robust intelligent smartphone services.
Although we focus on collaborative mobile platforms [29], gossip learning applications can be found in smart meter- ing [32] and over Internet of Things platforms [35] as well.
In this domain, it is vital to fully understand the capa- bilities and limitations of the devices and their network ac- cess as well. Understanding such limitations could answer the question of what applications are feasible without cloud support, and what applications are of little use. We studied churn patterns previously based on traces we collected from mobile devices [34]. Here, we focus on modeling the proba- bility of building a P2P connection between mobile devices.
We propose and evaluate multiple predictive models to clas- sify pairs of nodes to see whether a P2P connection can be established between them. These models are built using ma- chine learning based on real measurement data. We then study the structure of the network, in which links are pre- dicted based on our model.
2 Related Works
In recent years, edge computing and ad hoc smartphone net- works have witnessed a renewed interest, but there have always been efforts to utilize such decentralized platforms for meaningful purposes. A key aspect of this research was to analyze the various attributes of the network connection and its constraints, such as NAT deployment. For instance, in 2016 a study was published highlighting the deployment rate of carrier-grade NATs [33] that hide entire networks behind a single IP address. A later paper by Livadariu et al.
[16] found that the deployment rate of carrier-grade NATs was growing rapidly.
The capabilities and behaviors of smartphone based net- works have also been studied [9,25,26]. One of the major problems is that the classic P2P algorithms were designed without energy efficiency in mind [4]. The energy efficiency on smartphone P2P networks is itself the subject of several ongoing research efforts [11, 23]. Qian et al., for example, developed the Device Analyzer crowd-sourcing project [31]
to predict energy consumption based on network access and the applications running on the device.
Besides energy efficiency, the other major challenge is building the P2P network itself. The most widely used ap- proach is based on a signaling server to share the con- nectivity information among the possible network nodes.
While several researchers employed a custom implementa- tion [15,36], one of the most popular tools is the WebRTC project [17]. Its efficiency, performance, and quality of ser- vice over mobile devices has been benchmarked and tested [5,12,19].
The possible applications of these serverless, autonomous smartphone networks cover a wide range from providing communication channels in disaster scenarios [8] to estab- lishing ad hoc mobile networks [21]. Even Google started registering various patents describing various aspects of a P2P smartphone network [7].
The novelty of our contribution lies in building ma- chine learning models for predicting P2P connection suc- cess. Such models can enable the simulation of potentially very large networks.
3 Data Collection Methodology
We developed and deployed an Android app that collects data covering most of the aspects that are relevant to the design of P2P protocols over networks of smartphones [34].
The collected data includes time series of network and bat- tery status, complete with information about NAT type, network type, network provider and WebRTC capabilities.
Most of these values can easily be queried from the Android operating system.
Real P2P connection measurements are also performed every time a measurement is made. They are based on the WebRTC protocol [2], with Firebase as a signaling server [22], and a STUN server [18]. Only direct connections are
built and measured; that is, the TURN protocol for relaying is not used. Every node that is online attempts in every 10 minutes to connect to a peer. (By online, we mean the node has a network access and it is on a charger.) To do this, the node sends a request to the Firebase server after collecting its own network data. The server attempts to find a random online peer and manages the information exchange using the Session Description Protocol (SDP) to help create a two- way P2P connection over UDP. If the two-way channel is successfully opened then a tiny data message is exchanged.
The channel is always closed at the end of the measurement.
One connection is allowed at a time and every addi- tional offer is rejected. The signaling server maintains an online membership list. Besides the P2P measurement, the WebRTC capabilities of a device are also tested. This is done by having the node try to open a connection with itself.
WebRTC test measurement results are completely indepen- dent from the signaling server.
The NAT type is detected with the help of the STUN pro- tocol using public STUN servers. We collect data only when the phone is on a charger. In an effort to save energy, back- ground processes are not supported in recent Android ver- sions, while the device is not on a charger.
4 Modeling connections
Here, we define a machine learning problem to model P2P connection success between two nodes. Our data set𝐷 = {(𝑥1, 𝑦1), . . . ,(𝑥𝑛, 𝑦𝑛)} contains𝑛 = 281,368 P2P connec- tion measurements. One example(𝑥, 𝑦)consists of a feature vector𝑥 ∈𝑅𝑑 that contains the features of two mobile de- vices, and a class label𝑦 ∈ {yes,no}that indicates the suc- cess of the observed connection attempt. That is, we have a binary classification problem. By a successful attempt we mean that a node connected successfully to its neighbor and a data message exchange was also performed via their direct channel.
There are 120,585 positive (successful) and 160,783 nega- tive (unsuccessful) examples. We only include those mea- surements where the signaling process was successful. A signaling error can occur if the server contacts a possible peer but the peer replies with a reject message, or it does not reply in time, or we cannot see proof in the trace that any peer was actually contacted. Note that a peer rejects a connection if it has an ongoing connection attempt of its own. All of these measurements are omitted from our mod- eling process because these errors are related to signaling and not to the establishing of an actual P2P connection.
The problem of classification is expressed as finding the parameters𝑤 of a function𝑓𝑤 : 𝑅𝑑 → {yes, no} that can correctly classify as many examples in𝐷as possible, as well as outside𝐷 (this latter property is called generalization).
Here,𝑓𝑤is called the model of the data set.
Table 1.Scenario A
Size Collected between Data set 281,368 01/2019 - 09/2020 Training set 258,862 01/2019 - 08/2020 Validation set 5,450 01/2019 - 08/2020 Test set 8,174 01/2019 - 08/2020
4.1 Features
Our data set contains many irrelevant features of the devices such as temperature of the battery, and so on. The nine fea- tures that we applied in the P2P connection prediction task are the following: time (only the hour value), Android ver- sion; wifi bandwidth or the mobile network type; whether on roaming (binary), NAT type, WebRTC test result (binary), country, and network service provider. The features of both of the devices are available that participated in a connection attempt. Since connection success is not always symmetric (sometimes node A can connect to node B but not vice versa) the order of the nodes is significant. Since the time is com- mon, we have 17 different features altogether for a connec- tion attempt. These features are all categorical or binary.
It is interesting to stress that here we treat the wifi band- width as a categorical feature, and not a continuous one.
However, when encoded as a continuous (ordinal) feature, the models had a somewhat worse performance. A possible explanation is that different reported bandwidth values may correlate with different router types.
4.2 Training Scenarios
For training a model, the labeled data set𝐷 must be split into three non-overlapping subsets; namely a training and a validation set for optimizing the parameters𝑤of the model and a test set for measuring the generalization performance of the optimized model. We created several such splits to test the sensitivity of the models to the time interval, as our data set covers almost two years.
Scenario A:.The measurements in the test set are from the same time interval as the training and the validation sets, as shown in Table1.
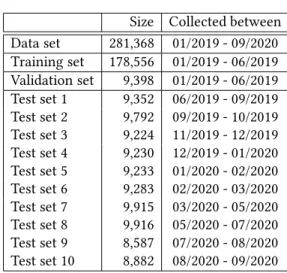
Scenario B:.We train on the first six months and then we evaluate the model in subsequent time intervals, as shown in Table2. Here, we can examine the sensitivity of the model to time, and we can test the prediction quality in the rela- tively distant future.
Scenario C:.We use the test sets as described in Scenario B, but we use a cumulative training set. That is, we first train on the first six months and test on the next time interval. We then add the previous test set to the training and validation sets, we train a new model over this extended set, and then we test on the following time interval. In this scenario, we
Table 2.Scenario B.
Size Collected between Data set 281,368 01/2019 - 09/2020 Training set 178,556 01/2019 - 06/2019 Validation set 9,398 01/2019 - 06/2019 Test set 1 9,352 06/2019 - 09/2019 Test set 2 9,792 09/2019 - 10/2019 Test set 3 9,224 11/2019 - 12/2019 Test set 4 9,230 12/2019 - 01/2020 Test set 5 9,233 01/2020 - 02/2020 Test set 6 9,283 02/2020 - 03/2020 Test set 7 9,915 03/2020 - 05/2020 Test set 8 9,916 05/2020 - 07/2020 Test set 9 8,587 07/2020 - 08/2020 Test set 10 8,882 08/2020 - 09/2020
can examine the prediction capabilities of the model regard- ing the immediate future.
4.3 Evaluation Metrics
We will use multiple metrics to measure the performance of the models including accuracy, precision and the𝐹1 score [30]. Precision (that is, the ratio of true positives and pre- dicted positives) is the most interesting metric for us, as we want to avoid false positives, which means we want high precision. In other words, we wish to create pessimistic mod- els that will not overestimate the possibilities for P2P con- nection. This allows for conservative predictions for P2P ap- plication success.
However, focusing only on precision is dangerous, be- cause a model that never predicts success also maximizes precision. So, we include more balanced measures as well such as accuracy and the𝐹1score that characterize the over- all performance for predicting both positive and negative examples.
4.4 Learning methods
We will present the evaluation results of two deep neu- ral networks [10] with different architectures. We used Keras [6] for implementing and evaluating these models.
Both neural networks were trained by ADAM [13] as the optimizer with a minibatch size of 128. In both networks, we use an input embedding layer. For this reason, we trans- form all the feature values of all the 17 features to a unique integer, thereby creating a vocabulary of size 976. The em- bedding layer learns a𝑘 dimensional embedding for each element of the vocabulary, thereby transforming our 17 fea- tures into a real vector of𝑘·17 elements. The embedding layer is trained as part of the whole deep network.
The first deep network will be called DNN-relu. Its embed- ding layer creates a𝑘 =100 dimensional dense embedding,
Table 3.Results in Scenario A.
Learning model Precision Accuracy 𝐹1score Ensemble Voting 0.8512 0.8812 0.8618 Random Forest 0.8474 0.8663 0.8415
DNN-relu 0.8482 0.8881 0.8612
DNN-tanh 0.8295 0.8776 0.8510
Random 0.4227 0.5074 0.4267
which is followed by 3 layers with 1000 fully connected neu- rons per layer. The activation function of the hidden layers is the ReLU function. To avoid overfitting, we used early stopping. The last layer is a single neuron with sigmoid ac- tivation.
The second network we call DNN-tanh. It is a much smaller model. Its embedding layer is𝑘 = 40 dimensional, and it has only one hidden fully connected layer with 350 neurons. In this hidden layer, we use hyperbolic tangent (tanh) as the activation function. It is fully connected, but we apply dropout during training to prevent overfitting. Dur- ing each training epoch, individual nodes are dropped out of the net with probability 0.5. The last layer is a single neu- ron with sigmoid activation.
Apart from the neural networks, we also used the ran- dom forest [3,28] model. Here, we first transformed all our 17 features to one-hot encoded vectors. Our model contains 1,500 decision trees. The allowed maximum depth is 85. The number of features to consider when looking for the best split is the logarithm of the total number of features.
Moreover, we also experimented with ensemble voting to combine the models above (DNN-relu, DNN-tanh and ran- dom forest).
We made the data set and the implementation of our mod- els publicly available athttps://github.com/arppy/p2pcm.
4.5 Results
Table3summarizes our results in Scenario A. As mentioned earlier, we are interested primarily in precision because avoiding false positives is rather important. In terms of pre- cision, ensemble voting showed the best performance. Re- garding accuracy and the𝐹1score, ensemble voting is very competitive as well. Therefore, in Section5we will apply ensemble voting to generate the simulated P2P connectiv- ity topologies.
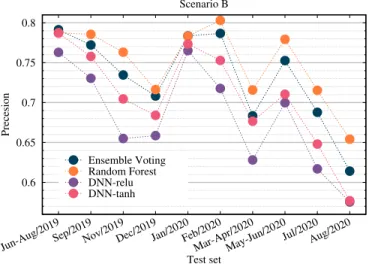
Next, we wanted to see whether our models generalize well over time. These results of Scenario B are shown in Fig- ure1. Here, random forest outperforms the other models on almost every test set. However, most of our models degrade in precision significantly after one and a half years.
This degradation is not due to the problem becoming harder. Indeed, we examined Scenario C (see Figure2) to see whether relatively fresh data helps improve performance.
Here, ensemble voting had the best precision on 5 test sets, random forest had the best performance on 4 test sets and
0.6 0.65 0.7 0.75 0.8
Jun-Aug/2019Sep/2019Nov/2019Dec/2019Jan/2020Feb/2020
Mar-Apr/2020May-Jun/2020
Jul/2020Aug/2020
Precesion
Test set Ensemble Voting
Random Forest DNN-relu DNN-tanh
Scenario B
Figure 1.The precision metric in Scenario B.
0.7 0.75 0.8 0.85
Jun-Aug/2019Sep/2019Nov/2019Dec/2019Jan/2020Feb/2020
Mar-Apr/2020May-Jun/2020
Jul/2020Aug/2020
Precesion
Test set Scenario C
Figure 2.The precision metric in Scenario C.
DNN-tanh won over 1 test set. Overall, the precision is fluc- tuating but it is markedly better than in Scenario B.
5 Properties of the P2P Topology
Using our ensemble voting model, here we simulate the structure of a P2P overlay network over a realistic trace of smartphones. We have traces of varying lengths har- vested from 3,825 different users. We divided these traces into one-day segments, resulting in 117,247 segments alto- gether. With the help of these segments, we can simulate a virtual period of up to one day by assigning a different, randomly selected segment to each simulated node. The net- work size is 100,000.
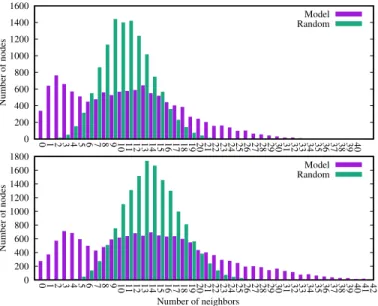
We build networks by first selecting a point in time dur- ing the simulated day, then nodes attempt to connect to some peers, and the success is predicted by ensemble vot- ing. We examine two different ways to determine the set of peers nodes try to connect to. The first one is calledFixed- 100, where every node has a fixed random list of 100 peers
0 200 400 600 800 1000 1200 1400 1600
0 1 2 3 4 5 6 7 8 9 10 11 12 13 14 15 16 17 18 19 20 21 22 23 24 25 26 27 28 29 30 31 32 33 34 35 36 37 38 39 40
Number of nodes
Model Random
0 200 400 600 800 1000 1200 1400 1600 1800
0 1 2 3 4 5 6 7 8 9 10 11 12 13 14 15 16 17 18 19 20 21 22 23 24 25 26 27 28 29 30 31 32 33 34 35 36 37 38 39 40 41 42
Number of nodes
Number of neighbors
Model Random
Figure 3.Fixed-100 scenario, top: at 12:00 (when the least nodes are online), bottom: at 21:00 (when the most nodes are online).
(these are not guaranteed to be online). Every node tries to connect to all its 100 candidates. The results are illustrated in Figure3. From the histograms, we can identify roughly two kinds of nodes based on the two modes: closed and open ones. We can also see a relatively long tail containing more open nodes.
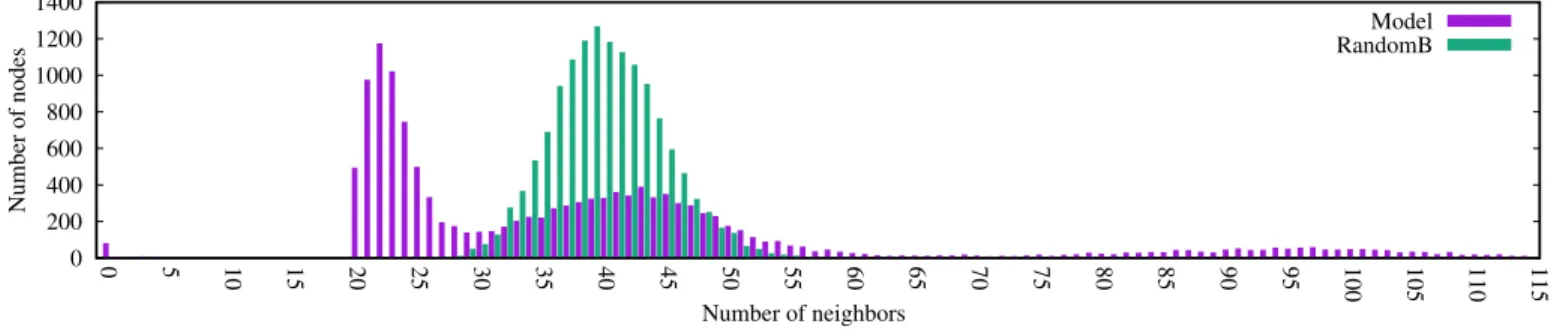
The second scenario is called Minimum-20. In this sce- nario, a node iterates over all the nodes in the network at random until it can connect to at least 20 neighbors, or un- til there are no more candidates. Note that the final degree of a node can be much larger than 20 because of potential incoming links. In this scenario, most of the nodes (with a few exceptions) manage to collect 20 connections, so the his- togram in Figure 4essentially illustrates the indegree (in- creased by 20). It is interesting that we can now see a third, although very flat, mode in the long tail, which corresponds to the very open nodes.
The histograms are clearly different from the random net- work that decides at random whether a connection succeeds or not. Table4shows a further comparison. The diameter of the P2P topology is close to that of the random network but its assortativity [24] (that is, the correlation between the node degrees of nodes connected by a link) is very different.
In the P2P network, assortativity is strongly negative, that is, high degree nodes are connected to low degree nodes.
6 Conclusions
We created predictive models of P2P connection success us- ing machine learning, based on a collected trace of more than 100,000 actual connection attempts. In decentralized application development, models such as those presented
Table 4.Properties of examined networks. d: diameter; r:
assortativity coefficient
Fixed-100 Minimum-20
# model random model random
hour online d r d r d r d r
00:00 13550 7 -0.37 7 -0.01 5 -0.50 4 -0.01 03:00 13323 7 -0.37 7 0.00 5 -0.49 4 -0.01 06:00 13441 7 -0.36 7 0.00 5 -0.50 4 -0.01 09:00 12622 8 -0.35 7 0.00 5 -0.50 4 -0.01 12:00 11792 7 -0.31 7 0.00 5 -0.48 4 -0.01 15:00 13839 7 -0.28 6 0.00 5 -0.46 4 -0.01 18:00 15323 7 -0.29 6 0.00 5 -0.45 4 -0.01 21:00 15137 7 -0.32 6 0.00 5 -0.47 4 -0.01
here play an important role, because they allow for a re- alistic simulation. We demonstrated that the model works well when it is trained on fresh data but predictions can quickly become outdated. This means connectivity is a dy- namic, highly non-trivial property, something that goes well beyond simply considering NAT types. The P2P overlay net- works that are simulated based on this model reflect a cate- gorization of the nodes into roughly three groups according to openness.
Acknowledgments
This work was supported by the Hungarian Government and the European Regional Development Fund under the grant number GINOP-2.3.2-15-2016-00037 (“Internet of Liv- ing Things”) and by grant TUDFO/47138-1/2019-ITM of the Ministry for Innovation and Technology, Hungary
References
[1] [n.d.]. European Commission: General data protection regulation (GDPR). 2018. https://ec.europa.eu/commission/priorities/justice- and-fundamental-rights/data-protection/2018-reform-eu-data- protection-rules.
[2] [n.d.]. WebRTC 1.0: Real-Time Communication Between Browsers.
2018. https://www.w3.org/TR/webrtc/
[3] Leo Breiman. 2001. Random forests. Machine learning45, 1 (2001), 5–32.
[4] S. Brienza, S. E. Cebeci, S. S. Masoumzadeh, H. Hlavacs, Ö. Özkasap, and G. Anastasi. 2015. A survey on energy efficiency in P2P systems:
File distribution, content streaming, and epidemics.ACM Computing Surveys (CSUR)48, 3 (2015), 1–37.
[5] Giuliana Carullo, Marco Tambasco, Mario Di Mauro, and Maurizio Longo. 2016. A performance evaluation of WebRTC over LTE. In2016 12th Annual Conference on Wireless On-demand Network Systems and Services (WONS). IEEE, 1–6.
[6] François Chollet et al. 2015. Keras. https://keras.io
[7] John M Cohn, Peter G Finn, Sumabala P Nair, Sanjay B Panikkar, and Veena S Pureswaran. 2019. Autonomous decentralized peer-to-peer telemetry. US Patent 10,257,270.
[8] M. Di Felice, L. Bedogni, A. Trotta, L. Bononi, F. Panzieri, G. Ruggeri, G. Aloi, V. Loscrì, and P. Pace. 2013. Smartphones like stem cells:
Cooperation and evolution for emergency communication in post- disaster scenarios. In2013 First International Black Sea Conference on Communications and Networking (BlackSeaCom). 28–33.
0 200 400 600 800 1000 1200 1400
0 5 10 15 20 25 30 35 40 45 50 55 60 65 70 75 80 85 90 95 100 105 110 115
Number of nodes
Number of neighbors
Model RandomB
Figure 4.Minimum-20 scenario, at 15:00 (all hours are similar).
[9] Michael Dinitz, Magnús M Halldórsson, Calvin Newport, and Alex Weaver. 2019. The Capacity of Smartphone Peer-To-Peer Networks.
arXiv preprint arXiv:1908.01894(2019).
[10] Ian Goodfellow, Yoshua Bengio, and Aaron Courville. 2016. Deep Learning. MIT Press. http://www.deeplearningbook.org
[11] Erkki Harjula, Timo Ojala, and Mika Ylianttila. 2017. Energy-efficient peer-to-peer networking for constrained-capacity mobile environ- ments. In2017 IFIP/IEEE Symposium on Integrated Network and Service Management (IM). IEEE, 858–864.
[12] Arto Heikkinen, Timo Koskela, and Mika Ylianttila. 2015. Perfor- mance evaluation of distributed data delivery on mobile devices using WebRTC. In2015 International Wireless Communications and Mobile Computing Conference (IWCMC). IEEE, 1036–1042.
[13] Diederik P. Kingma and Jimmy Ba. 2015. Adam: A Method for Sto- chastic Optimization. In3rd International Conference on Learning Rep- resentations, ICLR 2015, San Diego, CA, USA, May 7-9, 2015, Conference Track Proceedings, Yoshua Bengio and Yann LeCun (Eds.).
[14] Jakub Konecný, H. Brendan McMahan, Felix X. Yu, Peter Richtárik, Ananda Theertha Suresh, and Dave Bacon. 2016. Federated Learning:
Strategies for Improving Communication Efficiency. InPrivate Multi- Party Machine Learning (NIPS 2016 Workshop).
[15] S. Kosta, V. C. Perta, J. Stefa, P. Hui, and A. Mei. 2013. Clone2clone (c2c): Peer-to-peer networking of smartphones on the cloud. In5th USENIX Workshop on Hot Topics in Cloud Computing (HotCloud 13).
[16] Ioana Livadariu, Karyn Benson, Ahmed Elmokashfi, Amogh Dhamd- here, and Alberto Dainotti. 2018. Inferring carrier-grade NAT deploy- ment in the wild. InIEEE INFOCOM 2018-IEEE Conference on Computer Communications. IEEE, 2249–2257.
[17] S. Loreto and S. P. Romano. 2014. Real-time communication with WebRTC: peer-to-peer in the browser. " O’Reilly Media, Inc.".
[18] D. C. MacDonald and B. Lowekamp. 2010. NAT behavior discovery using session traversal utilities for NAT (STUN). No. RFC 5780.
[19] A. Marechal, E. Janczukowicz, and IMT Oln. 2016. TURN Servers Impacts Over WebRTC QoE in 4G Network. In19th International ICIN Conference-Innovations in Clouds, Internet and Networks. 53–58.
[20] Brendan McMahan, Eider Moore, Daniel Ramage, Seth Hampson, and Blaise Aguera y Arcas. 2017. Communication-Efficient Learning of Deep Networks from Decentralized Data. InProceedings of the 20th International Conference on Artificial Intelligence and Statistics (Pro- ceedings of Machine Learning Research, Vol. 54), Aarti Singh and Jerry Zhu (Eds.). PMLR, Fort Lauderdale, FL, USA, 1273–1282.
[21] Pramita Mitra and Christian Poellabauer. 2012. Emergency response in smartphone-based mobile ad-hoc networks. In2012 IEEE Interna- tional Conference on Communications (ICC). IEEE, 6091–6095.
[22] Laurence Moroney. 2017.Firebase Cloud Messaging. Apress, Berkeley, CA, USA, 163–188.
[23] Sayed Muchallil, Maulisa Oktiana, et al. 2015. Energy efficiency of mo- bile peer-to-peer network based on channel condition and bandwidth.
In2015 International Electronics Symposium (IES). IEEE, 157–162.
[24] M. E. J. Newman. 2002. Assortative Mixing in Networks. Physical Review Letters89, 20 (Oct. 2002), 208701.
[25] Calvin Newport. 2017. Leader election in a smartphone peer-to-peer network. In2017 IEEE International Parallel and Distributed Processing Symposium (IPDPS). IEEE, 172–181.
[26] C. Newport and A Weaver. 2019. Random Gossip Processes in Smart- phone Peer-to-Peer Networks. In2019 15th International Conference on Distributed Computing in Sensor Systems (DCOSS). IEEE, 139–146.
[27] Róbert Ormándi, István Hegedűs, and Márk Jelasity. 2013. Gossip Learning with Linear Models on Fully Distributed Data.Concurrency and Computation: Practice and Experience25, 4 (2013), 556–571.
[28] F. Pedregosa, G. Varoquaux, A. Gramfort, V. Michel, B. Thirion, O.
Grisel, M. Blondel, P. Prettenhofer, R. Weiss, V. Dubourg, J. Vander- plas, A. Passos, D. Cournapeau, M. Brucher, M. Perrot, and E. Duch- esnay. 2011. Scikit-learn: Machine Learning in Python. Journal of Machine Learning Research12 (2011), 2825–2830.
[29] Alex (Sandy) Pentland. 2012. Society’s Nervous System: Building Ef- fective Government, Energy, and Public Health Systems. Computer 45, 1 (January 2012), 31–38.
[30] David Powers and Ailab. 2011. Evaluation: From precision, recall and F-measure to ROC, informedness, markedness and correlation.J.
Mach. Learn. Technol2 (01 2011), 2229–3981.
[31] Weizhu Qian and Franck Gechter. 2018. Modeling Smartphone En- ergy Consumption Based on User Behavior Data. In2018 International Conference on Computational Science and Computational Intelligence (CSCI). IEEE, 788–793.
[32] Alfredo Rial and George Danezis. 2011. Privacy-preserving smart me- tering. InProceedings of the 10th annual ACM workshop on Privacy in the electronic society (WPES’11). ACM, New York, NY, USA, 49–60.
[33] P. Richter, F. Wohlfart, N. Vallina-Rodriguez, M. Allman, R. Bush, A.
Feldmann, C. Kreibich, N. Weaver, and V. Paxson. 2016. A multi- perspective analysis of carrier-grade NAT deployment. InProceedings of the 2016 Internet Measurement Conference. 215–229.
[34] Z. Szabó, Á. Berta, K. Téglás, M. Jelasity, and V. Bilicki. 2019. Stunner:
A Smart Phone Trace for Developing Decentralized Edge Systems. In Proceedings of the 19th IFIP International Conference on Distributed Ap- plications and Interoperable Systems (DAIS 2019)(Copenhagen, Den- mark)(Lecture Notes in Computer Science, Vol. 11534), J. Pereira and L. Ricci (Eds.). Springer International Publishing, 108–115.
[35] Chun-Wei Tsai, Chin-Feng Lai, Ming-Chao Chiang, and L.T. Yang.
2014. Data Mining for Internet of Things: A Survey.Communications Surveys Tutorials, IEEE16, 1 (2014), 77–97.
[36] Piotr K Tysowski, Pengxiang Zhao, and Kshirasagar Naik. 2011. Peer to peer content sharing on ad hoc networks of smartphones. In 2011 7th International Wireless Communications and Mobile Comput- ing Conference. IEEE, 1445–1450.
[37] Ji Wang, Bokai Cao, Philip S. Yu, Lichao Sun, Weidong Bao, and Xi- aomin Zhu. 2018. Deep Learning towards Mobile Applications. In Proceedings of the IEEE 38th International Conference on Distributed Computing Systems (ICDCS 2018). IEEE, Vienna, Austria, 1385–1393.