WHAT IS THE BEST WAY TO TAKE INTERNET USAGE INTO CONSIDERATION IN THE DIFFERENT
VARIANTS OF THE ACTIVE AGEING INDEX?
1ÉVA BERDE1 – IZABELLA KUNCZ2
1Department of Microeconomics, Corvinus University of Budapest, Hungary Email: eva.berde@uni-corvinus.hu
2Department of Macroeconomics, Corvinus University of Budapest, Hungary Email: izabella.kuncz@uni-corvinus.hu
The paper provides a brief description of the Active Ageing Index (AAI). This indicator, intro- duced in 2012, aims to measure the potential of older people for active and healthy ageing. The indicator is constructed from European Union survey data, and these results are weighted with coeffi cients determined by experts. One of the variables from the surveys measures the proportion of older people using the internet at least once a week. We argue that such regular internet usage does not show too much variation in this era of the ubiquitous internet, so a more sophisticated defi nition of internet usage must be taken into consideration. Our discussion contains three different AAI variants: the original expert-based, the Djurovic et al. (2017) I-distance indicator, and our factor-based index.
Keywords: active ageing, composite index, mathematical-statistical methods, digital divide JEL codes: J14
1 This paper has been supported by the European Union and Hungary and co-financed by the European Social Fund through the project EFOP-3.6.2-16-2017-00017, titled “Sustainable, intelligent and inclusive regional and city models.” We thank the participants of the “Innova- tion, Integration and Mobility” conference held at Székesfehérvár on 28 March 2018 for their comments.
1. INTRODUCTION
Ageing populations have become an important issue, especially in developed countries. In the EU-28, 59.8% of the population was 20 to 64 years old in 2017.
This is expected to drop below 55% by 2035 and remain there until at least 2080.
In 2017, 19.4% of the population was 65 years old or older, but by 2080 this is expected to rise to 29.1% (Eurostat 2018). As the population ages, issues such as the welfare and quality of life of older citizens have come to the fore, as well as surveys focusing on their financial state and satisfaction levels (Bandura 2008;
Yang 2014). There are several numerical indices to measure the welfare of older adults. In the EU, the most frequently used one is the Active Ageing Index, here- inafter referred to as AAI (Zaidi et al. 2013).
The index was created at the initiative of the United Nations Economic Com- mission for Europe (UNECE) and the European Commission Directorate General for Employment, Social Affairs and Inclusion (Zaidi et al. 2013) in 2012, the Eu- ropean Year for Active Ageing and Solidarity between Generations. Since then, it has been calculated and published every two years, each time evaluating data collected two years previously (e.g. AAI 2012 is about the year 2010). Presently, the indices available are those from 2010, 2012, 2014, 2016 and estimated values for 2018, covering the period from 2008 to 2016 (UNECE 2018).
The AAI is calculated as a weighted average of several different compo- nents, where the weights applied were based on the recommendations of experts.
Changes in AAI values can be used to describe the development of countries over time, and to analyze country rankings. The index values show how much of the potential for active ageing is realized in given countries. AAI can also be useful to policymakers when evaluating the efficacy of policies related to ageing. Although the index has faced much criticism, practical experience suggests that it serves its intended purpose quite well inasmuch as it reflects the effectiveness of policies.
It also draws attention to areas where additional measures are needed. However, economic development obviously results in the emergence of new trends that affect the conditions of the older generation. Our paper focuses on one of these factors, namely the role of internet usage at an older age. We argue that the cur- rent indicator for this factor should be replaced by one that qualitatively measures internet usage rather than indicating regular internet usage.
The outline of this paper is as follows. The second section gives an overview of the components and structure of the AAI. In the third section we describe two variations made to the AAI where the weighting system of the components is based on mathematical-statistical estimates. The first of these variations was introduced by Djurovic et al. (2017) using the Composite I-distance Indicator (CIDI) method. The second one is our own experimental creation, based on factor
analysis. In the fourth section of the paper we focus on internet usage and show that it will soon become so ubiquitous that merely measuring regular usage will no longer yield any useful information. Therefore, we argue for the measurement of a more sophisticated, that is qualitative measure of internet usage instead. The fifth section shows the difference this would make for each of the AAI variations and their country rankings. Finally, we conclude by summarizing our findings.
2. THE ACTIVE AGEING INDEX
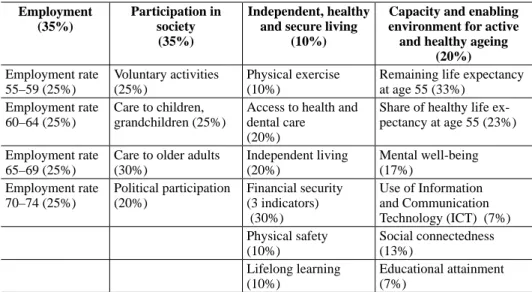
The Active Ageing Index (AAI) is a complex index containing 4 domains and 22 indicators, which, as we have mentioned earlier, has been calculated regularly since 2012 by a group of experts working for the UNECE (Zaidi et al. 2013). The main goal for using AAI is to measure the effectiveness of economic policies that respond to ageing. AAI also shows the efficacy by which the economic and social potential of ageing is realized. The four major domains of AAI and the indicators within each domain are shown in Table 1.
The first three domains of the AAI relate to the results achieved in active age- ing, including participation in paid and unpaid activities, as well as physical, social and financial security. These domains were included in the AAI on the rec- ommendation of the World Health Organization (WHO 2002). Finally, the fourth
Table 1. The four domains of AAI, the indicators of each domain, and the weight function of each indicator within the respective domain
Employment (35%)
Participation in society
(35%)
Independent, healthy and secure living
(10%)
Capacity and enabling environment for active
and healthy ageing (20%) Employment rate
55–59 (25%)
Voluntary activities (25%)
Physical exercise (10%)
Remaining life expectancy at age 55 (33%)
Employment rate 60–64 (25%)
Care to children, grandchildren (25%)
Access to health and dental care
(20%)
Share of healthy life ex- pectancy at age 55 (23%) Employment rate
65–69 (25%)
Care to older adults (30%)
Independent living (20%)
Mental well-being (17%)
Employment rate 70–74 (25%)
Political participation (20%)
Financial security (3 indicators) (30%)
Use of Information and Communication Technology (ICT) (7%) Physical safety
(10%)
Social connectedness (13%)
Lifelong learning (10%)
Educational attainment (7%)
Source: Zaidi et al. (2013).
domain considers the extent to which the environment enables active ageing, and the level of effort people aged over 55 make to improve their quality of life.
The data used for calculating the AAI originates from European Union sur- veys.2 When calculating the AAI, responses to subjective questions as well as quantitative data (e.g. employment rate) were placed on a 0–100 scale. As a re- sult, all domains and indicators of the AAI appear as percentage data, enabling re- searchers to make comparisons between countries and analyze the active ageing- related trends of any EU nation. The closer an indicator is to 100 for any given year, the better the annual state of the country examined. Since the AAI also of- fers breakdowns by gender for each indicator, it is possible to make male–female comparative analyses.
The weighting coefficients given to domain-specific indicators as well as the weights given to domains were determined by the UNECE Active Ageing Expert Group. Although originally all the indicators were to be given the same weighting coefficients (Zaidi et al. 2013), in the end due to scientific concerns they gained the weights indicated in Table 1 (in brackets under the names of the indicators and domains).
A frequent criticism of composite indices that use weights given by expert opinion is that mathematical-statistical aspects are neglected. Such a critical ap- proach is expressed in Paruolo et al. (2013), and specifically with respect to the AAI in São José et al. (2017). We tend to agree with these criticisms, especially in cases where the authors recommend better definitions of domains and greater consideration of correlations. However, our views are even more in line with the one presented in Kelley (1991), which is that though such composite indices have to be regarded with some wariness, they contain valuable information that other single domain indices cannot convey.
On the other hand, indices calculated using mathematical-statistical methods are criticized because the weights are sensitive to changes in the data, thus they could shift in every time period. Therefore, this type of index is not as well suited to making intertemporal comparisons. However, at any given time, they can pro- duce a more exact country ranking and provide better guidance to policymakers, since bigger weights are given to indicators which are currently deemed more important with respect to active aging.
The critique presented in this article is that the degree to which certain fac- tors contribute to active ageing changes over time. Therefore, factors need to be
2 The specific datasets and surveys used include the following: EU-LFS (Labour Force Survey), EU-SILC (Statistics on Income and Living Conditions), EQLS (European Quality of Life Survey), EHLEIS (European Health and Life Expectancy Information Systems), Eurostat ICT Survey (Information and Communications Technology), and ESS (European Social Survey).
periodically reconsidered and, if necessary, altered, especially if the values of the indicator under consideration differ less and less between individual countries.
This is also true if the weights are calculated using statistical methods instead of relying on expert opinion. In the following section we introduce two different mathematical-statistical methods to derive AAI variants.
3. DIFFERENT AAI CALCULATIONS USING STATISTICAL METHODS
In the previous section we introduced the conventional AAI based on expert esti- mates. Now we introduce two AAI variants where the weighting coefficients are calculated using mathematical-statistical methods. The first one is the indicator of Djurovic et al. (2017), who uses a statistical estimate known as the Composite I-distance Indicator method (CIDI).3
The second calculation is our variant, created by factor analysis, hereinafter referred to as factor-based AAI. In this article we will not take a stance in the debate whether the AAI should be based on expert estimates or mathematical- statistical tools. We merely wish to demonstrate that one of the important AAI indicators, internet usage, should be adjusted according to changing economic circumstances. We will show this after our introduction of the AAI variants based on statistical methods.
A component of AAI, the Use of Information and Communication Technology (ICT) indicator measures the internet usage of older people. Specifically, it shows the ratio of 55- to 74-year-olds who in the previous three months had used the in- ternet at least once a week. The data is from an annual Eurostat survey, collected by national statistical offices on the use of Information and Communication Tech- nologies at the European level.
The CIDI method of Djurovic et al. (2017) used Pearson correlation coef- ficients to determine the weighting system instead of subjective weights based on expert estimates. The gist of the method is that these correlation coefficients can be calculated by the I-distance values and the indicators used in the analysis.
Pearson correlations show which indicators are the most significant in the coun- try ranking process, and finally the most important ones get higher weights. For example, in the original index the same weight was given to the employment rate of all age groups, while the calculations of Djurovic et al. (2017) assign a larger weight to the 65- to 69-year-olds than to 60- to 64-year-olds, and a larger weight to the 60- to 64-year-olds than to 55- to 59-year-olds. The usual retirement age
3 For a description of the Composite I-distance Indicator method see Ivanovic (1973), Jeremic et al. (2011), and Dobrota et al. (2016).
in the EU is 65, so the employment rate is more likely to be higher among those under 65 than it is for those over 65. The weights calculated using the composite I-distance indicator show that the real challenge with respect to active ageing is to improve the employment rate of 65- to 69-year-olds. However, in Djurovic et al. (2017) the employment rate of 70- to 74-year-olds got a lower weight than the rate for 60- to 64-year-olds. The explanation for this is that the employment rate of 70- to 74-year-olds is extremely low, thus the role of the indicator is also negligible. We used the weighting system of Djurovic et al. (2017) to calculate the 2018 AAI (based on 2016 data).
As an experiment we also created a weighting system using a different statisti- cal method with the 2016 data (AAI 2018 is calculated from the data of the year 2016). Our AAI variant was calculated using factor analysis. Our aim was to use the indicators to create a composite index that consists of a linear combination of unobservable common factors closely correlated with the indicators. Latent variables are then created from the correlated indicators. We will call the index constructed from these variables the factor-based AAI.4 Using this method we can condense the information content of active ageing indicators into a single indicator, adjusting the weights to the output of the factor analysis rather than expert opinion.
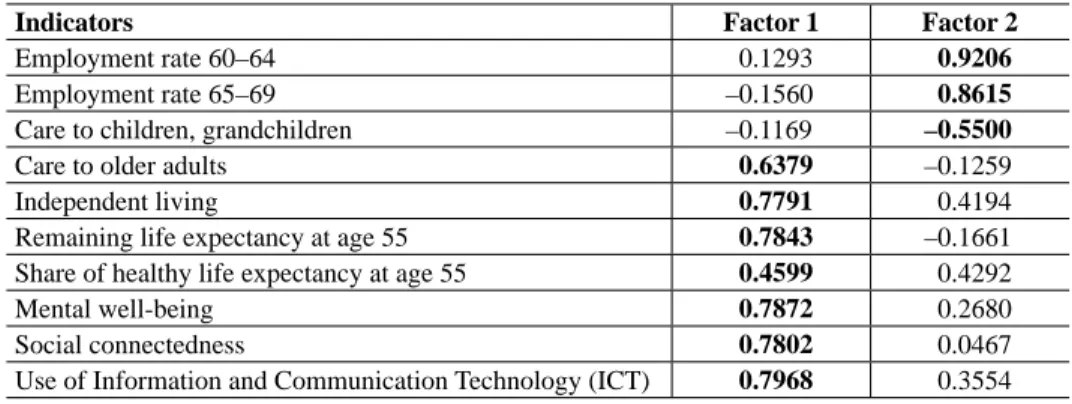
Since we only constructed the factor-based AAI to show the importance of us- ing a more sophisticated indicator of internet usage, we perform our calculations in a simplified form. We apply only the 10 indicators, which are considered the most important with respect to active ageing in Djurovic et al. (2017). These are shown in Table 2. The Kaiser-Meyer-Olkon test statistic is above 0.5, so we deem our sample adequate to perform factor analysis. This is further supported by the Bartlett test, which shows that the hypotheses of the independence of the vari- ables can be rejected at all usual significance levels.
We get eigenvalues greater than one for two factors, so in accordance with the Kaiser criterion we keep these two factors. The factor loadings belonging to the factors after the orthogonal varimax rotation are shown in Table 2. In the table we set the factor loading that is larger in absolute value in bold font for every indicator. Factor loadings show the correlation between the factor and the given indicator, and hence these numbers indicate which factor can be more closely as- sociated with the indicator.
Looking at the values set in bold font, the first factor contains the indicators that make it possible to be active in old age, such as physical and mental health, independent living and internet usage. The second factor corresponds to labor
4 For a detailed description of factor analysis see Kovács (2006).
market participation, because in countries where 60- to 69-year-olds have a higher employment rate they are less likely to care for children and/or grandchildren.
Finally, using the Stata software package we determine the scoring coefficients, which show the indicators’ weight in the given factors (see Appendix Table A1).
Thus, for a given country we calculate the values of the first and second factor by taking the sum product of the 10 standardized indicator values and their cor- responding coefficients, i.e. their weights. Once we have the two factors, we take their weighted sum, where, as in Antony and Visweswara Rao (2007), the weights are the fractions of variances explained by the factors.
Based on the results of the factor analysis we find – similarly to Djurovic et al.
(2017) – that the weight of the employment rate for 65- to 69-year-olds is higher than the weight of the employment rate for 60- to 64-year-olds in the second fac- tor, and internet usage does not have the smallest weight, unlike in the original AAI (the original weight is 1.4%, in Djurovic et al. (2017) it is 7.26%, whereas in our factor-based AAI it is 8.17%).
We calculated the 2018 values of the factor-based AAI for all EU member states with the exception of Malta, for which we could not obtain sufficient data (using 2016 data, just as the original 2018 AAI does). The country ranking based on this AAI differs somewhat from the original AAI ranking. This is due in part to the smaller number of indicators used. As we stated, our calculations merely aim to show that a more sophisticated indicator of internet usage is required. In the next sections we will analyze the role of the original ICT indicator in the AAI and at the same time we investigate the factor-based index and the Djurovic et al.
(2017) method. Then we will examine how much using different internet usage indicators affects the order of country rankings.
Table 2. Indicators used in factor analysis and their factor loadings after the rotation
Indicators Factor 1 Factor 2
Employment rate 60–64 0.1293 0.9206
Employment rate 65–69 –0.1560 0.8615
Care to children, grandchildren –0.1169 –0.5500
Care to older adults 0.6379 –0.1259
Independent living 0.7791 0.4194
Remaining life expectancy at age 55 0.7843 –0.1661
Share of healthy life expectancy at age 55 0.4599 0.4292
Mental well-being 0.7872 0.2680
Social connectedness 0.7802 0.0467
Use of Information and Communication Technology (ICT) 0.7968 0.3554 Source: authors’ calculations, based on AAI (2018).
4. THE CHANGE IN INTERNET USAGE OF THE OLDER POPULATION
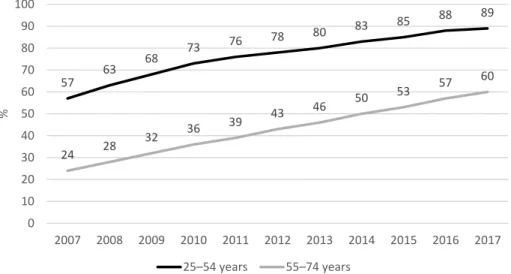
Reiterating the statement from the introduction, in many aspects the internet has been gaining importance in older people’s lives. As shown in Figure 1, the popu- larity of the internet has been on the rise in the European Union among members of both the young and the old age group. In the decade between 2007 and 2017, the rate of internet users in the 55- to 74-year-old age group jumped from 24% to 60%. These data also suggest the strong likelihood that using the internet for dif- ferent life-enhancing purposes will in a few years become a more important indi- cator of active ageing. The original internet usage indicator records only whether older people go online regularly, which will not yield too much information as the internet increasingly becomes a routine part of everyday life. Figure 1 represents this situation.
Behind the upward trend in internet usage among older people there are still underlying differences that are significant. Though the percentage of users in- creased in all countries, 2017 data reveal that in Romania and Luxembourg the proportion of internet users aged above 55 is 28% and 91%, respectively – a strik- ing difference. Nonetheless, given the rapidly accelerating trend, such differences are likely to diminish in the future. Based on our linear regression forecast, the difference between these two countries – the best and worst performing – will only be 49 percentage points in 2025, and 19 percentage points in 2035.
Figure 1. The rate of the internet users from the 25–54 and 55–74 age groups in the European Union using the internet at least once a week.
Source: Eurostat (2018).
57 63 68 73 76 78 80 83 85 88 89
24 28 32 36 39 43 46 50 53 57 60
0 10 20 30 40 50 60 70 80 90 100
2007 2008 2009 2010 2011 2012 2013 2014 2015 2016 2017
%
25ʹ54years 55ʹ74years
This is further evidenced by the fact that internet usage among 25- to 54-year- olds (also shown in Figure 1) has also increased rapidly, reaching 89% by 2017.
It is unlikely that this generation will quit using the internet once they grow old, and much more likely that using the internet will become as ubiquitous as reading and writing is in European countries today.
However, what someone uses the internet for will become more important.
The literature already uses the phrase ‘digital divide’ to describe the differences that exist across social categories, countries and communities in how they use the internet. These differences are classified into three levels (Tirado-Morueta et al.
2018). The first-level digital divide is the inequality between those who have ac- cess to information and communication technology – including the internet – and those who do not. This level can be measured by the ICT indicator currently used by the AAI. The percentage of people living in developed economies who do not have internet access is rapidly shrinking, so nowadays the emphasis is shifting to how effective their internet usage is. This is what the second-level digital divide focuses on. The second-level digital divide explores the differences in the quality of internet usage resulting from the disparity of skills in internet usage (Hargittai 2002; van Deursen – van Dijk 2011). Lastly, the third-level digital divide focuses on the differences in exploiting the advantages of internet usage. Different groups who have the same level of internet access and who use the internet with the same effectiveness may still reap different benefits from it. The second- and third-level digital divides may be mitigated by improving digital literacy, for which there are existing programs, even for older people (Tirado-Morueta et al. 2018). In our paper we call higher levels of digital literacy qualitative internet usage.
Along with the basic internet usage indicator, the Eurostat ICT Survey’s da- tabase contains several indicators that give not just the frequency of the internet usage but also describe the activity itself (e.g. at what rate older people use the internet for job searches, learning, etc.). In the next section we will use these targeted indicators instead of the current internet usage indicator to calculate the original AAI, as well as the AAI variants determined by statistical methods.
5. RANKINGS WITH MORE SOPHISTICATED INTERNET USAGE INDICATORS
The three AAI variants (the original variant based on expert estimates, the one based on Djurovic et al. (2017) and our factor-based AAI) enable us to test the robustness of the original weighting system, and also how much the country rank- ing of the AAI variants change if we replace the internet usage indicator with a more sophisticated one. A comparison of the 2018 country rankings by the
different AAI variants based on the original ICT indicator can be found in the Appendix , Table A2.
We now turn to a discussion of qualitative internet5 usage. It matters whether someone merely checks the news on a favorite news portal or whether they also use the internet for online banking, keeping in touch with friends, or comparing products in order to make purchases. Therefore, it is worthwhile to include the quality of usage as well as the proportion of regular internet users in the indicator.
We have already shown that the rate of internet usage is on the rise among older citizens and there is smaller and smaller distinction between different European countries. As a demonstration, we used three alternative indicators from the Eu- rostat ICT Survey to calculate the AAI values, then we measured the average absolute difference between the country rankings.
We performed our calculations for the year 2016, thus we arrived at alterna- tives for the 2018 AAI. For this year, statistics for 25 different internet activi- ties were recorded in the database. Of these we chose those that corresponded both with active-aging and qualitative internet usage. Before we give the exact categories, we present the method with which we compare the country rankings produced by the various indices.
Based on OECD (2008) we characterize country rankings by average absolute difference. The formula for average absolute difference6 between the different AAI variants and M countries is given in (1):
1
1 | ( ) |,
M
ref c c
c
R Rank CI Rank CI
M
(1)where following OECD (2008) the notation Rankref
CIc shows country c’s original ICT based ranking, and Rank CI( c) shows the country’s ranking with the new indicator.Indicators used were as follows (ICT is also included for the sake of complete- ness):
– the percentage of 55- to 74-year-olds who had used the internet at least once a week in the past three months (this is the original ICT indicator);
– the percentage of 55- to 74-year-olds who used the internet to search for jobs (Job search);7
5 A reminder: by qualitative internet usage we mean internet usage in order to achieve some goal rather than just passively browsing the web.
6 For a description of the average absolute difference indicator see OECD (2008).
7 This internet usage indicator – as expected – got associated with the second, job market related factor during factor analysis.
– the percentage of 55- to 74-year-olds who used the internet for any kind of learning activity (Learning);
– the percentage of 55- to 74-year-olds who used the internet for online bank- ing (E-banking).
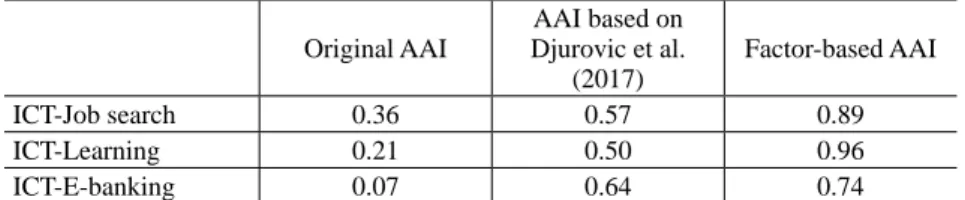
The relative standard deviation – i.e. standard deviation divided by the mean – of all three qualitative indicators is larger than that of the original ICT indicator, thus they are more likely to show the differences between countries than the ICT indicator. A comparison is shown in Table 4.
Table 3. The average absolute differences between the country rankings in case of the three AAI variants with qualitative internet usage
Original AAI
AAI based on Djurovic et al.
(2017)
Factor-based AAI
ICT-Job search 0.36 0.57 0.89
ICT-Learning 0.21 0.50 0.96
ICT-E-banking 0.07 0.64 0.74
Note: the benchmark is the AAI calculated with the original ICT indicator.
Source: authors’ calculations based on Djurovic et al. (2017) and AAI (2018).
Table 4 shows that including a qualitative internet usage indicator instead of the original ICT alters – but not drastically – the AAI country rankings. Given the original weights, using the Job search indicator results in the biggest change, while using the weights of Djurovic et al. (2017) the E-banking indicator has the biggest effect. In case of factor-based AAI the Learning indicator has the most influence on the country rankings.
Countries that score higher in qualitative internet usage also get higher AAI rankings than they do if we use the original ICT indicator (e.g. Lithuania in the case of E-banking, or Portugal in the case of Job search), while countries that achieve lower qualitative internet usage get lower rankings (e.g. Spain in the case of E-banking, or Austria in the case of Job search). This fact is true irrespective of the AAI variant used.
Unfortunately, the data published from the Information and Communication Technology Survey does not contain indicators that combine types of internet usage – e.g. how many older people have used the internet for learning or job search – hence we could make no such comparisons. We find it likely that such combined indicators would further increase the ranking power of qualitative in- ternet usage.
6. CONCLUSIONS
Our paper described the Active Ageing Index. This indicator, created in 2012, aims to measure the untapped potential of older people for active and healthy ageing using data from European Union surveys. Domains and indicators chosen by experts are aggregated by weighting coefficients which were also chosen by the Expert Group. In one domain the internet usage of people aged 55 or older is measured as the proportion of this generation who use the internet at least once a week. Using this metric, the differences between countries will likely diminish, and the indicator will lose relevance. We examined the role and the content of this indicator.
We described the results of Djurovic et al. (2017) who applied the CIDI meth- od, and also discussed our AAI variant based on factor analysis. This enabled us to compare country rankings based on the weighting system of the Expert Group and by the weights determined by mathematical-statistical methods as well. We saw that statistical methods make the differences more relevant between coun- tries, but the changes in the rank order of countries were only moderate.
In view of the diminishing relevance of weekly internet usage we also recom- mended that an indicator of qualitative (active) internet usage should be included in AAI calculations. A few examples: whether a person has used the internet to search for a job, for a learning activity or for online banking. Unfortunately, the ICT Survey does not contain data for these categories jointly, but separately they could be found.
We have shown that even the separate indicators affect the country rank- ing more than the original internet usage indicator, especially for countries that achieve extreme scores for the given indicator. This is true irrespective of the AAI variant used. Therefore, we make the recommendation that in the future a composite qualitative internet usage indicator should be applied when calculating AAI.
REFERENCES
AAI (2018): Active Ageing Index, UNECE Statistics. https://statswiki.unece.org/display/AAI/
Active+Ageing+Index+Home, accessed 02/04/2018.
Antony, G. – Visweswara Rao, K. (2007): A Composite Index to Explain Variations in Poverty, Health, Nutritional Status and Standard of Living: Use of Multivariate Statistical Methods. Pub- lic Health 121(8): 578–587.
Bandura, R. (2008): A Survey of Composite Indices Measuring Country Performance: 2008 Up- date. UNDP/ODS Working Paper.
Djurovic, I. – Jeremic, V. – Bulajic, M. – Dobrota, M. (2017): A Two-Step Multivariate Composite I-Distance Indicator Approach for the Evaluation of Active Ageing Index. Journal of Population Ageing 10(1): 73–86.
Dobrota, M. – Bulajic, M. – Bornmann, L. – Jeremic, V. (2016): A New Approach to QS University Ranking Using Composite I-distance Indicator: Uncertainty and Sensitivity Analyses. Journal of the Association for Information Science and Technology 67(1): 200–211.
Eurostat (2018): Eurostat Database. http://ec.europa.eu/eurostat/data/database, accessed 30/04/
2018.
Hargittai, E. (2002): Second-Level Digital Divide: Differences in People’s Online Skills. First Monday 7(4).
Ivanovic, B. (1973): A Method of Establishing a List of Development Indicators. Paris: UNESCO.
Jeremic, V. – Bulajic, M. – Martic, M. – Radojicic, Z. (2011): A Fresh Approach to Evaluating the Academic Ranking of World Universities. Scientometrics 87(3): 587–596
Kelley, A. C. (1991): The Human Development Index: “Handle with Care”. Population and Devel- opment Review 17(2): 315–324.
Kovács, E. (2006): Pénzügyi adatok statisztikai elemzése [Statistical Analysis of Financial Data].
Budapest: Tanszék Kft.
OECD (2008): Handbook on Constructing Composite Indicators. Methodology and User Guide.
Paris: OECD Publications.
Paruolo, P. – Saisana, M. – Saltelli, A. (2013): Ratings and Rankings: Voodoo or Science? Journal of the Royal Statistical Society: Series A (Statistics in Society) 176(3): 609–634.
Ragnedda, M. – Ruiu, M. L. (2017): Social Capital and the Three Levels of Digital Divide. In:
Ragnedda, M. – Muschert, G. (eds): Theorizing Digital Divides. Abingdon: Routledge, pp.
21–34.
São José, J. M. – Timonen, V. – Amado, C. A. F. – Santos, S. P. (2017): A Critique of the Active Ageing Index. Journal of Aging Studies 40: 49-56.
Tirado-Morueta, R. – Aguaded-Gómez, J. I. – Hernando-Gómez, Á. (2018): The Socio-Demographic Divide in Internet Usage Moderated by Digital Literacy Support. Technology in Society 55:
47–55.
UNECE (2018): Do it yourself! https://statswiki.unece.org/pages/viewpage.action?pageId=76287845, accessed 24/03/2018.
Van Deursen, A. J. – Van Dijk, J. (2011): Internet Skills and the Digital Divide. New Media &
Society 13(6): 893–911.
WHO (2002): Active Ageing – A Policy Framework. A Contribution of the World Health Organization to the Second United Nations World Assembly on Ageing, Madrid, Spain, April 2002.
Yang, L. (2014): An Inventory of Composite Measures of Human Progress. Occasional Paper on Methodology. New York: UNDP Human Development Report Offi ce.
Zaidi, A. – Gasior, K. – Hofmarcher, M. M. – Lelkes, O. – Marin, B. – Rodrigues, R. – Schmidt, A.
– Vanhuysse, P. – Zolyomi, E. (2013): Active Ageing Index 2012. Concept, Methodology, and Final Results. Research Memorandum/Methodology Report. Vienna: European Centre Vienna.
APPENDIX
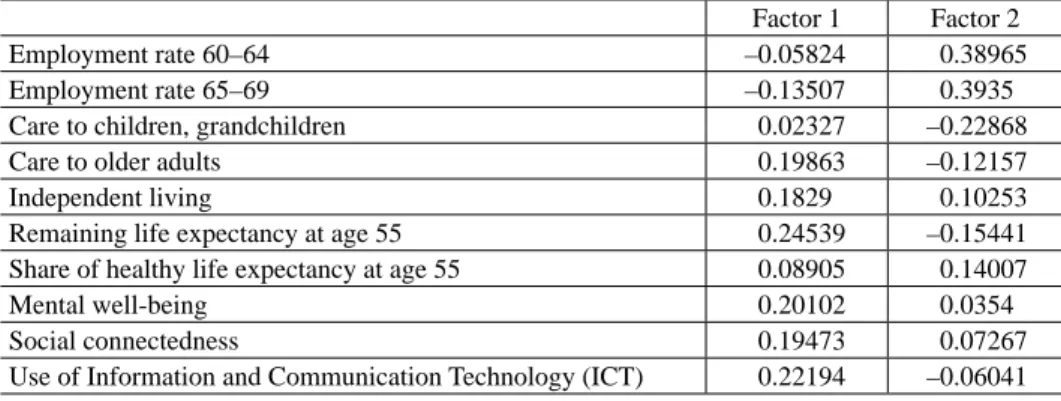
Table A1. Indicators used in the factor analysis and their scoring coefficients.
Factor 1 Factor 2
Employment rate 60–64 –0.05824 0.38965
Employment rate 65–69 –0.13507 0.3935
Care to children, grandchildren 0.02327 –0.22868
Care to older adults 0.19863 –0.12157
Independent living 0.1829 0.10253
Remaining life expectancy at age 55 0.24539 –0.15441
Share of healthy life expectancy at age 55 0.08905 0.14007
Mental well-being 0.20102 0.0354
Social connectedness 0.19473 0.07267
Use of Information and Communication Technology (ICT) 0.22194 –0.06041 Source: Authors’ calculations based on AAI (2018).
Table A2. Country rankings in case of the three AAI variants with the original ICT concerning AAI 2018
Original AAI AAI based on
Djurovic et al. (2017) Factor-based AAI
Sweden 1 1 1
Denmark 2 2 2
Netherlands 3 3 3
United Kingdom 4 5 5
Finland 5 4 4
Germany 6 9 6
Ireland 7 6 7
France 8 8 8
Estonia 9 12 12
Belgium 10 7 9
Czech Republic 11 14 15
Cyprus 12 15 18
Austria 13 11 11
Latvia 14 20 17
Luxembourg 15 10 10
Italy 16 17 13
Spain 17 13 14
Portugal 18 16 16
Lithuania 19 23 19
Bulgaria 20 19 20
Slovakia 21 21 24
Society and Economy 41 (2019) Table A2 cont.
Original AAI AAI based on
Djurovic et al. (2017) Factor-based AAI
Slovenia 22 18 21
Poland 23 24 25
Hungary 24 22 22
Romania 25 26 27
Croatia 26 25 26
Greece 27 27 23
Source: authors’ calculations based on Djurovic et al. (2017) and AAI (2018).
Open Access. This is an open-access article distributed under the terms of the Creative Commons Attribution 4.0 International License (https://creativecommons.org/licenses/
by/4.0), which permits unrestricted use, distribution, and reproduction in any medium, provided the original author and source are credited, a link to the CC License is provided, and changes – if any – are indicated. (SID_1)