1
WORKING PAPER
Ákos Kengyel
1The Future of EU Cohesion Policy
Endogenous Development – Added Value of Intervention – Regulatory Frameworks
2Department of World Economy Corvinus University of Budapest
1 Associate Professor, Corvinus University of Budapest, Department of World Economy (e-mail:
akos.kengyel@uni-corvinus.hu)
2 This study was prepared within the framework of a research project on competitiveness supported by the TÁMOP-4.2.1.B-09/1/KMR-2010-0005 project.
2
The successful operation of the regional development – or cohesion – policy of the European Union has a strategic importance from the point of view of the whole integration process.
Strengthening economic, social and territorial cohesion and decreasing disparities between member states and regions are not only one of the main priorities of the integration, but at the same time these are justified expectations of the people living in the member states of the union. The cohesion transfers should be spent on those factors which have the biggest contribution to the improvement of development prospects and competitiveness in the given regions. Theories on regional development have controversial conclusions about the long- term formation of development disparities. However, it has become evident that successful development policies are based on endogenous factors, innovation and well-functioning institutions. After examining theoretical considerations and regional disparities the study analyses the impacts of EU regional policy and evaluates the main elements of the proposed regulatory frameworks for the period 2014-2020.
The commitment to reduce economic disparities within the European Union has strengthened as the number of EU member states has grown and as integration has deepened, since both processes have resulted in an increase in regional problems. The Structural Funds and Cohesion Fund have been created and their budgetary significance grown considerably. An effective cohesion policy is crucial to the development of an integrated EU. If the EU does not have a commitment to reduce the disparities in income differences and living standards, the future of the integrative process would be undermined. It would be unacceptable for citizens in differing parts of the Union to be subject to significantly different standards.
The most important argument in favour of an EU policy is the necessity to have an active device by which the welfare benefits of economic integration are spread throughout the European Union. There is no guarantee that this will occur if market forces are allowed to operate freely. Evidence would suggest that the opposite effect might result and that development would become even more concentrated in the centre of the EU. It is, however, unrealistic to attempt to equalise all conditions throughout the EU, which are the result of different resource endowments and historical factors. The measures adopted by the EU in the form of cohesion policy are not intended to do that. The funds aim to promote a better economic and social balance across the European Union and to reduce regional disparities, by co-financing with member states development actions in their regions.
After the subsidies spent on the common agricultural policy, expenditure on cohesion policy is the most significant part of the EU budget and accounts for about one third of total EU common budget. The nature and distribution of the support has become a politically sensitive issue within the EU. For some states, in which the poorest regions are located, payments have come to be considered as the means to ensure their national government's support for potentially damaging EU actions. For other states, which are net contributors to the EU budget, payments from the Structural Funds are seen as a way of "clawing back" some of those contributions. It can be stated that though over the last two decades expenditure on the Structural Funds has been gradually increasing, even this cannot be considered significant
3
help. The ratio of the amount to be spent on subsidies compared with the Union’s GDP is rather low: the transfers, on average, amount to 0.4% of the Union’s GDP. This reflects a low degree of solidarity and sacrifice.
It has sometimes been argued that cohesion policy is and should be essentially a tool to redistribute resources from richer to poorer areas. If this route is taken, the next step is to call for measures aimed at compensating very backward areas by providing unconditional support, possibly through automatic devices. This characterization not only looks like a misrepresentation of what cohesion policy today is about, but it actually misses the point of the very meaning of cohesion target in both EU history and its Treaty. Cohesion policy is not about redistribution, is about growth. There are mutual benefits for all member states.
Cohesion policy must be carried out at EU level because cohesion is one of the main targets of the integration.
In the first part of the study the most important factors of development will be presented through evaluation of the main theories concentrating on endogenous factors of development and the role of innovation. The main reasons in favour of an intervention at EU- level will be explained. After the theoretical background, the second part will present the situation among the member states and regions in relation to the long-term tendencies in the field of regional disparities and experience of convergence. The third part will focus on the effects of EU regional policy on catching up: macro-econometric model results will be analysed and, in addition, the “qualitative” effects of EU-level regulatory frameworks will be analysed. The last part will give a critical evaluation on the future rules governing the cohesion policy in the period 2014-2020.
Development economics and regional development policy considerations
In economic theories, there are several controversial models about the effects of integration on catching up. Originally automatic convergence was assumed, later theories started to deal with causes of divergence, basically because of the experience of the European integration has shown different examples of successful catching up or lagging behind.
Because of decreasing returns, in the neo-classical growth theories real convergence is expected. The marginal productivity of capital falls with accumulation, in turn reducing the incentive to save. As a result, growth slows down in richer countries and regions and the initially poorer countries will grow faster and converge. Divergence can be explained by endogenous growth model based on increasing returns of human capital and innovation; by the new economic geography based on the economics of agglomeration; and by institutionally oriented economic theories including social capital.3
The endogenous growth model and innovation
Among the factors determining regional inequalities, differences in infrastructure and human resources largely contribute to the competitiveness of individual regions. The
3The effects of different theories on economic integration are summarized by Pelkmans (2006) pp. 339-342.
4
historically low level of infrastructural investment has undoubtedly hindered the improvement of productivity and employment levels in the least developed member states of the EU. The infrastructural background, the quality of human resources, the levels attained in research and development activities, and, as a consequence of all the above, the region’s ability to attract investments, are all factors determining competitiveness, which clearly reflect the development level and prospects of a region.
The EU’s regional policy has to improve the conditions that influence competitiveness in such a way that the given region becomes more attractive to investors, the spirit of enterprise is stimulated, and, as a result, economic growth takes off. It should be emphasized that “domestic factors – such as strong development of a financial sector, prudent macroeconomic policy, strengthened institutional frameworks, improved public and corporate governance – correlate with external capital inflows. Depending on causality, these factors are considered either as conditions/thresholds needed to achieve growth benefits or as additional benefits/collaterals to growth.” (Wilczynski, 2011. p. 5.)
The new way of approaches based on the endogenous growth model tries to employ measures that enhance domestic capacity and capability to improve competitiveness.
According to this model endogenously created improvements in the level of technological knowledge or in human capital generation and accumulation present the driving force of the long-term development and growth (Romer, 1990). Thus, the endogenous approach highlights the resources of the region, such as human capital, entrepreneurship, innovation, capacity to adopt new technologies, leadership and institutional capability, as well as trust based local relations as fundamental drivers of regional growth. Actually, these are the factors which increase the resource endowments and knowledge base of a region (Stimson, 2009).
The endogenous model argues that technological progress and human resources are the main factors in increasing the standard of living. The dynamics of development is not equal in different regions, because it depends on the qualification of human resources and additionally, the rate of human and physical capital involved in research and development activities, and efficiency in adopting new technologies. Accordingly, by investing in R&D activities and education, the region has ability to catch up with the developed regions or those that are technologically advanced and so, it will easily adopt the new technologies and innovations. In this context institutional system has a crucial role in moving the region up to the technology frontier considering that the utilization of the local resources depends on the institutional development and capability.
The new concept makes shift from the comparative and competitive advantage to collaborative advantage of the region. Along with the rising role of the endogenous growth model in the last decades, collaborative advantage was in the focus with an aim to support the partnership and cooperation between the different local agents: governmental institutions, private sector, educational institutions, NGOs. The good strategic planning and policy programming require the input from local agents. Indeed, the regional "assets" are underlined as the source of development. Competitive growth needs to be based on the endogenous model supporting not only the tangible infrastructure, but also the “soft” or less
5
tangible factors. Furthermore, the collective approach including cooperation and partnership between all stakeholders in the region needs to be strongly supported.
Hence, efficiency of the whole institutional system is relevant, however when speaking about growth, institutions and networks that assist knowledge creation – R&D, cooperation between the public, private and research sector, SMEs support and access to finance – are vital and therefore called ”systems of innovation” (Lundvall, 1992; Nelson, 1993). Experience suggests that there is a low growth in the regions where ineffective institutions operate and especially, if the learning process is not supported in these regions.
This makes a clearer understanding of how processes such as physical and human capital accumulation, innovation, knowledge impact long run economic growth.
Wintjes and Hollanders (2011) emphasize that regional diversity and pathways and models of innovation calls for differentiated policies. In many regions, new technologies originate outside the region, innovation should therefore be considered in a broader sense, beyond the research- or science-based approach. Non-technological innovations (organisational and marketing processes, new forms of collaborative arrangements also should be taken into account. Farole et al. (2011) stress that combating underdevelopment to enhance growth requires a mixture of multi-level governance and true subsidiarity. They call attention on the existence of technological and other types of frontiers which need a highly tailored set of interventions that are designed to address specific regional contexts of underdevelopment and to promote growth.
The necessity of an active regional policy
The most important argument supporting the need for an EU-level regional policy is that to spread the welfare gains resulting from economic integration requires active tools, since, with market forces working freely, the benefits arising from integration cannot necessarily be felt in every region, but on the contrary, development may become even more concentrated in the central regions of the EU.
There are numerous arguments to back an active regional policy as opposed to the view that spontaneous market adaptation has sufficient impact (Kengyel, 2008, pp. 58-60.):
- The major consideration is the necessity to handle the structural weaknesses resulting from the inflexibilities of the market, the conditions of access to the market and the structure of production.
- The problem of utilizing the factors of production: the reallocation of resources may be slower than would be socially acceptable. Though the classical theory of international trade postulates the free flow of factors of production, which ensures complete utilization, even Adam Smith remarked that the factor hardest to mobilize is Man. In times of recession the employment situation is difficult everywhere, and as a result the potential advantages of areas with abundant manpower disappear. The low mobility of labour prevents the levelling out of inequalities within an economic union.
- The need to handle the distortions arising from the allocation of resources. Capital has a tendency to move toward the more developed regions: here private investors can expect a faster return and can save the major part of the costs of infrastructure development. This
6
tendency of the developed to become even more developed, while the less developed, in the optimal case, remains at the level already achieved, ensures significant gains for private investors on the one hand, and involves social costs on the other. From the above it follows that if private investors’ decisions are not influenced by government policies, then considerable social costs may be incurred.
- In the supported region state subsidies, and consequently public expenditure, can be reduced in the long term. The incentives provided by the state and the support of economic activity can accelerate the development of the given region, unemployment may be reduced, social costs may decrease and tax revenues may increase.
- Though regional policy targets a particular region, the positive influence of the benefits can be felt not only in the targeted region but in other regions as well. Integration will deepen and the factors of production will be better utilized.
- Besides the economic arguments underlining improvement of efficiency, certain political aspects are no less important. Solidarity and tolerance are crucial in every social community. In the course of creating an economic union, regional inequalities must also be reduced, which requires reduction of the growing and intolerable differences in welfare between regions at different levels of development.
Tendencies of convergence and disparities among the EU member states and regions Over the past decades a process of levelling out among the less developed member states has been taking place, as can be seen in the three countries (Greece, Portugal and Spain) formerly the least developed, and in Ireland, though at a pace varying from country to country.
However, the decades of European integration shows a mixed picture: both convergence and divergence occur over time and simultaneously. The experience shows that the less developed member states’ performance converge in the long run, but in several cases the poorer regions were able to reach a lower speed of economic growth.4 Concerning the experience of the old less developed member states, in 1960 the four countries had a low level of GDP per capita in purchasing power parities: Portugal had 40%, Greece 43%, Spain 57% and Ireland 61% to the EU15 average. According to the latest official statistical publications Portugal achieved 80%, Greece 90%, Spain 100% and Ireland 128% of the EU27 average level of development (Eurostat, 2011b).
The eastern enlargement presented an unprecedented challenge to the competitiveness and internal cohesion of the EU. After May of 2004, the EU’s average GDP per head decreased by almost 13 per cent, because the GDP of most of the regions in the new member states were between 30-40% of the former EU15 average. If we calculate with the 12 new countries, including Romania and Bulgaria, the statistical effect was to reduce the EU15 average GDP per head by 18% (European Commission, 2004). This meant that regions with GDP per head between 60% and 75% the EU15 average (the latter being the threshold for the
4 It should be noted that there are unfavourable periods (like in the mid-1970s or since 2008) when there are economic and financial crises in the world economy and recession or stagnation hinder less developed open economies to reach a faster speed of economic growth.
7
“Objective 1” status) had a GDP in excess of 75% in the context of EU27, even though there was no actual improvement in economic performance.
At the time of accession some 92% of the people in the new member states lived in regions with GDP per head below 75% of the enlarged EU average and over two-thirds in regions where it was under half the average. The ratio of GDP per head in the top regions to that in the bottom in the enlarged EU was around double the ratio for the EU15. The top 25%
of the regions in the EU27, therefore, had an average level of GDP per head of 3.3 times that of the bottom 25% as against the ratio of 2.0 in the case of EU15, while the top 10% of regions after enlargement to 27 members had a level 5.3 times the bottom 10% as compared with a ratio of 2.6 in the case of EU15. GDP per head of the 10% of the bottom regions decreased from 61% of the EU15 average before enlargement to only 31% of the average for the enlarged EU. It is noteworthy that very few regions from the EU15 appeared in the list of the least prosperous regions of an enlarged union.
According to the latest available data for 2010, 2009 and 2008, published by the statistical office of the European Union the dispersion in GDP per capita across the EU member states remained quite remarkable. As in previous years, Luxembourg has the highest GDP per capita among all the 27 member states and it is more than two and a half times above the EU27 average, and about 6 times higher than Bulgaria, which is the poorest member state as measured by this indicator.5 The Netherlands comes out second among the member states, at 33 per cent above the EU average. Ireland maintains its position among the richest EU member states, but there is a clear downward trend between 2008 and 2010. This can be explained primarily by the development of its nominal GDP, which decreased by more than 13 per cent in this period. Other member states with GDP per capita of 20 per cent or more above the EU level in 2010 were Denmark, Austria and Sweden. Belgium and Germany are at about the same level, followed by Finland and the United Kingdom, while France comes out well ahead of Italy and Spain which have been at similar levels for several years.
Cyprus, with a GDP per capita marginally below the EU average in 2010, remained ahead of Greece, which has suffered from the deep economic crisis. Slovenia, Malta, Portugal and the Czech Republic are all clustered around 20 per cent below the EU average, well ahead of Slovakia, Hungary, Estonia and Poland which are around 40 per cent below the EU average. Poland shows a clear improvement in its relative position, while Lithuania and Latvia, on the other hand, have shown a decline in GDP per capita between 2008 and 2010.
Romania and Bulgaria have GDP per capita levels just below 50 per cent of the EU average.
The regions with the highest per capita GDP are in southern Germany, the south of the UK, northern Italy and Belgium, Luxembourg, the Netherlands, Austria, Ireland and Scandinavia. The regions around certain capitals, Madrid, Paris, Praha and Bratislava, also fall into this category. The weaker regions are concentrated in the southern, south-western and south-eastern periphery of the EU, in eastern Germany and the new member states.
5 One particular feature of Luxembourg's economy which to some extent explains the country's very high GDP per capita is the fact that a large number of foreign residents are employed in the country and thus contribute to its GDP, while at the same time they are not included in the resident population.
8
Nowadays, per capita GDP ranges from 28 % of the EU27 average (6 500 PPS) in Severozapaden in Bulgaria to 343 % (85 800 PPS) in the capital region of Inner London in the UK. The factor between the two ends of the distribution is therefore 13.2:1 (Eurostat, 2011c).
Luxembourg at 280 % (70 000 PPS) and Brussels at 216 % (54 100 PPS) are in positions two and three, followed by Groningen (Netherlands) at 198 % (49 700 PPS), Hamburg at 188 % (47 100 PPS) and Praha at 173 % (43 200 PPS) in positions four, five and six. Praha thus remains the region with the highest per capita GDP in the new member states;
Bratislavský kraj (Slovakia) follows with 167 % (41 800 PPS) in ninth position among the 271 NUTS 2 regions. The next most prosperous regions in the new member states are a long way behind: Bucureşti - Ilfov in Romania at 113 % (28 300 PPS) in position 74, Zahodna Slovenija (Slovenia) at 109 % (27 300 PPS) in position 87, Közép-Magyarország (Hungary) at 107 % (26 800 PPS) in position 96 and Cyprus at 97 % (24 400 PPS) in position 129. With the exception of 3 other regions (Mazowieckie in Poland, Malta and Vzhodna Slovenija in Slovenia), all the other regions of the new member states have a per capita GDP in PPS of less than 75 % of the EU27 average.
As a result, GDP in 64 regions is less than 75 % of the EU27 average. 23.8 % of the population of the EU lives in these regions, only a quarter of these regions are in EU15 countries. At the upper end of the spectrum, 40 regions have per capita GDP of more than 125 % of the EU27 average; these regions are home to 19.6 % of the population. Regions with a per capita GDP of between 75 % and 125 % of the EU average are home to 56.6 %, and thus a clear majority of the population of the countries. Some 8.7 % of the population live in the 25 regions whose per capita GDP is less than 50 % of the EU average. With the exception of the French overseas department of Guyane, all these regions are located in the new member states.
A more detailed analysis of trends within countries between 2000 and 2008 shows that the economic development of regions within a country can be almost as diverse as between regions in different countries (Eurostat, 2011a). The largest differences were seen in the Netherlands, Romania, Slovakia and the United Kingdom, where there were performance differences of more than 40 percentage points relative to the EU average for the per capita GDP of the fastest- and slowest-growing regions. The countries with the smallest differences between regions were Ireland, Slovenia, Denmark and Finland, with regional performance differences of between 2 and 9 percentage points. In both new member states and EU15 countries, significantly diverging regional trends were the result mainly of dynamic growth in capital regions. However, as the values for Slovenia (6 percentage points) and Poland (14 percentage points) show, the data available do not confirm the assumption that major regional growth disparities are a typical feature of new member states. The data also show that the regions with the lowest levels of per capita GDP made significant progress. Between 2000 and 2008, Nord-Est and Sud-Muntenia (both in Romania) caught up by 11 and 18 percentage points and Yuzhen tsentralen (Bulgaria) by 9 percentage points compared to the EU27 average.
9
The real question is whether convergence among the regions of the EU27 has made progress over the period 2000–08. Regional convergence of per capita GDP (in PPS) can be assessed by measuring the gap between the highest and lowest values. By this method, the gap closed from a factor of 17.2 in 2000 to 13.2 in 2008. The main reason for this clear convergence was faster economic growth in Bulgaria and Romania. However, as this approach looks only at the extreme values, it is clear that the majority of shifts between regions are not taken into account. A much more accurate evaluation of regional convergence is afforded by the dispersion of regional GDP calculated by Eurostat for the EU27 since 2007.
This takes into account of divergences from the national average in all NUTS 2 regions for each country in turn, weighted by the regional population. In the first instance, a downward trend is apparent, i.e. a decrease in regional dispersion for the EU as a whole. An examination of the trend in individual countries reveals clear differences between certain groups of member states. First, most of the EU15 countries have lower dispersion than the new member states. In addition, values in the EU15 countries are generally decreasing, whereas they are increasing considerably in some of the new member states. It is thus evident that the economic catching-up process in new member states has so far gone hand-in-hand with increasing regional disparities.
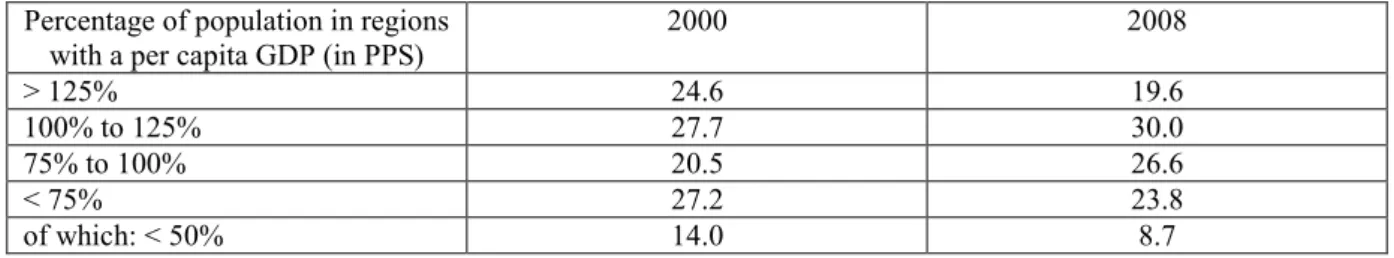
Table 1 shows clear progress in economic convergence between regions over the eight-year period 2000–08: the proportion of the population living in regions where per capita GDP is less than 75 % of the EU average fell from 27.2 % to 23.8 %. At the same time, the proportion of the population living in regions where this value is greater than 125 % fell from 24.6 % to 19.6 %. These shifts at the top and bottom ends of the distribution meant that the proportion of the population in the midrange (per capita GDP of 75–125 %) increased sharply from 48.2 % to 56.6 %. This corresponds to an increase of around 50 million inhabitants. A more detailed analysis shows that, in addition, many regions with a GDP of less than 50 % of the EU average have made quite substantial progress. Between 2000 and 2008, the population living in these regions fell by almost a third, from 14 % to 8.7 %, i.e. by 25 million.
Moreover, an examination of the 10 weakest regions as at 2000, where 4.8 % of the population lived at that time, shows that this group made strong progress. Per capita GDP in these regions rose from 22.6 % to 36.4 % of the EU average between 2000 and 2008.
Table 1
Convergence among regions: Shares of population in economically stronger and weaker regions (EU27=100)
Percentage of population in regions
with a per capita GDP (in PPS) 2000 2008
> 125% 24.6 19.6
100% to 125% 27.7 30.0
75% to 100% 20.5 26.6
< 75% 27.2 23.8
of which: < 50% 14.0 8.7
Source: Eurostat, 2011a.
10
A comparison of the extreme values between 2000 and 2008, however, shows that trends in the EU15 have been quite different from those in new member states. While the gap between the regional extreme values in the new member states is growing in most cases, it is shrinking in one out of every two EU15 countries. The catch-up process in new member states was of the order of 1.7 percentage points per year between 2000 and 2008, compared to the EU average. Per capita GDP (in PPS) in these 12 member states thus rose from 45 % of the EU average in 2000 to almost 59 % in 2008. In 2008, performance was particularly strong, with 2.7 percentage points. This can be explained partly by the fact that the economic and financial crisis struck first in the EU15 member states, some of which, like Ireland, Italy and Denmark, were already in recession in 2008. On the other hand, among new member states, only Estonia and Latvia already had negative volume growth rates in 2008, and the full effects of the crisis became apparent only in 2009. The initial data available on certain member states for 2009 and 2010 would suggest that the recession affected rural regions and areas lagging behind in terms of economic development less severely than regions with a high per-inhabitant GDP, or with a high level of dependence on exports or tourism. This means that it can be expected that disparities didn’t start to increase.
It should be emphasized that EU regional policy support is, of course, only part of the explanation for these processes, several other factors (increasing openness to the world economy, national economic policies and the structural adaptation of the national economies) have also contributed to the catching up processes. At the same time, as a result of strengthening the EU-level regional policy since the 1990s, subsidies from the EU play a decisive role in the convergence of economic performance.
Macroeconomic impacts and the added value of EU-level regional transfers
There are several studies about the impacts and results of EU transfers on catching up. Some authors concluded that there is no evidence that the assisted regions display any form of systematic catching up (Boldrin – Canova, 2001). Others concluded that the success is very much dependent on national economic policy incentives which promote structural changes and research and development activities. EU supports are more effective in countries with the right institutions and indicators of good governance (Cappelen et al. 2003, Ederveen – Groot - Nahuis 2006).
The “quantitative added value”: volume of transfers and impacts
Contrary to the relatively modest supports, the macro-economic effects of the subsidies have proved to be far-reaching. Significant progress has been achieved in terms of qualifying the impact of interventions, especially in large Objective 1 regions, where the overall effects can be measured by using macroeconomic models.
The HERMIN model is one of the most well-known econometric model for analysing the impacts of EU level intervention.6 HERMIN is a macro econometric model that combines
6 Detailed description and results of the HERMIN model can be read in Bradley – O’Donnell – Sheridan – Whelan (1995); Bradley (2006).
11
both neo-classical and Keynesian elements to analyse in one framework both short-run (demand) and long-run (supply side) effects. The model takes into account that the transfers have the effect of enabling the least wealthy regions to achieve higher levels of investment in human and physical capital than would otherwise be the case, so helping to improve their long-term competitiveness. Some of the gains are due to short-run demand effects, in the form, for example, of a temporary boost to construction. However, around half of the increase in GDP is attributable to supply-side effects, which are important to sustain higher growth rates over long-term. These take the form of increases in physical and human capital and R&D, which serve to push productivity and growth potential. The projected effects of EU transfers differ between countries, partly because of variations in the scale of funding, partly because of differences in the structure of the economy. In general, the countries with large agriculture and basic industry sectors gaining less than those with more services and higher- tech sectors.
Results of the HERMIN model provide quantitative evidence of the positive effects of EU support, in terms, for example, of job saved, created or redistributed. Model estimations for the period 2007-2013 show that cohesion policy has a significantly positive effect, with absolute GDP being some 5-10% higher in most of the new member states than in the absence of intervention. The job content is high, with 2 million net additional jobs predicted by 2015.
(Table 2) It is important to note that the simulations incorporate only the effects of the EU contribution. The pattern of national spending is assumed to remain unchanged, which seems plausible given that most co-financing will come from money already earmarked for the spending in question.
Table 2
Results of the HERMIN model: Effects of EU transfers for 2007-2013 on national GDP and employment in 2015
Country GDP gain
(% above baseline) Employment gain
(% above baseline) Employment gain (1000s above baseline)
Bulgaria 5.9 3.2 90.4
Czech Republic 9.1 7.1 327.8
Estonia 8.6 5.4 31.0
Ireland 0.6 0.4 8.2
Greece 3.5 2.3 95.0
Spain 1.2 0.8 156.7
Cyprus 1.1 0.9 3.1
Latvia 9.3 6.0 55.4
Lithuania 8.3 4.8 67.7
Hungary 5.4 3.7 147.3
Malta 4.5 4.0 6.9
Poland 5.4 2.8 384.2
Portugal 3.1 2.1 104.8
Romania 7.6 3.2 267.5
Slovakia 6.1 4.0 87.9
Slovenia 2.5 1.7 15.7
Eastern Germany 1.1 0.9 60.0
Italian Mezzogiorno 1.5 0.9 60.1
Total 1969.7
12 Source: European Commission, 2007.
Another model on the impacts of EU transfers in the period 2007-2013 shows impressive results of EU assistance in the long run (Varga - in’t Veld, 2010). This micro-founded dynamic general equilibrium model is a standard DSGE model but with human capital accumulation and endogenous technological change. Cohesion policy interventions were simulated in this model through shocks given to corresponding model variables: 86 interventions were identified which were grouped into 5 main categories (infrastructure, agriculture-industry-services, R&D, human resources, technical assistance). A comparison across countries shows GDP effect proportional to the funds received when the financing of EU contributions is also taken into account.
The model results show that the cumulative net cohesion receipts will reach 17% of the supported countries’ GDP and their impact on GDP will reach 14,68% by 2016. For a longer run by 2025, the cumulative GDP effects will approach 45%, which means that the cumulative multiplier will increase from 0.86 in 2016 to 2.63-ra by 2025. (Table 3) The cumulative multiplier was calculated as the cumulative sum of GDP effects divided over the cumulative sum of net cohesion receipts. The multiplier is close to one in the last year of the programming period and increases further in the following years. The multiplier is largest in Spain and Portugal and becomes also large for Slovakia and Poland. Germany and Italy are net contributors and cumulative GDP effects are negative or negligible. It should be emphasized that the multiplier differs according to the different spending categories. The cumulative multiplier for research and development is larger than that for infrastructure. The multiplier of investment in human capital increases sharply in the long run, this type of intervention has long delayed benefits, but the largest long run output effects of all categories.
Table 3
Results of the micro-founded DSGE model: Cumulative GDP effects of cohesion spending in 2007-2013 (in per cent of GDP, in 2016 and 2025)
Country Cumulative net cohesion
receipt 2016
Cumulative GDP effect
2016
Cumulative GDP effect
2025
Cumulative multiplier
2016
Cumulative multiplier
2025
BG 17,42 13,12 40,30 0,75 2,31
CY 3,05 2,49 6,97 0,82 2,29
CZ 16,84 8,95 32,19 0,53 1,91
EE 22,49 17,23 45,30 0,77 2,01
PL 16,85 17,29 54,10 1,03 3,21
LT 25,08 18,19 55,23 0,73 2,20
LV 24,88 21,33 65,20 0,86 2,62
HU 23,36 19,28 57,14 0,83 2,45
MT 13,35 7,86 20,11 0,59 1,51
RO 13,25 13,00 34,30 0,98 2,59
SK 14,44 15,79 47,61 1,09 3,30
SI 10,10 7,82 21,78 0,77 2,16
GR 5,86 5,49 15,35 0,94 2,62
PT 10,19 11,42 32,19 1,12 3,16
SP 1,29 1,50 4,75 1,16 3,67
13
DE -1,24 -0,28 -0,06 - -
IT -0,91 0,09 1,27 - -
NMS 17,06 14,68 44,90 0,86 2,63
EU15 -0,95 -0,62 -0,78 - -
Source:Varga - in’t Veld, 2010.
Evaluating the “qualitative added value” of cohesion policy: policy frameworks
Most of the effects of cohesion policy cannot readily be expressed in quantitative terms (Bachtler – Taylor, 2003; Kengyel, 2008). Beyond the net impact of EU transfers on GDP or employment, its added value arises from other aspects, like the contribution made to regional development policies by factors such as:
- multi-annual programming (strategic planning, integrated development policies);
- partnership;
- evaluation;
- co-operation between regions (exchange of experience and good practice);
- political added value.
Multi-annual programming has been one of the main successes of the Structural Funds method and the benefits of this approach have become clearer over time as member states capacity to plan programmes over a number of years has developed. The relative consistency and coherence in programming since 1989 has facilitated longer term and more strategic planning. The EU programming approach has promoted strategic dimension in regional development policy making. From a financial perspective, multi-annual programming gives rise to a greater degree of certainty and stability as regards the availability of funding than annual budgeting. This is particularly relevant in the context of major infrastructure investment which takes years to complete.
Partnership has widened and deepened and has extended in some cases beyond the Structural Funds into other areas of national and regional administration. While in the 1988 reform partnership was conceived primarily as vertical relationship between the Commission and national, regional or local authorities, the horizontal dimension of partnership, including a wider range of stakeholders at local, regional and national level, has grown stronger over time. When it works effectively, partnership adds value in many ways. It stimulates ideas for projects, through partners communicating opportunities in relation to Structural Funds requirements. In programme design, it helps to focus interventions on the needs of the region or particular target group. Partnership has brought enhanced transparency, co-operation and co-ordination to the design and delivery of regional development policy.
Evaluation of Structural Funds programmes developed and improved during the 1990s, leading to greater transparency and accountability in the management of the funds.
Whereas in 1988, the emphasis was mainly on auditing the operation of the funds, the focus broadened over time to the results achieved from the expenditure carried out. The strong emphasis placed on monitoring and evaluation has been one of the central innovations of the Structural Funds. As a direct result of the Structural Funds, considerable progress has been
14
made in terms of integrating monitoring and evaluation into regional development programming across the EU.
In several member states, there was little or no culture of evaluation in economic development prior to the Structural Funds being introduced. In the past, evaluations had little impact because they were completed too late to influence the key decisions they were designed to inform. To address this problem, the current regulations specify deadlines for evaluation. Evaluations are now required to be undertaken at an ex ante stage by member states, at mid-term by member states in co-operation with the Commission and ex post by the Commission. Enhanced transparency, in terms of what has been done using regional development budgets, is among the benefits of a growing evaluation culture.
The Structural Funds provide a common international policy framework and timetable for regional development programming. As a result, a class of experts has progressively developed across Europe with a common background, culture and competences, delivering programmes which, while they vary significantly, have a core of common features. This provides scope for cross-national networking, which broadens horizons and facilitates the dissemination of the best practice.
Co-operation plays a very strong role in achieving EU added value of cohesion, since it can help overcoming existing or potential divides and enhance socio-economic integration.
Co-operation addresses a number of goals:
- by facilitating the development and implementation of joint projects of European relevance, helps re-connecting discontinuities generated by the presence of borders and barriers, especially in the field of accessibility, of labour market conditions, of research networks;
- by facilitating the enhancement of under-utilised local potentials across the borders, works as a positive sum game and contributes to the growth of European competitiveness.
There is also a so-called political added value of the cohesion policy. An important intangible effect of the Structural Funds is to make the EU more visible to citizens, enterprises, communities and public authorities. Among the perceived benefits is stronger support for European integration. “The cohesion policy makes the EU visible for citizens. Projects supported by the Structural Funds show in regions and cities of all member states that Europe cares and matters. Structural Funds are the vivid proof of the EU’s solidarity with poor and those in difficulties.” (Hübner, 2005. p. 1.) There are tangible outcomes in terms of the encouragement given to regional and local organisations to become involved in European political and policy debates and to internationalise their operations.
Future regulatory frameworks for the period 2014-2020
In October 2011 the European Commission published its proposal about the new regulatory framework of the cohesion policy in 2014-2020 (European Commission, 2011). The
15
negotiations on the whole EU budget for 2014-2020 are the subject of ongoing negotiations and discussions. In the Multi-annual Financial Framework (MFF) the Commission proposed to allocate EUR 336 billion to cohesion policy. (Table 4) It means that the amount of expenditures will not increase in the future.
Table 4
Proposed budget for the cohesion policy in 2014-2020 (2011 prices)
Type of regions or actions Billion euro
Less developed regions 162.6
Transition regions 38.9
More developed regions 53.1
Territorial cooperation 11.7
Cohesion Fund 68.7
Extra allocation for outermost and sparsely populated
regions 0.926
Source: European Commission, 2011.
Cohesion policy is to serve the Europe 2020 strategy
In order to maximise the impact of the policy in delivering EU priorities, the Commission proposed to reinforce the strategic programming process. This involves the introduction of the Common Strategic Framework, Partnership Contracts, and a menu of thematic objectives in line with the Europe 2020 strategy and its integrated guidelines.
The future cohesion policy would be closely connected to the Europe 2020 strategy, which means that the following targets should be supported (European Commission, 2010):
1. Employment:
- 75% of the 20-64 year-olds to be employed.
2. R&D / innovation:
- 3% of the EU's GDP (public and private combined) to be invested in R&D/innovation.
3. Climate change / energy:
- greenhouse gas emissions 20% (or even 30%, if the conditions are right) lower than 1990, - 20% of energy from renewables,
- 20% increase in energy efficiency.
4. Education:
- reducing school drop-out rates below 10%,
- at least 40% of 30-34 year-olds completing third level education.
5. Poverty / social exclusion:
- at least 20 million fewer people in or at risk of poverty and social exclusion.
According to the proposed regulation the following 11 thematic fields in connection with the Europe 2020 strategy should be supported by the cohesion policy:
16 - Research and innovation,
- Information and communication technologies (ICT),
- Competitiveness of Small and Medium-sized Enterprises (SMEs), - Shift towards a low-carbon economy,
- Climate change adaptation and risk prevention and management, - Environmental protection and resource efficiency,
- Sustainable transport and removing bottlenecks in key network infrastructures, - Employment and supporting labour mobility,
- Social inclusion and combating poverty, - Education, skills and lifelong learning,
- Institutional capacity building and efficient public administrations.
It can be seen that the new regulatory framework proposes a very broad spectrum of fields of intervention including energy efficiency, environmental or climate change issues. It could be problematic if national development strategies should support such fields which are not strictly connected to the main tasks of regional development. This approach could lead to a fragmented use of cohesion policy resources. At the same time, the list of interventions has a really positive message: the endogenous factors of development, human resources, innovation and institutional development receive high priority on the list of supported fields.
At the EU level, a "Common Strategic Framework" should be prepared to translate the Europe 2020 objectives and targets into concrete investment priorities for cohesion policy (supported by the same three funds which exist today: European Regional Development Fund /ERDF/, European Social Fund /ESF/, Cohesion Fund), rural development (European Agricultural Fund for Rural Development /EAFRD/) and maritime and fisheries policy (European Maritime and Fisheries Fund /EMFF/). The aim is to improve the coordination of different EU funds, make them reinforce each other around the same economic goals and maximise their added value. Harmonised eligibility and financial rules for all 5 funds are also designed to streamline financial management and monitoring.
In 2013, each member state should draw up Partnership Contract where they will assess their development needs and define their national targets for delivering on the Europe 2020 strategy. All Partnership Contracts tailored for each member state will find a single European reference frame in the Common Strategic Framework. The Partnership Contract will contain thematic objectives (member states can choose out of the menu of 11 objectives in line with the Europe 2020 Strategy); investment priorities for each thematic objective;
conditions which will be the pre-requisite to EU funding; targets that the member states plan to reach by the end of the programming period, as well as performance indicators and milestones. The Partnership Contract will constitute a firm agreement between the Commission and the member states regarding the use of funds and performance. Failure to achieve progress may lead to suspension or cancellation of funding.
According to the proposed regulatory framework the Commission is proposing conditions linked to the direct implementation of the policy. This would take the form of both
17
‘ex-ante’ conditions that must be in place before funds are disbursed and 'ex-post' conditions that will make the release of additional funds contingent on performance. Ex-ante conditions will be defined in the Partnership Contract at the beginning of the programming period. For example, a member state wanting to use EU funds to invest in water management will be required to transpose the related EU environmental legislation in full. If conditions are not fulfilled by the agreed date, the Commission may decide to suspend all or part of programme payments until such time as the necessary actions are carried out. These serious preconditions could be justified if the main goal is to create a comprehensive framework for using EU funds in accordance with strategic goals.
A second type of conditions would be linked to macroeconomic conditions. The effectiveness of cohesion policy in promoting growth and jobs depends significantly on the economic environment in which it operates. Past experience suggests that the funds in some instances have not delivered expected outcomes due to unsound macroeconomic framework conditions. Establishing a tighter link between cohesion policy and the European semester of economic policy coordination would, therefore, ensure coherence between macroeconomic policies at national level and investments through European programmes. Thus, the Commission is proposing that when a country faces economic difficulties, the Commission can invite the member state to revise its strategy and programmes. Only if the economic situation becomes so serious to undermine the effectiveness of cohesion investment, continued support from the Cohesion Fund, the ERDF the ESF, the EAFRD and EMFF will become dependent on the fulfilment of certain fiscal or economic conditions.7 This precondition could be criticised because of penalizing those actors, namely local communities, local governments, enterprises, who are not responsible for the fiscal policy managed by the central government. It is clear that harsh debates about this conditionality can be expected among the member states.
Supported regions and eligibility for funding
The proposed regulation defines 3 types of regions: less developed regions, whose GDP per capita is below 75% of the EU average; transition regions, whose GDP per capita is between 75% and 90% of the EU average; and more developed regions, whose GDP per capita is above 90% of the average. The second category would cover 51 regions and more than 72 million people, including 20 regions that are forecasted, as of 2014, to move out of the current
"convergence" objective (less developed regions), reflecting the success of the policy. The purpose of the new category is to ease the transition of these regions, which have become more competitive in recent years, but still need targeted support. It also ensures fairer treatment for regions with similar levels of economic development. In addition, supports for European territorial cooperation (cross-border cooperation, transnational cooperation, and interregional cooperation) will be maintained. However, it should be noted that only 3 per cent of cohesion policy expenditures will be spent on these activities. The Cohesion Fund will
7 This “conditionality” has already existed for the Cohesion Fund, but the process of the suspension of funding will now be more automatic and extended to all funds.
18
continue to support member states with GNI per capita of less than 90 % of the EU27 average in making investments in Trans-European transport (TEN-T) networks and the environment.
The present practice will be continued which means that each regions will be eligible for some EU funding. This approach follows the old practices based on political compromises: the net contributor countries would like to receive some money back. However, supports would concentrate on the less developed and transition regions (68 and 11.6 per cent of expenditures). It has a positive message that co-financing rates are proportional to the level of development: maximum 85% for less developed, 60% for transition and 50% for more developed regions. (Table 5)
Table 5
Division of funding and rates of co-financing in different types of regions
Region Shares of expenditures
(%) Co-financing rate (%) Population (million inhabitant)
Less developed regions 68 75-85 119.2
Transition regions 11.6 60 72.4
More developed regions 15.8 50 307.1
Source: European Commission, 2011.
To ensure that EU supports are concentrated on the priorities declared in the Europe 2020 strategy, minimum allocations are set for a number of priority areas. For example, in more developed and transition regions, at least 80 % of ERDF resources at national level should be allocated to energy efficiency and renewables, innovation and SME support, of which at least 20 % should be allocated to energy efficiency and renewables. Less developed regions will have a broader range of investment priorities to choose from, reflecting their wider development needs. But they will have to devote at least 50 % of ERDF resources to energy efficiency and renewables, innovation and SME support. In line with the EU’s commitment to inclusive growth, at least 20 % of the ESF should be allocated to promoting social inclusion and combating poverty. Minimum shares for the ESF will be established for each category of region (25 % for less developed regions; 40 % for transition regions; and 52 % for more developed regions) resulting in a minimum overall share for the ESF of 25 % of the budget allocated to cohesion policy, i.e. EUR 84 billion. The proposed ratios are partly in connection with the endogenous factors of development, however they serve different aims as well. There is a great emphasis on energy and climate policies or social cohesion. It should be noted that these goals are only indirectly connected to innovation.
The Commission proposes to fix at 2.5 % of GDP the capping rates for cohesion allocations. The explanation is that experience with the current financial framework shows that many member states have difficulties in absorbing large volumes of EU funds over a limited period of time. Furthermore, the fiscal situation in some member states has made it more difficult to release funds to provide national co-financing. So, the official argument is to ease the absorption of funding in the future. This proposal would mean a radical change in eligibility criteria. Under the original rule for the period 2000-2006, the member states had to
19
adhere to the principle that transfers received from the Structural Funds and the Cohesion Fund may not exceed 4% of the given country’s GDP.8 The maximum level of transfers for the period 2007-2013 are between 3.2398% and 3.7893% of GDP for the member states whose per capita GNI is between 75% and 40% of the EU average (Council of the European Union, 2006). Against the official arguments, the present proposal seems to be based again on EU-level budgetary constraints. In addition, it should be noted that, for several reasons, the absorption capacity could be really different in the individual countries and regions. A big debate can be predicted: it is evident that the less developed countries would like to receive proportionally higher level of transfers.
Concluding remarks
According to the long-term experiences and the latest available data published by the Eurostat, it can be seen that there has been considerable approximation between the performance of less developed member states and the union’s average development level. EU regional policy support is, of course, only part of the explanation for this process, and several other factors have also contributed to the catching up processes. The most important factors that support cohesion are the improvement of the conditions of employment and the strengthening of the economic potential of the more backward regions. The crucial element in accelerating the process of catching up in these regions is to improve the conditions of economic development, since these regions are in a disadvantageous position in every respect.
Innovation and processes of learning, as well as institutions have a key role in fostering development of the regions, ensuring the root for sustainable growth. However, it is a complex and permanent process that requires finances. It should be noted that the measures promoting cohesion are not meant to replace the EU policies driven by free market principles, but are applied parallel with and in harmony with them: the cohesion measures are a concession to interventionism, but within the general framework of the market.
Despite significant increase in the levels of funding available since 1989, the steps being taken by the EU to achieve economic and social cohesion are still very hesitant. Overall levels of funding for regional development remain low in comparison with the levels of spending in the individual states and the GNI of the EU. Because of enlargement and increasing disparities among member states, there is no reason why cuts the budget of the cohesion instruments could be justified. The costs of non-cohesion would easily outweigh any budgetary savings in the long term. Cohesion policy should play a crucial role in boosting Europe's economic competitiveness, fostering social cohesion, and creating more jobs.
EU regional policy transfers have the effect of enabling the least wealthy regions to achieve higher levels of investment in human and physical capital than would otherwise be the case, so helping to improve their long-term competitiveness. There is evidence of significant growth in GDP and a considerable reduction in unemployment compared with the case without subsidies. However, beyond its quantitative effects, the added value of the policy arises from other aspects, like the contribution made to national regional development policies by factors such as multi-annual programming frameworks, partnership, evaluation, co-
8 The original reason for introducing the ceiling from 2000 was certainly the wish to avert possibly very high GDP-dependent claims for subsidies by the new members.
20
operation between regions, and its political added value. These impacts have clearly contributed to the “Europeanization” of objectives, contents and operation of national development policies. The structure of EU cohesion policy – based on co-financing by the member states, partnership among all interested actors, and multi-annual programming – describes a policy set which is unique, when the whole spectrum of EU policies is taken into account. Indeed, it provides a framework to finance investments for sustaining development of regions based on coherent long-term programmes, conditional on a set of enforceable rules.
It has become clear, that cohesion can be better achieved if it is implemented within a multi-level governance system. Several economic reasons back this statement. Firstly, the EU policy provides the incentive for institution building and empowerment of public administrations. The achievement of some common institutional features can allow a degree of communication and co-operation among development administrations of EU member states. Secondly, the EU cohesion policy provides the adequate framework for the implementation of major EU network projects in the areas of material and immaterial infrastructure, namely transport and research, which are essential to increase EU competitiveness.
In the future, greater care must be put into creating adequate framework for national and regional authorities to design the appropriate governance of the policy, to strongly invest in institution and capacity building, to improve evaluation systems, to create true partnership with social and economic actors. Subsidiarity must be more effectively implemented, through a more clear-cut separation of responsibilities with central and regional governments playing a focal role in establishing implementation rules, allocating resources among targets, areas and projects, running monitoring and control. In this reformed scheme, the Commission could play a higher strategic role in guaranteeing for the governance system, in supervising national rules and monitoring and control systems, and in co-ordinating the horizontal co-operation among regions and member states. A role in the project selection phase could be played by the EU level for major network investments. Partnership should remain a core principle for management, monitoring and evaluation of the funds. It can add much value, particularly where the roles and responsibilities of the participants are clearly defined.
Actually, one of the principles upon which the endogenous approach rest is the mobilization of the local actors and this principle is theoretically underlined in EU regional policy programmes. In practice, there is a demand that development strategies and programmes to be developed and implemented at appropriate level of governance that consider participation of the local agents in creating a coordinated and efficient approach to the growth of the region. The main priority of the EU regional policy is to create conditions which allow self-sustaining development of the regions. Consequently, mobilisation of the human capital is taken as main driver engine in achieving this with the increasing rate of innovation. The priorities and actions defined by the member states should strengthen the regions’ capacity by supporting R&D and knowledge-intensive investment. Summarizing, the key challenge of the EU and member states is to improve the innovation capacity and R&D in the regions and encourage environment of strong regional networks between the industry, universities and research institution.
21
In the period 2014-2020 a distinction between less developed, transition and more developed regions will exist in order to ensure concentration of the funds according to the level of GDP, but every European region may benefit from the support of ERDF and ESF.
This political compromise could be criticised. The EU-level regional policy resources should be concentrated on less developed regions, the more developed regions could be supported within the framework of other policies (e.g. R & D or education programmes). In addition, the GDP per capita is the only indicator for eligibility, however, regions at the same level of development could have rather different structural problems and they would need a more differentiated approach. A more complex system of indicators should be introduced. The strict connection between the priorities of the Europe 2020 strategy and cohesion policy expenditures could also be problematic, because several fields of intervention are not really connected to the essence of regional development. The theoretical background about the role of endogenous factors of development, the importance of human resources and innovation should be taken into account more seriously and EU cohesion policy should concentrate basically on these factors in the future.
References
Bachtler, J. – Taylor, S. (eds.) (2003): The Added Value of the Structural Funds: A Regional Perspective. University of Strathclyde, European Policies Research Centre, Glasgow.
Boldrin, M. – Canova, F. (2001): Europe’s Regions: Income Disparities and Regional Policies. Economic Policy, Vol. 16 (32), pp. 207-53.
Bradley, J. (2006): Evaluating the Impact of European Union Cohesion Policy in Less- developed Countries and Regions. Regional Studies, Vol. 40 (2), pp. 189-199.
Bradley, J. – O’Donnell, N. – Sheridan, N. – Whelan, K. (1995): Regional Aid and Convergence. Evaluating the impacts of the structural funds on the European periphery.
Avebury, Aldershot.
Capellen, A. – Castellacci, F. – Farenberg, J – Verspagen, B. (2003): The Impact of EU Regional Support on Growth and Convergence in the European Union. Journal of Common Market Studies, Vol. 41. No. 4., pp. 621-644.
Council of the European Union (2006): Council Regulation (EC) No. 1083/2006 of 11 July 2006 laying down general provisions on the European Regional Development Fund, the European Social Fund and the Cohesion Fund and repealing Regulation (EC) No 1260/1999.
Official Journal of the European Union. No. L210. 31 July 2006.
Ederveen, S. – Groot, H. – Nahuis, R. (2006): Fertile soil for structural funds? A panel data analysis of the conditional effectiveness of European cohesion policy. Kyklos, 59 (1), pp. 17- 42.