Procedia - Social and Behavioral Sciences 79 ( 2013 ) 38 – 61
1877-0428 © 2013 The Authors. Published by Elsevier Ltd. Open access under CC BY-NC-ND license.
Selection and/or peer-review under responsibility of Dr. Manuel Fischer doi: 10.1016/j.sbspro.2013.05.056
9
thConference on Applications of Social Network Analysis (ASNA)
Strong Tie, Weak Tie and In-Betweens: A Continuous Measure of Tie Strength Based on Contact Diary Datasets
Éva Huszti
a, Beáta Dávid
b,c,a,*, Kinga Vajda
ba University of Debrecen, Faculty of Health, Sóstói u. 2-4. Nyíregyháza, 4400, Hungary
b Institute of Mental Health, Semmelweis University, Nagyvárad tér 4, Budapest and 1089, Hungary
c Institute for Sociology, Centre for Social Sciences of the Hungarian Academy of Sciences, Országház u. 30, Budapest and 1014, Hungary
Abstract
The contact diary method, an alternative data collecting method, is introduced. The brief summary of other methods collecting ego-centred network data (name- and the position generator) is followed by previous contact diary studies (Fu, 2007). Then our contact diary application with some results is shown. Using contact diary to collect data on egocentric networks, one can acquire a wider and more complex personal network structure. Based on our data we model a more refined continuum of categories than the so- A Strength of Tie (SoT) index is computed and compared in the two datasets.
© 2013 The Authors. Published by Elsevier Ltd.
Selection and/or peer-review under responsibility of Manuel Fischer.
Keywords: contact diary; network composition; active personal network; strong tie; weak tie; Strenght of Tie (SoT) Index
1. Introduction
When studying egocentric networks the analysis of tie strength is inevitable and the essential question is how the dichotomy of strong and weak ties is differentiated on ego researchers,
* Corresponding author. Tel.:+36-1-266-08-78; fax: +36-1-214-5685;
E-mail address: bea.david@ella.hu
© 2013 The Authors. Published by Elsevier Ltd. Open access under CC BY-NC-ND license.
Selection and/or peer-review under responsibility of Dr. Manuel Fischer
probably for practical considerations, accept the strong-weak dichotomy, but still sense a kind of continuum that connects the two ends (Böröcz & Southworth, 1995).
To our knowledge no studies so far attempted to define the strength of contacts on a continuous scale. Most researchers simply use and apply former knowledge on tie strength rather than trying to actually measure these ties (Mathews, White, Soper & von Bergen, 1988; Petróczi, Nepusz & Bazsó, 2007).
Angelusz and Tardos (1998) demonstrated that with precise a operationalization strong and weak ties can be clearly distinguished. They argue against contacts and relations that are automatically classified as one type or
another. At the same time, , they
when trying to define the different contact types (Angelusz & Tardos 1998).
1.1. Challenges in operationalization
Prior to the attempt to capture the social sphere between strong and weak ties, we first review the variables (both predictor and explanatory) worth to involve. According to Marsden and Campbell (1984),
variable referred as tie strength should be treated as an intervening variable: a variable that is in-between the predictor variables (e.g. type of relation, socio-economic background, workplace, occupational prestige) that are basically determining tie strength and the indicator variables (e.g. frequency of contact, duration of contact, proximity, mutual trust, spaciousness of the issues involved in the conversation) based on the predictor variables.
The authors also point out that certain indicators such as frequency of contact or duration of contact are unnecessary to involve in the analysis. For example, it can be misleading to consider a relationship as strong if the high frequency of contact refers to neighbors or colleagues. According to Marsden and Campbell, closeness is the only indicator which can determine the strength of relationship because it is independent of the predictors (Marsden & Campbell, 1984; Petróczi, Nepusz & Bazsó, 2007).
Ego-centric network measurements
Over the past four decades, the most important tools for measuring and describing egocentric network structures are the different types of generators. The two most popular approaches in egocentric network research are the name generators based on the works by Wellman, Fischer, Burt and Marsdenb and the position generators developed by Lin and Dumin.c Although there are relevant methodological and theoretical differences between the two methods, the main purpose in both cases is to explore the resources and the system of social support grounded in the individu (Chua, Madej & Wellman, 2009). Beside the name and the position generators we have to mention resource generators (Snijders, 1999; van der Gaag & Snijders, 2004), small world (Milgram, 1967) and -reverse small world (RSW) (Killworth & Bernard, 1978) surveys which intend to map egocentric networks.
Based on 20 studies Brewer (2000) tried to figure out the dynamics behind how respondents recall names in their networks. He found that people tend to disregard some of their relations when answering the name generator questions. Therefore he suggested that different techniques should be used at the same time to reduce the number of network members ignored or left out. This bias tends to occur in the case of stronger ties . According to Bell
et al. (2007), network,
b see also Laumann (1973); Wellman (1979); McCallister & Fischer (1978); Ficher (1982a,b); Burt (1984); Campbell & Lee (1991); Marsden (1987, 2003).
c see also Lin & Dumin (1986).
the larger the left out part. Marin (2004) examined those people who are most likely to be missed from a list. He asked college students to answer a uring the last six months whom did you discuss important matters with? (Just like the GSS core discussion network question). Then he extended this name generator with other name generators such as think of those people with whom you did something . When only one name generator was asked the average number of alters was 5.6, with assisted questions the average number of alters increased to 7.1. This study proved that simple name generators elicit only a certain number of alters (Molin, Arentze & Timmermans, 2008).
1.2. Contact Diary
Although the data based on name generators are informative, and the techniques have greatly developed in the past decades, the question still remains: what is a reliable estimate of the r personal network size (Fu, 2005). Amongst others, Fu also highlighted the biggest disadvantage of the different generators: they yield information on network characteristics but are less reliable networks.
Generators are suitable for interview settings social environment (Fu, 2007).
To bypass such problems one alternative instrument is the contact diary where researchers ask respondents to keep daily records of all their interpersonal contacts during a given period of time (e.g. a week or 100 days).
Although writing a diary is a labour- the information valuably captures a whole range of strong, medium and weak ties which may not appear in either a name g (Chua, Madej &
Wellman, 2009:9). a contact diary of a person can be viewed as a weighted random sample of members (Molin, Arentze & Timmermans, 2008:14). There is a higher probability for alters to appear in a contact diary if ego has more frequent contacts with them.
Apart from the significant pioneer studies using diary methods (Gurevitch, 1961; Pool & Cohen, 1978;
Freeman & Thompson, 1989; Lonkila, 1999), it is Yang-Chih Fu who uses a contact diary to study egocentric networks (Fu, 2005). According to Fu, it is difficult to define accurately the social networks around ego. On the one hand there are no clear boundaries around an egocentric network; on the other hand, every egocentric network has a certain dynamic, so members of network change over time.
Fu compared two methods of measuring daily contacts: 1) single-item survey, where the question was: On an average, about how many contact with in a typical day, including all those who you say hello, chat, talk or discuss matters with, whether you do it face-to-face, by telephone, by mail or on the internet and whether you personally know the person or not? (Fu, 2005:173). The answers were typical o
). It was a low cost survey with strong limitations about the information on the actual network of ego. 2) contact diary: researchers appeal provide a detailed daily account of the actual contacts they have made during a specific tim (Fu, 2005:170). Then respondents are inquired to give detailed information about every single contact and their relation to them. This method demands maximal effort, but provides the opportunity to collect rich information (Fu, 2005). According represent highly distinctive research instruments and generate contrasting forms of data
(Fu, 2005:173).
Contact diary arguments pros and cons Pros
Contacts recorded in the network diary refer to more reliable social actions which form and maintain the structure of the network than the other name generator methods. Compared to name generators which capture strong ties and to position generator and RSW (reverse small world) methods which capture weak ties, the diary method is a direct and more extensive method measuring egocentric networks and eliciting all kinds of different ties at the same time. Subscribed groups of alters mostly aggregate from ties that are close to ego. The diary method on the other hand encompasses distant ties as well. Despite of the obvious risks and limits, the network diary encompasses both strong and weak ties. The diary reveals which ties of ego are weak and how intimate close alters change the contact with ego (Killworth, Johnsen, Bernard, Shelley & McCarty, 1990). With a well- structured network diary the problem of remembering and recalling daily contacts can also be reduced. The
network diary approach yields , opposed to the generator
methods where the biggest disadvantage is that they mostly reveal alleged relations. The contact diary method allows researchers to collect the actual contact data regarding the individual network (Fu, 2005).
nformation that comes from the contact diary is rich and detailed. Data can be used for detailed analysis on both the contact and the individual level, too. Since an individual network is dynamic, contacts as well as the network itself are constantly being formed by the interactions and actions. The diary method is an attractive, alternative and practical approach to understand the dynamics of
Cons
Filling the diary is not just time consuming but it is a big favor to ask from the participants. One can ask participants to fill the diary as long as they can, or ask them to do it for a fixed, shorter period; this is easier for them, but will yield less information. In previous studies the research period was settled between 7 (a week) to 100 days. Some researches do not define time but ask the participants to name 100 contacts (Fu, 2007). Some say
that such a short period (i.e. a
more reliable picture (Feld, Suitor & Hoegh, 2007). Pool and Kochen (1978) also argued that patient and long data collecting period was necessary, because one week cannot be taken as an average, unusual things may intervene. Since the network diary only contains alters that ego meets in a certain time interval, it cannot be used to study network for longer time and globally. According to Fu those contacts that are not elicited during the be counted as (Fu, 2007). In our research it was possible to note those alters who were important to ego but were not contacted during the examination period (see Lonkila, 1999).
Furthermore, it is more likely that participants recall contacts that are either longer in time or emotionally intense.
Fu noted that thorough planning of the diary as well as assistance can reduce such problems to minimal (Fu, 2007).
According to Freeman and Thompson (1989) the diary method is too tedious and expensive to use for empirical studies. It cannot be used for large and representative samples, and it is not possible to determine the ideal period during which participants have to fill the diary. Fu argues that small number of elements and informative diaries can yield valuable results and illustrate certain aspects of personal networks (Fu, 2007).
Finally, using the diary method to collect data about personal networks might also raise ethical problems since in many cases there are more information about alters than egos.
1.3. Strong tie - weak tie
The previously mentioned study of Marsden and Campbell (1984) was repeated by Mathews and his colleagues in 1998. They measured the strength of ties with a 13- The items were related to four factors, namely: intimacy, (Petróczi, Nepusz & Bazsó, 2007:40).
Wegener used a multidimensional system of indicators in such a way that on the one hand, he made respondents categorize alters into different type of relationship (mother, father, spouse, sibling, etc.), and on the other hand, he asked them to place the alters on a ten-point social distance scale. Name interpreter questions were also added such as duration of acquaintanceship or frequency of keeping contact. Besides this, Wegener even examined the activities which respondents did with the persons contacted (Wegener, 1991; Böröcz &
Southworth, 1995).
Compared to the -s strong-weak dichotomy, using a multidimensional methods is evidently an improvement. Operationalizi
categorizing of people to groups, certain components has the same problems than the simple dichotomy: e.g.
long period of time together can be in inverse ratio to the intensity of emotio (Böröcz & Southworth, 1995:27)
Following the citation above, but relying on an even richer data from the contact diary, we try to describe the social sphere between strong and weak ties as detailed as we can. Before doing so in Table 1 we first summarise the different dimensions of strong and weak ties.
Table 1. Different characteristics of strong and weak ties
Dimensions Strong tie Weak tie
Definitions
(Granovetter, 1973; Marsden &
Hurlbert, 1988; Wellman &
Worthley, 1990:581 quoted Albert & Dávid, 2001;
Angelusz & Tardos, 1991:82)
daily, mostly intensive, close, intimate contacts;
-close nuclear family ties (parents, children, spouses, siblings) -(close) relatives
-confidential, intimate friends with frequent contacts
Strong ties that at least 2 statements are true: intimacy, voluntary, multiplexity.
loose contacts, acquaintanceships, which compose a bridge to those valuable contacts which cannot be reached by strong ties; provide information;
neighbours, teachers/professors, fellow colleagues, business partners, fellow employers/bosses, fellow soldiers, distant acquaintanceships, friends who are introduced by relatives
Quantity below 10 many
Density dense: everybody knows everybody low density
Multiplexity Large small
Bridge role little probability high probability
Homophily or heterophily (Angelusz & Tardos, 1991)
contacts which foundation on the same stature (age, qualification)
heterophil contacts, potentially expansive resources
Integration level of micro-society level of macro-society
Language code limited/restricted detailed/worked out
Activity expressive (want to save he/she has) instrumental (want to catch sg.)
Social visibility close open to the world
Social status low high
Edited by the authors. References: Angelusz, 2009, cited in Gyarmati, 2009:55.
As shown in Table 1, and as it appears in empirical studies, the most common approach is that family ties and close friends are defined as strong, acquaintances or distant friends as weak ties (Erickson et al., 1978;
Granovetter, 1974; Wilson, 1998).
As Petróczi and her colleagues Often, researchers use the notion of weak or strong ties (e.g., Feld, 1997; Friedkin, 1980; 1982; Haythornthwaite, 2002; Roch et al., 2000) as grouping variables. In many papers, it is rather unclear how the researchers obtain information regarding the strength of interpersonal ties. Few notable exemptions are, for instance, Hansen (1999), Harkola and Greve (1995), Mathews et al. (1998), Plickert et al.
(2005), Podolny (2005), and Wellman and Frank (2001). Even in research projects, where authors quantified their tie-strength from related variables in their data set (e.g., Mitchell, 1987; Plickert et al, 2005; Wellman &
Frank, 2001), the final outcome was nominal data, unsuitable for many types of statistical analysis, including sophisticated graph theoretical methods available for weighted graphs. (Petróczi, Nepusz & Bazsó, 2007:41).
According to Granovetter (1973, 1974) there are basically four indicators which define the strength of tie: 1) intimacy; 2) emotional intensity of the relationship; 3) frequency of interactions; 4) reciprocal services. Petróczi, Nepusz and Bazsó (2007) offer an excellent review of the many attempts that have been made to find valid indicators and predictors of tie strength: intimacy/closeness; multiplexity; frequency of contact; reciprocity;
reciprocal emotional support; social homogeneity; shared affiliation and social circles . (Petróczi, Nepusz &
Bazsó, 2007:40)
From the Hungarian studies, we mostly rely on the research and operationalization of Angelusz and Tardos (1991) to define types of tie strength. The two authors treated strong and weak ties logically separated and made them independent from each other. To measure weak ties, using principal component analysis, they compiled a complex index. To this, they used the following indices: 1) number of contacts as occupations; 2) contacts as occupational prestige value; 3) estimated numbers of acquaintanceship; 4) number of postcards sent (at Christmas). The order of indices counts as weight of the factors in principal analysis. Angelusz and Tardos also constructed another complex index to measure strong ties using the following indices: 1) multiplexity as one of the most accepted criterion of contact s strength; 2) intimacy of contacts (speaking about private themes); 3) members of close family (parents, spouses, children) as basically strong ties; 4) important contacts (multifunctionality, intimacy, physical availability; frequent meeting). After defining strong and weak ties, the authors distinguished four types in two dimensions: 1) poor in contacts (rates of both strong and weak ties are below average); 2) dominant strong tie (strong ties are above average; weak ties are below); 3) dominant weak tie (average number of strong ties; weak ties are above average); 4) rich in contacts (rates of both strong and weak ties are above average).
2. Method
In this paper our aim is to offer a more precise description of the structure of the social sphere based on data using the contact diary method. With more distinct categories we want to reveal what is between strong and weak ties.
work, the most important features of the contact diary compiled by Angelusz and Huszti are the following. Basically the diary is self-administered, but before this a face-to-face introduction is provided and if needed the s available anytime throughout the data collection period. The data collection period lasts for 7 days (one week), a length which is still acceptable for the
participants, and it ensures ive network ties and
relations. With the diary, a one-page manual with practical tips is provided to help eliciting contacts and names.
Contacts are defined as all kinds of one-to-one contacts that lasted at least 5-10 minutes, or shorter contacts shorter that were however considered important for the respondent. Contacts include saying hello, chatting, talking, meeting, or sending/receiving a message; it can occur face-to-face, over the phone, on the Internet, or by other means of communication.
The outlook of the diary log is easy to follow and fill in by the participants (see Appendix A). It is an 18 pages long booklet with a two-pages cover for each day. A day is divided into three periods (morning, afternoon and evening) to let participants elicit names and contacts more easily. There are 15 name-generator questions for each alter. No matter how many times an alter is mentioned (i.e. more than once a day or week), the name generators should be filled out only once. The last two extra pages are devoted to important but not active persons: for persons who are very important for the respondents but for one reason or another were not mentioned during the seven days period in question. In our research 8 % of the alters belonged to this group. On the one hand this
suggests , on the other it shows that it is still important to add
such an extra name generator situation in order not to leave out a very important but less active segment of egocentric network.
2.1 Data collection
Our results are based on two different datasets: one is a so called general population sample in Nyiregyhaza;
the other is a special sample of Roma college students studying in Budapest. The Nyiregyhaza data collection is based on a sample which was used in a panel survey to study quality of life in Nyiregyhazad. This sample contained inhabitants of Nyiregyhaza older than 18. They were chosen by random sampling. The sample contained 2000 people supplemented with an extra-sample with further 400 inhabitants. The sample was representative for gender. Our diary research sample was partly compiled from this previous survey. We carried out the data collection in two phases, i.e. in spring 2010 and autumn 2011. In each period 200 people were chosen independently to fill in the contact diary. As a result, , 67 diaries were completed. To reach a minimum of 100 contact diaries further people with similar gender criteria were selected. As a result 75 more diaries were filled out. For our research purposes altogether 142 diaries were analysed; in these cases the data from the name generator questionnaires were also available.
In both cases the data collection procedure was the same: first, we trained social work students to be interviewers. They were familiar with the structure of the diary and learnt how the diary should be filled. Then they went to all the given addresses where at first they filled the questionnaires with the name generator questions. Then the interviewer informed the respondent what the diary is about and how it works. They could assist the respondents and fill the first pages of the diary together. If needed, the interviewer went back to the respondents at least once during the week of the data collection period to give further information and help. At the end of the week, when they collected the completed diaries, they had to check it and make corrections if necessary.
Budapest Roma college students
The sample in Budapest was not only smaller but much more homogeneous than in Nyiregyhaza. In 2011 the Hungarian Jesuit province together with representatives of other Christian churches and the Hungarian
d It is a town in North-East of Hungary with about 120 000 inhabitants.
government established a broad network of four Roma colleges. The Christian Roma Collegium Network is established to provide Roma students enrolled in higher education with accommodation, mentoring and additional courses to complement their studies. Since the program bears great societal relevancee and impacts the Institute of Mental Health (Semmelweis University), the strategic research partner of the colleges has initiated a panel research design, in which, from 2012 on, the students from all the colleges will be followed for up to four years. In the Jesuit Roma College we piloted our research design. This consists of three sub-researches: a value study with self-administered questionnaires, in-depth interviews and the contact diaries.
nvolvement was problematic because of ethical issues: students were afraid and mistrustful that the names elicited in the diary can be easily identified and misused. The layout of the two contact diaries were almost identical thus to make results more comparable. Contrary to the Nyiregyhaza data collection interviewers were not involved in Budapest. Roma students filled the diary themselves; they were only informed once the diaries were distributed. 18 diaries were filled out and returned.
As a part of the follow-up study, we will repeat data collection in four consecutive years. Feld et al. (2007) strongly suggested repeating for two reasons: it brings less burden for the participants changes in the personal networks can be studied. With the panel design we plan to follow the dynamic change in R
network. We study (1) which ties remain or diminish; (2) how the parameters of the ties change; (3) what the extension of ties will be; and (4) how the whole network structure changes.
3. Results
Socio-demographic characteristics of the respondents (egos)
In the Nyiregyhaza sample, the average age was 45 years, the rate of females was 58%. Most respondents completed secondary school. Based on age and level of education, all categories of the population were represented (see Appendix B).
In the student sample of the Jesuit Roma College the rate of females was 56%, the average age was 21 years.
All respondents finished secondary school. In this sense it is a much more homogeneous sample. Considering their marital status, everybody is single.
Socio-demographic characteristics of the alters
Nyiregyhaza sample: in the 142 diaries, the rate of female alters is 53%, average age is 41 years, and the largest proportion has completed secondary school (see Appendix C)
Budapest sample: in the R the rate of female alters is 55 %; average age was 27 years.
Network size
On average, Roma students named 26 alters in a week, while participants in Nyiregyhaza wrote down only 18.
The minimum entry was 6 and 2 respectively, the maximum number of alters was 93 and 43 (see Table 2).
e http://www.jesc.net/2011/10/the-church-and-the-eu-roma-strategy/ The Roma people in Hungary similar to other European countries live in very disadvantageous circumstances, face the highest rate of inactivity and unemployment: latest income data indicates that 70% of the Roma in Hungary are poor. Educational attainment is extremely low although in recent years the proportion of Roma students at secondary school institutions providing a school-leaving certificate has risen from 9 to 15 per cent. In the biggest minority group (estimated size is between 520-650 thousand) only 0.3 % hold a university or college degree. (for more details see:
http://ec.europa.eu/social/main.jsp?catId=1025&langId=en&newsId=1407&moreDocuments=yes&tableName=news).
During the survey week people in Nyiregyhaza named 38 meetings on average. For the Roma sample the average number of contacts was 54.
Table 2. Network size
Nyiregyhaza general population
N=142
Budapest Roma college students
N=18
Total number of alters 2580 468
Total number of contacts 5451 965
Mean number of alters 18,17 26,06
Std.dev. 12,73 9,68
Min 2 6
Max 93 43
Mean number of contacts 38 53,61
Std.dev. 21,53 21,42
Min 3 15
Max 126 93
The Roma college students mentioned people in their networks more frequently. The reason might be their younger age, their higher educational background and their way of living: college students lead a more sociable life living in dorms, going to classes, clubs and being involved in different activities. The average number of alters is more balancedf than in the Nyiregyhaza sample. In Nyiregyhaza the extremities are higher: there are people that are almost totally isolated while some are rich in social contacts. In the Nyiregyhaza sample it is also possible to compare the number of alters elicited with the name generator and with the contact diary, and to see the overlaps and the differences. Only every third alter (31%) mentioned in the diary was also mentioned in name generator network. This means that the bigger proportion of the diary contacts (69%) were revealed as new contacts compared to the name generator.
4. Analysis
To fulfil our goal to draw a more detailed picture of the social sphere between strong and weak ties, we applied principal component analysis in our research. We excluded alters whom the respondents did not meet during the examined week since some of the name interpreter questions were not applicable for these alters.
f The standard deviation in the Roma sample is smaller.
Table 3. Characteristics of contacts (frequencies of variables included in principal component analysis) Nyiregyhaza
general population
Budapest Roma college students
N % N %
1=dislike very much 2
3 4
5=like very much
24 94 513 805 889
1 4 22 35 38
3 18 66 107 217
1 4 16 26 53 variable)
less than monthly (1) monthly (2)
more than once a month (3) weekly (4)
more than once a week (5) every day (6)
234 161 386 374 479 681
10 7 17 16 21 29
29 13 31 78 117 146
7 3 8 19 28 35 Number of meeting during examined week*
(3. independent variable) 1 2 3 4 5 6 7
147 4
334 170 132 108 50 200
60 14 7 5 4 2 8
258 75 27 18 12 15 15
61 18 6 4 3 4 4 Intimate contact (4. independent variable)**
0=not at all 1 2
3=very much
128 680 758 737
6 29 33 32
24 170 160 57
6 41 39 14 *Number of records in the diary regarding the given alter.
** For more details see above.
As the principal component analysis needs to use high measurement level variables, we created the INTIMATE variable using three originally nominal variables. These were the following: 1) ego has been to house (yes-no); 2) ego talked with alter about private issues (yes-no); 3) ego spoke to alter face-to-face (yes-no).
We considered an ego-alter contact as intimate if ego ha talked to alter about private issues and spoke face-to-face during the studied period. On the contrary, we did not treat an ego-alter dyadic contact as intimate if ego had not been to house, ego did not speak important issues with alter and their contact was not face-to-face during the given period. This newly composed INTIMATE variable was the fourth explanatory variable in the principal component analysis.
In spite of all the differences the distribution of variables in the two samples is rather similar (see table 3). This is particularly true for the frequency of speaking and numbers of meeting during the examined week. We measured larger deviation in case of the other two variables. In the Nyiregyhaza general sample where respondents were elder, and thus they had more contacts which exist for a longer period, their contacts with alters was rather intimate (very intimate 32% versus 14%). At the same time, for young college students it was more important to enjoy their rank these relationships on the basis of this feeling (like very much to be with alter company 53% versus 38%).
All variables used in the principal component analysis scored the required communality rates (above 0.25).
The explained variance in the Nyiregyhaza model was more than 50%; in the Budapest model it was almost 50%
(see appendix D). In both samples the most influential variable with the highest communality score was the intimacy variable (Appendix E). It is also noteworthy that for both samples the order of the variables in the component matrix was also identical: how intimate the contact was, frequency of talking, and number of meetings during the examined week. The least important variable was how one generally felt towards the person.
5. Discussion
Strong tie, weak tie and in-betweens
The SoT index (Strength-of-Ties index) generated by the principal component analysis assigns a value to every single alter which then is regarded as the tie strength of any given ego-alter contact. The higher the value of the SoT index, the stronger the contact between ego and alter. In the Nyiregyhaza general population sample, for the 2238 alters the value of this index ranged between -1.99 to 2.68, while in the Budapest Roma college
the value of this index ranged between -3.2 to 2.4. In this latter sample, the range of the SoT index was higher on both, the positive as well as the negative side.
Tie strength of dyad contacts were calculated for each type of relation describing the tie between ego and alter in order to give a finer and more precise description of the egocentric network structure. Instead of the usual two- pole world, where the division is simply between strong and weak ties, a more detailed picture is drawn. In this way the less significant differences became tangible and an apparent sequence of tie types could be identified: the range of ties from the strong ties, across rather strong ties and rather weak ties to absolutely weak ties.
In Table 4, we indicated the frequency of the different types of ego-alter relations in both of our samples.
From this, we can see that certain types of relations do not or hardly appear in the R
network: there are fewer numbers of neighbours, colleagues and contacts in the service sector. At the same time, only Roma students named college mates as contacts. Compared to the Nyiregyhaza general sample, the rate of close friends is double among alters named by students (30% versus 15%). In the general population the rate of close-kin ties (mainly because of spouses or partners), present neighbours, present colleagues and contacts that are linked to workplaces are higher. In the Nyiregyhaza ego-networks every tenth contact is related to some kind of service.
Table 4. Type of relation between ego and alter (predictor variable) Nyiregyhaza general population
Budapest Roma college students
N % N %
Close kin-ties (parents, children, spouse, siblings); partner
484 19 54 11,5
Other kin relations 361 14 49 10,5
Neighbour (total)
present Former
239 159 80
9 6 3
6 2 4
1,5 1 0,5 Colleague (total)
present Former
403 316 87
15 12 3
19 8 11
4 2 2 Schoolmate (total)
present Former
107 47 60
4 2 2
68 52 16
14 11 3 Teacher
present Former
12 6 6
0,4 0,2 0,2
26 3
6,5 6 0,5
Close friend 393 15 135 30
Acquaintance 17 0,7 13 3
Contact connected to workplace/school 171 7 13 3
College mate - - 62 13
Service sector (postman, hairdresser, shop assistant, doctor, nurse, pharmacist, etc)
259 10 12 3
total number of alters 2580 464g
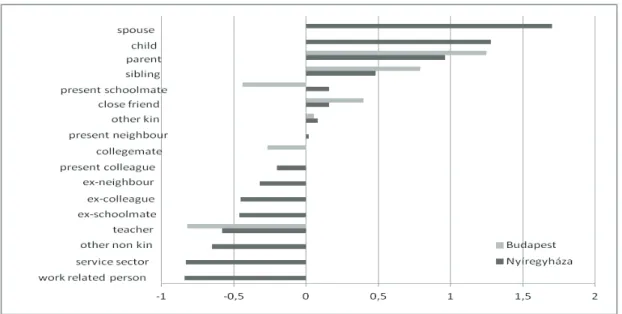
We also examined the connection between the predictor variable (type of relation) and the SoT index by using Anova. Not only has the connection between the two variables a similarly significant and strong explanatory power in both samples (see Appendix F), but from Figure 1 we can see that the order of the types of relations regarding tie strength is also similar. This result confirms our initial concept that it is possible and meaningful to distinguish the different types of relations on a more sophisticated scale where there are more choices than simply strong and weak.
gIn case of four alters the type of relation was not identified. In Table 2. the total no. of alters was 468.
Fig. 1. SoT index of the type of relation in the two samples Strong ties
In Figure 1 on the right side of the scale there are the so called classical strong tie relationships: spouse, child, they are in a very intimate relation, often meet and talk frequently. For the Roma students, since they are single and childless, parents and siblings are the closest and strongest ties.
Rather strong ties
In both samples (especially in the Roma sample) close friends are strong ties. In a younger age the strength of these ties are stronger, with older age they seem to lose their importance but still remain essential and relevant connections. Other kin relations are also considered as strong ties but the strength of these ties are incomparably weaker than any other kin ties. Interestingly the only difference in the two samples is how present schoolmates are treated : for the Roma college students they are probably important but nonetheless weak ties, whereas for respondents in the general population these relations are less important but still regarded as strong ties. For them these ties are more homogeneous while for the Roma students most of these schoolmates are still strangers.
Although it is probable that during the years spent in higher education a few of these schoolmates will become closer and turn to be friends while the rest remain less important weak ties. Present neighbours with almost undetected tie strength (the average value is almost 0) are the typical either/orties: for some (probably old people) they are strong ties while for others it is just an irrelevant category . In this respect gender homogeneity is a significant explanatory factor: neighbour ties are strong if the respondent and the alter are both of the same sex.
Rather weak ties
In the R - and college mates; at present these are strong
weak-
contrary they might even get weaker.
In the general population where more different relational types can be analysed, present colleagues as well as all the ex -es, ex-colleagues, ex-schoolmates and ex-neighbours are the important or classical weak ties. The role of present colleagues partly confirms these observations that suggest a decrease in the level of commitment and
gues. With special former ties time is a relevant aspect to consider when tie strength is discussed: with time passing certain tie-weakening or some kind of erosion seems unavoidable, but these ties still remain visible and are at hand when needed.
Weak ties
At the left end of the line (Fig.1) weak and less important weak ties can be identified. These are teachers, other non-kin relations, persons who are connected to workplace and relations, and can be categorised as people working in the service sector. In this last group there are for example the postman, hairdresser, shop assistant, doctor, nurse, pharmacist, and so forth.
Besides the simple comparison of the two samples on the basis of tie strength it is also challenging to study the difference of egocentric networks based on gender and age group of the respondents. Are there any diversions in the nature of different types of relation and if yes, what are these differences? Since the Roma student sample was too small, this kind of analysis was only done on the Nyiregyhaza general sample.
Differences on the basis of gender and age of the respondents
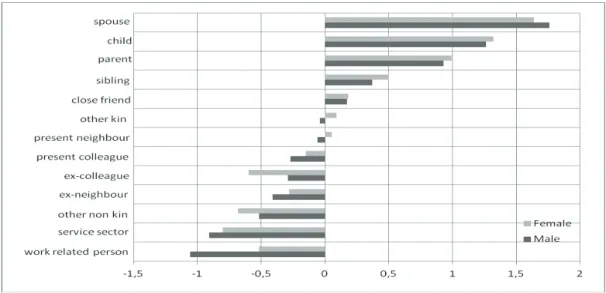
With respect to the SoT index we found significant differences by (Fig.2) (for Anova, see Appendix G).
Fig. 2. SoT index of the type of relation by
Women have a little bit stronger contacts with members of the close family than men, which primarily can be explained by the fundamental roles based on gender. However, in the case of spouses are stronger. This is in accordance with name generator surveys where men treat their spouses as more intimate contacts than women. Relations to other kin are also stronger among women which can also be explained on the basis of traditional women roles: one of their most important tasks is keeping the family together and maintain good relationships with family members. The strength of contacts with close friends does not differ. Thus, on the one hand it is confirmed that intimacy also plays an important role in friendship, and on the other hand contacts with close friends have similar content for men and women. It would be interesting to extend to study the contents of meeting and talking with friends. Strong relations with present neighbours are more typical among women. For women, the relation with present neighbours is positive, while for men this relation appears on the negative side. Relations with ex-neighbours are negative for both men and women, thus they are weaker ties than present neighbours. Contact with both present and ex-colleagues is considered a weak tie, but women have less weak relations with present colleagues, while for men the connection with ex-colleagues is stronger.
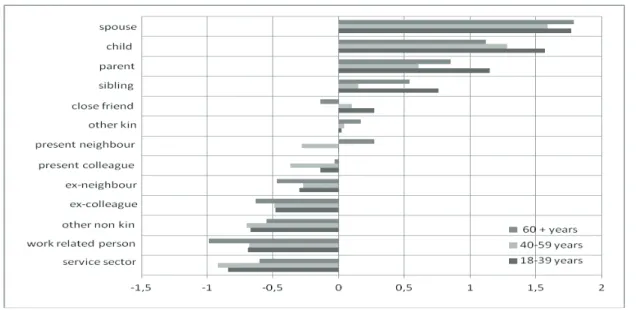
Fig. 3. SoT index of the type of relation age group
see that the connection with spouses is the strongest for young (18-39 year old) and elder (60<) respondents (for Anova, see Appendix H). For young people the feeling of new and undiscovered emotions influence the strength of these ties, while for elder people it is the feeling of affection and the shared past that make these ties stronger.
For young people the connection with children is the strongest and this value decreases with progressing age.
In the parent-child relation one of the most important factors is how often they meet. The child-parent relation is
the strongest at because they
meet daily and discuss important things; 2) the relation to their parents can become stronger when they either support each other or spend more time together, with more frequent talking and
meeting. Connections with siblings are stronger among young and elder respondents. The role of the family of
orientation n everybody needs this kind of
support. The importance of other kin ties increases with age, thus the relation with them becomes stronger. Unsurprisingly, the relation with close friends is the strongest in the young age group. It is in elderly people where present neighbours play the most important role. Their connection with neighbours is stronger and is even more increased because of the physical closeness, of the
. The connection to neighbours is weakest among the middle-aged, which can be explained by lack of time. In their cases connections with present neighbours are also negative. Relations with present colleagues are on the negative side in every age group, but middle- heir colleagues can be qualified even weaker than among the young.
6. Conclusion
With this paper our aim was to offer a more precise description of the structure of the social sphere by using network data from contact diaries. With more distinct and explicit categories we wanted to reveal what there is between strong and weak ties. Our concept and hypothesis was examined on two completely different datasets still yielding very similar results. Therefore we are quite convinced about the reliability of the contact diary as a method for studying egocentric networks. On the other hand we are aware of the issue of validity. Calculations from the general population dataset verify our conviction that contact diary data reveal a larger network structure where more numerous, especially weak (non-kin) ties are elicited. In the general population sample the rate of kin ties based on name generators was 51 %, while it was only 31 % based on the contact diary dataset.
The other focus of our research was to model and calculate tie strength. Our index measuring tie strength (SoT index) was calculated based on the type of relation between ego and alter. The contact diary features (with daily division), the complementary name generators and the valid network structure all promoted our operationalization techniques. Apart from the variables generally included (like each other in general, and frequency of talking) we introduced other explanatory variables such as number of contacts in the given week and the level of intimacy. The latter was operationalized on the basis of three dummy variables. On the other hand we have to note that neither multiplexity nor reciprocity measures were included in our model. As a result of our analysis, instead of the usual two-pole world where the division is simply between strong and weak ties, we described a more detailed social environment of ties. In this way less significant differences became tangible and an apparent sequence of the tie types was identified: strong ties, rather strong ties, rather weak ties and weak ties.
The future potentials of the method lie in the panel research we initiated among the Roma colleges across the country. With the four year follow up design we will study the dynamic changes of the R
(1) which ties are strengthen or fray; (2) how the parameters of the ties change; (3) what will be the extension of ties; (4) plus how the whole network changes. This will provide a convincing argument that repeated surveys of the smaller community can produce nationally consistent results. For the Nyiregyhaza general population sample, where more and different data are available, the wide range of network measures and indices can be used to explain other, important independent variables such as subjective health, quality of life or level of satisfaction.
Acknowledgements
We would like to thank Professor Yang-Chih Fu for his patient guidance, advices and useful critiques on the previous version of our paper. We are grateful to Ildikó Barna for her statistical guidance and help.
References
Albert F. & Dávid B. (2001). Budapest, Új Mandátum.
Angelusz R. & Tardos R. (1991). Társas kapcsolatok. Budapest, Gondolat.
Angelusz R. & Tardos R. (1998). Társadalmi Riport
1998. Budapest, Tárki.
Bell D.C. & B.Belli-McQueen & A.Haider (2007). Partner naming and forgetting: Recall of network members. Social Networks, 29, 279-299.
Böröcz J. & Southworth, C. (1995). Kapcsolatok és jövedelem. Magyarország 1986 87. Szociológiai Szemle 2.
Brewer DD. (2000). Forgetting in the recall-based elicitation of personal and social networks. Social Networks, 22, 29-43.
Burt, R.S. (1984). Network Items and the General Social Survey. Social Networks, 6, 293-339. http://dx.doi.org/10.1016/0378- 8733(84)90007-8
Campbell, K.E. & Lee, B.A. (1991). Name Generators in Surveys of Personal Networks. Social Networks, 13, 203-221.
Chua, V. & Madej J. & Wellman B. (2009). Personal communities: The world according to me.
http://homes.chass.utoronto.ca/~wellman/publications/personal/handbook-community.pdf
Erikson, BH. et al. (1978). The flow of crisis information as a probe of work relations. Canadian Journal of Sociology, 3, 71-87.
Feld, S.L. (1982). The Focused Organization of Social Ties. The American Journal of Sociology, 86, No.5, 1015-1035.
Feld, S. L. & Suitor, J. L. & Hoegh, J.G. (2007). Describing Changes in Personal Networks over Time. Field Methods, 19, 218-236.
Fischer C. (1982a). To Dwell Among Friends. Berkeley: University of California Press.
Fischer C. (1982b). Social Network, 3, 287-306.
Freeman, C.L. & Thompson C.R. (1989). Estimating Acquaintanceship Volume. In: Kochen, M. (ed): The Small World. (pp. 147-158) Norwood. NJ, Ablex.
Fu, Yang-chih (2005). Measuring personal networks with daily contacts: a single-item survey question and the contact diary. Social Networks, 27, 169-186.
Fu, Yang-chih (2007). Contact Diaries: Building Archives of Actual and Comprehensive Personal Networks. Field Methods, 19, 194-217.
Fu, Yang-chih (2008). The immediate Returns on Time Investment in Daily Contacts. Exploring the Network-Overlapping Effects from Contact Diaries. In: R.M. Hsung, N. Lin; R. Breiger (Eds), Contexts of Social Capital. Social Networks in Markets, Communities and Families. Routledge, Taylor and Francais Group. New York, London.
Granovetter, M. (1973). The Strength of Weak Ties. American Journal of Sociology, Volume 78, Issue 6. 1360-1380.
Granovetter, M. S. (1974). Getting a Job. Study of Contacts and Careers. Cambridge: Harvard University Press.
Gurevitch, M. (1961). The social structure of acquaintanceship networks. Massachusetts Institute of Technology.
Gyarmati A. (2009).
Információs Társadalom, 9. évf. 4. sz. epa.oszk.hu/01900/01963/.../infotars_2009_09_04_055-069.pdf Killworth P.D. & Bernard, H.R. (1978). The rewers small-world experiment. Social Networks, 1, 159-192.
Killworth P.D. & Johnsen E.C. & Bernard H.R. & Shelley G.A. & McCarty C. (1990). Estimating the size of personal networks. Social Networks, 12, 289-312.
Laumann E. (1973). Bonds of Pluralism. New York: Wiley.
Lin, N. & Dumin, M. (1986). Access to occupations through social ties. Social Networks, 8, 365-383.
Lonkila, M. (1999). Social Networks in Post-Soviet Russia. Continuity and Change in the Everyday Life of St.Petersburg Teachers. Helsinki, 1999. ISBN 951-45-8742-1 (PDF version) Helsingin yliopistion verkkojulkaisut.
Marin, A. (2004). Are respondents more likely to list alters with certain characteristics? Implications for name generator data. Social Networks, 26, 289-307.
Marsden, P.V. (1987). Az amerikaiak fontos beszélgetési hálózatai. In: Angelusz R. & Tardos R.: Társadalmak rejtett hálózata. 1991.
(pp.353-370) Budapest, Magyar Közvéleménykutató Intézet.
Marsden, P.V. & Campbell, K.E. (1984). Measuring Tie Strength. Social Forces, 63, 482-501.
Marsden P.V. & Hurlbert, J.S. (1988). Social Resources and Mobility Outcomes: A Replication and Extension. Social Forces, 66, 1038-1059.
Marsden. P.V. (2005). Recent Developments in Network Measurement. In: Carrington P.J.-Scott J.-Wasserman S. (edit): Models and Methods in Social Network Analysis. Cambridge University Press.
Mathews KM., & White MC., & Soper B. & von Bergen CW. (1998). Association of indicators and predictors of tie-strength. Psychological Reports, 83, 1459-1469.
McCallister, L. & C. S. Fischer (1978). A procedure for surveying personal networks. Sociological Methods & Research, 7, 131-148.
Milgram, S. (1967). The Small-World Problem. Psychology Today. Vol. 1, no. 1, 61-67.
Molin, E. & Arentze, T. & Timmermans, H. (2008). Eliciting Social Network Data. Paper presented at the International Conference on Survey Methods in Transport: Harmonisation and Data Comparability, France, May 25-31.
Petróczi A. & Nepusz T. & Bazsó F. (2007). Measuring tie-strength in virtual social networks. Connections, 27 (2), 39-52.
Pool I. de S. & Kochen, M. (1978). Contacts and influence. Social Networks, 1, 5-51.
Snijders, T.A.B. (1999). Prologue to the measurement of social capital. La Revue Tocqueville, 20 (1), 27-44.
Van der Gaag, M. & Snijders T. (2004). Proposals for the measurement of individual social capital. In: Flap, H.D. & Völker B. (eds.):
Creation and returns of Social Capital. (pp.199-218) London: Routledge.
Wegener, B. (1991). Job Mobility and Social Ties: Social Resources, Prior Job, and Status Attainment. American Sociological Review, 56, 60-71.
Wellman, B. (1979). The community question. American Journal of Sociology, 84, 1201-31.
Wellman, B. & Wortley, S. (1990). Different strokes from different folks: community ties and social support. The American Journal of Sociology, 96, 558-589.
Wilson, T.D. (1998). Weak ties, strong ties: network principles in Mexican migration. Human Organization, 57, 394-405.
Appendices Appendix A
Name interpreter questions used in the diary:
1. demographical data gender age
is he or she Roma? (used only in the R educational qualification
occupation place of residence
2. questions concerning about relationship
how long ego knows alter (1=just met for the first time, 2= for a couple days, 3= for weeks, 4= for months, 5= for years)
nature of the relationship (1=spouse, 2=parent, 3=child, 4=brother/sister, 5=other relatives, 6=former neighbor, 7=current neighbour, 8=former classmate, 9=current classmate, 10=former teacher, 11=current teacher, 12=former colleague, 13=current
home (yes-no)
frequency of conversation (1=daily, 2=weekly, 3=more times a week, 4= more times in a month, 5=monthly, 6=less than a month)
In general how much does ego enjoy to be in alter ? (in scale from 1-5) does ego discuss important things with alter? (yes-no)
3. Questions describing the specific meeting
home, 2=workplace/school, 3=place of business (bank, post office), 4= public place (street, restaurant, home
form of the conversation (1=personal, 2=telephone, 3=chat/Skype/e-mail)
who initiated the conversation (E=ego, A=alter, SE= somebody else, -=no one, accidental meeting)
number of people during the conversation (apart from ego)
content of the conversation: such as confidential, personal, politics, actualities, sport,
TV shows etc. (used onl )
Appendix B
Socio-demographic characteristics of Respondents (egos)
Nyiregyhaza general population
Roma college students
N % N %
Sex
Male Female
58 78
42 58
8 10
44 56 Age
20-29 years 30-39 40-49 50-59 60-69 70<
26 32 23 23 19 17
19 23 16 16 14 12 Education
Max.elementary Middle school High school
12 78 41
9 60
31 18 100
Marital status
Single Married Common-law marriage Divorced Widowed
24 83 8 10 11
18 61 6 7 8
18 100
Economic activity
Active Unemployed Retired Other (student, dependant)
76 18 21 27
53 13 15
19 18 100
Appendix C
Socio-demographic characteristics of Alters
Nyiregyhaza Roma college students
N % N %
Sex
Male Female 121
2 136 4
47 53
212 256
45 55
Age
<20 20-29 years 30-39 40-49 50-59 60-69 70 <
137 524 593 474 425 262 116
5 21 23 19 17 10 5
83 246
49 47 21 13 2
18 53 11 10 4,5 3 0,5 Education
max. elementary middle school high school
272 141 2
795
11 57 32
46 267 144
10 58 32 Roma origin
yes no
- - 224
242
48 52
Appendix D
Principal Component Analysis D.1. Communalities
Variables Extractions
General population sample
Roma college students
frequency of speaking 0,565 0,333
0,435 0,563
Number of meetings during examined week 0,533 0,475
Intimate contact (according to 3 variables) 0,611 0,504
D.2. Total Variance Explained
Component General population sample
Initial Eigenvalues Extraction Sums of Squared Loadings
Total % of
Variance
Cumulative % Total % of Variance Cumulative
%
1 2,145 53,636 53,636 2,145 53,636 53,636
Component Roma college students
Initial Eigenvalues Extraction Sums of Squared Loadings
Total % of
Variance
Cumulative % Total % of Variance Cumulative
%
1 1,875 46,879 46,879 1,875 46,879 46,879
Appendix E Component Matrix
Variables Component 1
General population sample
Roma college students
Intimate contact (according to 3 variables) 0,782 0,750
Frequency of speaking 0,752 0,710
Number of meetings during examined week 0,730 0,689
o you feel being with this 0,660 0,577
Appendix F F.1. ANOVA Tables
General population sample Sum of squares
d f
Mean square
F Sig.
factorscore*type of relationship Between (Combined)
Within Groups Total
955,5 39 1296, 827
2252, 366
1 6
2 244 2 260
59,721 0,578
103,34 0
0,00 0
Roma college students Sum of squares
d f
Mean square
F Sig.
factorscore*type of relationship Between (Combined)
Within Groups Total
134, 139 265,
268 399,
407 9 3 91 4 00
14,904 0,678
21,969 0,00 0
F.2. Measures of Association
General population sample
Roma college students
Eta Eta
Squared
Eta Eta
Squared factorscore*type of relationship 0,651 0,424 0,58
0
0,336
Appendix G G.1. ANOVA Tables
General population sample Sum of squares
d f
Mean square
F Sig.
factorscore*sex Between (Combined)
Within Groups Total
935.8 11 1257.
068 2192.
879 1 6
2 175 2 191
58.488 0,578
101.19 7
0,00 0
G.2. Measures of Association
General population sample Eta Eta Squared
factorscore*sex 0,653 0,427
Appendix H H.1. ANOVA Tables
General population sample Sum of squares
d f
Mean square
F Sig.
factorscore*age Between (Combined)
Within Groups Total
958.7 31 1278.
120 2236.
851 1 6
2 230 2 246
59.921 0,573
104.54 7
0,00 0
H.2. Measures of Association
General population sample
Eta Eta Squared
factorscore*age 0,655 0,429