Network Disruptions and the Security of Supply in the European Gas Network
László Á. Kóczy
1,2, Dávid Csercsik
3, and Balázs R. Sziklai
1,41Centre for Economic and Regional Studies
2Budapest University of Technology and Economics
3Pázmány Péter Catholic University
4Corvinus University of Budapest
Abstract
The natural gas supply of the Eastern European countries located between Germany and Russia has always been problematic. A historical reliance on Russia has been eased by increased connectivity to the West.
Recent developments may lead to a diversied source but via a single supply route, which, in the light of the 2017 Baumgarten explosion, may introduce another type of risk.
We propose a novel framework to measure the supply security of nat- ural gas networks, combining a linear programming approach with a risk assessment technique borrowed from nance which measures supply secu- rity in European countries. The expected shortfall (ES) is currently the best practice for risk measurement recommended by one of the most im- portant international nancial regulators, the Basel Committee on Bank- ing Supervision. ES assigns risks by looking at a fraction of the worst cases of supply disruptions. The latter is modelled as the change in the optimal network ow in the case of one of the pipelines falling out due to certain incidents.
Several network congurations are considered along with seasonal sce- narios corresponding to the dierence in the availability of gas from stor- age facilities. We nd that the construction of Nord Stream 2, that is, doubling the capacity of the direct connection between Russia and Ger- many alleviates the gas shortage problem if the connection via Ukraine
is shut down, otherwise, the construction increases the risk for Eastern Europe.
JEL codes: C71, D72 Keywords and phrases:
1 Introduction
Amidst an increasing trend of renewables in energy production, natural gas remains a versatile, widely accepted energy source. Gas-fuelled power stations are exible, making them ideal as reserves to smooth out demand shocks or complement supply shocks in variable renewables. Due to its role in household heating, any shortage is extremely noticeable and has an immediate impact.
Natural gas is transported via pipelines or ships in liqueed form (LNG) which must be regasied to enter the pipeline network. Both LNG ports and pipelines require substantial investments and, consequently, the pipeline net- work suers from congestion problems: some regions may experience supply constraints or must be supplied via long, expensive detours in the network.
Congestion problems are especially pronounced in winter periods as natural gas is used extensively for heating and many countries have established storage fa- cilities to smoothen out demand seasonality and alleviate demand shocks or transport disruptions.
Our interest is in the European gas network, characterised by a high re- liance on gas from Russia with additional supply from gas elds in the North Sea (Norway), North Africa, Central Asia and increasingly LNG to meet demand. We focus on developments in Eastern Europe. Until the opening of Nord Stream in 2011, most gas from Russia was transported via Ukraine. After the escalation of the Russia-Ukraine gas disputes that eventually resulted in gas delivery disruptions to several European countries, Russia started to look for alternative delivery routes bypassing Ukraine. Nord Stream, opened in 2011, to- gether with its nearly complete capacity extension Nord Stream 2 is now able to replace the Ukrainian pipelines in terms of transmission capacity. Russia's main partner, Germany is surely a winner of these developments for getting its energy via a direct connection. Countries in the Eastern ends of the European Union
(Poland, Slovakia, Hungary, as well as countries on the Balkans), have made substantial progress in diversifying their sourcing and building interconnectors (Tarnawski, 2015). Now, with the prospect of Ukrainian pipelines phased out, they must prepare for the situation where, once again, all their energy supply comes via a single pipeline. With one dierence: the Brotherhood pipeline car- ried gas for Germany and other Western European countries so disruptions set major powers into motion, while the prospect is to be at the end of a pipeline that crosses half of Europe. Intuitively, incidents such as the 2017 Baumgarten blast shall eect the region more drastically.
Ours is not the rst paper to study supply security (or security of supply, abbreviated as SOS) and transport security in particular. Well before the 2009 Russia-Ukraine gas dispute, Weisser (2007) put out a manifesto warning of the risk of limited sourcing and a possible shock comparable to the Oil Crisis, calling for action. Despite eorts to increase connectivity and regulate the market, the interest in the supply security of natural gas to various markets remains (Cabalu, 2010; Doukas et al., 2011; Biresselioglu et al., 2015; Lu et al., 2016). These stud- ies take many dierent aspects into account. Cabalu (2010) considers gas supply interruptions, volatile gas prices, transportation and distribution bottlenecks and a growing reliance on long-distance imports, exploring the vulnerability of certain Asian countries. Stern (2002) distinguishes between source-, transit- and facility-dependence as the main sources of risks in an import-dependent country.
The risks caused by source or facility-dependence include strikes by Norwe- gian platform workers (World Gas Report, 1986; Adomaitis and Solsvik, 2020), a bombing of an on-shore section a pipeline in Algeria (Energy Compass, 1997) causing long-term concerns of similar attacks, the shutting down of the Arun liq- uefaction plant in Indonesia for several months due to political instability (Gas Matters, 2001), the 2017 Baumgarten incident (Vainio, 2017) that led Italy to declare a state of emergency (Hassel and Egenhofer, 2017; Bartelet and Mulder, 2020) and the general political and commercial risks of trading with certain countries.
For transit-dependence, Stern (2002) already mentions the case of Russian transits via Ukraine but the 2009 January crisis aected the supply of 18 coun- tries, causing more severe outages than any gas dispute before (Pirani et al.,
2009) and still causing concern as tensions continue.
Our approach is closest to that of Scotti and Vedres (2012) and Praks et al.
(2015) in focusing on the network, rather than just the availability of sources.
The eect of disruptions in the transportation network is scrutinised using the simplied model of the pipeline network (Csercsik, Hubert, Sziklai, and Kóczy, 2019) and an intuitive model to determine the optimal ows assuming rational payo-maximising agents. We examine the exposure of dierent countries to transport disruptions as well as the eect of network developments thereon:
beyond a baseline scenario, considering a closing of the Ukrainian corridor, the completion of Nord Stream 2 as well as a combined scenario. These are currently the most neuralgic points in the European network development scene, see e.g.
(Jiru²ek, 2020; Tóth et al., 2020; Sziklai et al., 2020; Wood and Henke, 2021). We include the Trans-Anatolian and Trans-Adriatic Pipelines (TANAP and TAP) in the analysis; the more recent TurkStream and Balkan Stream are not present in our data set yet.
Network disruptions may aect countries in dierent ways: resulting in a small price increase a positive eect is uncommon or even a massive shortage.
We assume that shortages can be supplied from storage facilities when these are full at the end of the summer but storage facilities must be relled before the winter months when consumption may exceed supply. If the incident happens in the winter when storages are depleted, any shortage must be compensated by diverting consumption to other energy sources at substantial costs. We refer to these cases as the summer and winter scenarios.
While several indicators have been introduced for supply security for natu- ral gas and energy in general (Kruyt et al., 2009; Vianello and Maschio, 2014;
Pavlovi¢ et al., 2018), our approach and indicator is new. The expected short- fall became the standard risk measure in nance dethroning value-at-risk (VaR), after some weaknesses have been identied in VaR analyses including the mea- sure's inability to capture 'tail risk' (Basel Committee on Banking Supervision, 2013). Apart from bearing the recommendation of the Basel Committee, it also has sound theoretical foundations (Acerbi, 2002; Adam et al., 2008).
The structure of the paper is as follows. First, we introduce our model, elucidating on its limitations. Next, we discuss the data collected and nally
present and discuss the main ndings.
2 Model
In the absence of disruptions, calculating the gas supply of a country or region is a simple optimisation task, where gas is purchased from the available sources taking prices, transportation costs and capacity constraints into account. First, this optimisation problem is described along with the assumptions made. Then our notion of supply security is explained clarifying the winter and summer scenarios. We end the section with an example.
2.1 Notation
The international natural gas pipeline network is examined to identify countries with nodes and pipelines with the arcs. The set of nodes is denoted by N,
|N| =nwith a generic element denoted by i or j. The set of arcs is denoted by L, |L|= m with the generic element l. The network itself is described by an incidence matrix A∈Rn×m withAil =−1 andAjl = 1indicating that the pipelinel runs from nodeitoj.
Each node is either a net producer or net consumer: in case of the former, the supply exceeds the local demand. Net consumers supply their demand from the network, from storage or, if these are not possible, switch to other energy sources or reduce their consumption. As a simplication, we assume that there is an indigenous, alternative energy source at each node that is more expensive than any of the natural gas sources including transportation costs and, therefore, only chosen to overcome shortages. This alternative is not necessarily a real energy source, it may also represent the economic losses generated by the gas shortage. This approach has been used by Sziklai, Kóczy, and Csercsik (2020) as well.
Formally, we assume that each node is characterised by demand and pro- duction, d0 ∈ Rn+ denotes the vector of demands and s0 ∈ Rn+ the vector of (maximum) supplies. In the following, we modify these vectors to getd, s∈Rn+: In net producer countries, production is reduced by the local consumption while for net consumers, we add the alternative energy source up to the level of the
net demand. Therefore,
di= (d0i −s0i)+ and si=
d0i −s0i
(2.1)
where (·)+ denotes the positive part, that is (x)+ = max{x,0} for anyx∈R.
The production cost is denoted by p ∈ Rn+ where pi = ¯p for all i such that d0i > s0i, where p¯is the cost of the alternative energy source.
The edges, representing the pipelines, are characterised by maximal trans- mission capacities in each direction, q = (q+, q−) ∈ R2×m+ . The transmission capacity dierences are monitored, mostly for technical reasons; while most pipelines are directed with a reduced reverse ow capacity, changing the direc- tion is neither costly nor particularly time consuming. Given a bidirectional pipeline l and a ow fl on it, the net capacity in the direction of the ow is q+l −fl, while in the opposite direction, there is a capacity q−l +fl, where the last term represents a potential for barters without actual gas transmission.
Transporting gas over these pipelines has its costs. A pipeline may travel across several regions, making it convenient to dene costs by a cost matrix C ∈ Rn×m+ where Cij is the cost of transferring a unit gas over pipeline j occurring in regioni. We assume that transportation cost is proportional to the length of the pipeline.
2.2 Optimal ows
Optimal ow is one that satises the demand while incurring the lowest to- tal cost. By our assumption of utilising alternative energy sources, satisfying demands locally is always a feasible solution.
Formally, letfj+ ∈ R+ denote the ow in the positive direction over edge j. Similarly, let fj− ∈ R+ denote ow in the opposite direction. Let I ∈ Rn+
denote the inlet values at the nodes. The variable vector is then
x=
f+ f− I
∈R2m+n+ . (2.2)
Let ei and eS denote n-dimensional indicator vectors for i and S, respec-
tively:
eik=
1 ifk=i
0 otherwise and eSk =
1 ifk∈S 0 otherwise.
Let ES denote a diagonal matrix with eS over the diagonal, 1n denote an n- dimensional vector of 1's,Ik×k akdimensional identity matrix and0k×ldenote a k×l-dimensional 0 matrix.
We now describe the linear programming problem and interpret the con- straints, we minimise the cost of supplying playeri:
minx
1TnC 1TnC pT
x (2.3)
such that
h
A A ES
ix=diei (2.4)
Ij ≤sj (2.5)
I2m×2m 02m×n
x≤
q+ q−
(2.6)
x≥0 (2.7)
The objective function and constraints are, actually, rather straightforward.
The aim is to minimise the total cost, that is, the sum of the transportation costs in the positive direction, transportation costs in the negative direction and the cost of gas itself. Since the transportation costs are non-zero on each pipeline, gas cannot ow in both directions as it would result in a cheaper ow with the same resulting supply. The rst constraint explains that no gas is lost at any of the nodes: the total of inlets, inows and outows must add up to the consumption of player i. Inlets cannot exceed the supply capacities. The last condition merely insists on the non-negativity of ows. Finally, constraint 2.6 explains that the ows must not exceed the transmission capacities. Initially, we set q+=q−=q.
While this simple optimisation problem helps us nd the optimal paths, acquiring the individual payos must also be considered. Obtaining these payos is nontrivial when dierent supply paths with dierent generalised prices intersect. We assume that when gas ows merge the price becomes the weighted
average of the prices, where weights corresponds to the dierent volumes of the ows. Since the optimal ows constitute a directed acyclic graph, circular ows could be eliminated to reduce costs this calculation is well-dened.
In Section 2.5, we demonstrate how individual payos can be calculated in a detailed example.
2.3 Supply security
Out of the many factors that aect supply security, our focus lies on the aspects related to the physical network: on disruptions that put one of the pipelines out of use, including political risks, natural disasters, technical failures but also sabotage and terrorism. In order to evaluate such risks, we turn to models used in nance and the study and the design of electric power grids.
While both are utility networks, the physical properties of the electric power grids are quite dierent. There are complex laws that determine the ow of electricity depending on the network characteristics, inputs and outputs and the electricity cannot be re-routed to reduce the load on a particular connection. In case of a power-line failure, electricity re-routes itself, increasing the chance of an overload on one of the other connections. Unless the network is protected against such primary failures, we may expect a sequence of problems resulting in widespread and long-term disruptions.
The so-calledN −1 contingency analysis is used to evaluate the would-be scenario of an incident where one of the power lines drop out (double incidents have a negligible probability). Majidi-Qadikolai and Baldick (2016) explains how N−1 contingency analysis can be applied in the ecient planning of the power grid to avoid cascading failures after an incident.
Clearly, in the case of natural gas networks, such preparation is unnecessary:
if one of the pipelines is closed down, the closure does not directly aect the operation of other connections, except that congestions may be more severe.
For the nodes of the network, that is, the countries, the eects may prove to be more drastic. In the optimal ow supply is redirected to the remaining routes, increasing congestion along the aected pipelines. As a result, the already limited transmission capacities are further reduced and some countries may nd themselves without available gas sources. While a disruption increases the
overall cost of supplying the network, players may be hardly or severely aected depending upon their connectedness. In rare cases, a player may even benet from the change (we will show how this can happen in the example network).
Our analysis covers all possible incidents, that is, scenarios corresponding to the closure of each of the existing pipelines. We assume that each pipeline fails with the same probability leading to a random variable that informs the extent to which each country will be hit in case of an incident. Our method can be generalised to accommodate pipeline-specic risks.
We evaluate these scenarios using a risk measure (Denault, 2001; Szegö, 2002) which is the (possibly negative) amount of cash that needs to be added to a problem to make it acceptable and is calculated as a weighted average of all the scenarios. We express the conservatism of the players by assigning higher weights to more critical scenarios, in other words, we use spectral risk measures (Acerbi, 2002). Specically, we employ the α-expected shortfall withα= 10%, the most popular spectral risk measure in economics and nance. The expected shortfall takes the (weighted) average of the worst10%of scenarios; in our case, this refers to inspecting the disruptions that aect the player least favourably.
2.4 Seasonality
The European natural gas network exhibits a natural seasonality. As the gas is used for heating, among other services, consumption is higher in the winter than in the summer. In fact, transmission capacities are often insucient to cater to winter demands: storage is lled during the summer and, then, in the winter, the supply is supplemented from the storage. Note that storage is also used as a reserve to reduce the impact of incidents. We model this dierence using the following two scenarios:
Winter Reserves are depleted so any gas shortage must be immediately sup- plied from the network or from an alternative source.
Summer Gas shortages are compensated from the reserves, but these must be relled, essentially converting a major supply shock into a smaller demand shock. For simplicity, we assume that relling increases demand by 1/3 of the shortage but with the xed network. The alternative source is only
1
2 4
3 6
5
i1 i2
i5
i3
i4
s1= 6 s2= 6
d4= 4 d5= 4
3 3
1
2
2
6 2
4 4
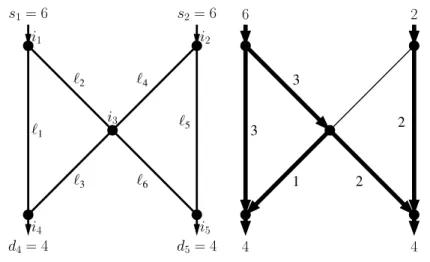
Figure 1: An example with 5 nodes and 6 pipelines and the optimal ow
used if this increased demand cannot be met.
2.5 Example
We consider the simple example presented in Figure 1 (left). This abstract example has 5 nodes and 6 pipelines connecting them. Two of these nodes are producers, supplying at most 6 units of gas, p1 = 300, p2 = 400, two are consumers, utilising 4 each. Node 3 has a balanced production/consumption pattern and each node has an alternative energy source atp˜= 600.
The pipelines all have the same capacityq= 3. We assume that transporta- tion costs are negligible but positive,Cij=ε >0and, hence, will be ignored in the calculations but gas will always travel the shortest route in terms of pipeline segments.
For such a simple network, the optimal ows are easy to determine (Figure 1, right). Nodei4obtains all the gas from the cheaper sourcei1, so that the total cost isc4 = 4×300 = 1200. Node i5 gets2 from source i1 and the rest from the more expensive i2at a total cost of c5= 2×300 + 2×400 = 1400.
Now, let us look at a possible disruption. If pipeline`1cannot be used, the ows change drastically. Now supplieri1is bound by the outgoing transmission capacity 3 via pipeline `2; similarly, consumeri4 can only obtain 3 from the network via `3.
3
3 1
3 1
3 4
3 4
3 1
2 3 1
3 5
4 4
3 3
1 3
6 1
3 4
3 3
1
2 2
6 2
4 4
3 3
1 1
3
6 2
4 4
3 3
1 2
3
6 1
4 3
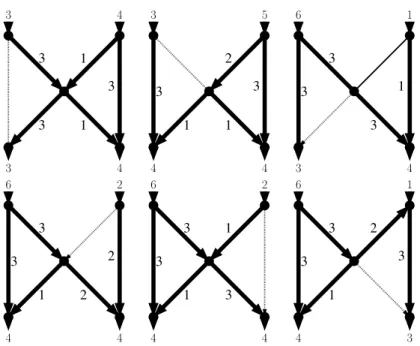
Figure 2: Optimal ows for disruptions in the winter (disrupted lines are dotted)
What are the costs? Consumeri4 obtains all his gas viai3. But is this gas from sourcei1or, at least in part, fromi2? By our assumption, the gas streams from the two sources are mixed, so fromi3, there are 4 units of gas available at a price calculated as the weighted average of the inows: p3= 3×300+1×400
4 = 325. In the winter scenario, consumer i4 obtains 3 units of this gas as well as the remaining 1 supplied from its alternative source at a cost of 600: c4 = 3×325 + 1×600 = 1575, whilei5 hasc5= 1×325 + 3×400 = 1525.
In the summer scenario, consumeri4can try to ll the storage in the coming 3 months. This results in a modied demand of413.
Focusing on the winter scenario, we can now calculate the costs of supply for all single-pipeline disruption scenarios (Table 1). Given the small number of states, calculating the expected shortfall (ES) withα= 10%would be the same as looking at the worst case; instead, we consider α= 13, in other words, the average cost under the two worst scenarios (highlighted in Table 1). Therefore, the ES1
3 for the two nodes are 1537.5 and 1600 respectively, which constitute a 28% and 14% increase with respect to the status quo. Ostensibly,i4can be hurt more by losing its privileged connection to produceri1and a network disruption may aecti4 more severely according to our model.
cost for node without`4
disrupted i4 i5 i4 i5
none 1200 1400 1200 1400
`1 1575 1525 1725 1575
`2 1300 1600 1500 1800
`3 1500 1300 1500 1300
`4 1200 1400 1200 1400
`5 1225 1575 1275 1725
`6 1200 1600 1200 1800
ES (α= 1/3) 1537.5 1600 1612.5 1800
Table 1: Costs fori4 &i5 in the winter scenario. The worst 13 are highlighted.
The two right columns show the case when the network does not contain `4. Note that the disruption of`3 benetsi5.
Such comparison is more useful when dierent networks are considered. In the initial network, pipeline `4 carries no gas, deeming it unnecessary. The last two columns of Table 1 present the same analysis for a network with only 5 pipelines. It is clear that `4 plays an important role in increasing supply security by mitigating the risks associated with disruptions. Without `4, the expected shortfalls are 1612.5 and 1800 with a total increase of 275. While one must compare this with the construction costs to see if`4 is worth the money, it is clear that the pipeline is not useless even if it is not used such as the Slovakia-Hungary interconnector at Beregdaróc (Badida, 2014).
2.6 Scenarios
Barring the baseline scenario, we consider certain possible developments for the Eastern corridor.
1. The Ukraine scenario assumes that the connection between Ukraine and Russia is closed, prompting the investigation into the eect of another closure.
2. In the second scenario, we calculate using a completed Nord Stream 2,
3. in the third, the Ukraine-Russia pipeline is phased out once NS2 is oper- ational.
For each of these scenarios, we have also looked at the eect of the opening of the Trans-Adriatic Pipeline connecting Turkey with Italy via Greece with a capacity of 20 bcm/yr, carrying cheap gas from Central Asia to the South Balkans, Italy and beyond.
Generally, the construction of NS2 should alleviate the problem of congestion on the network, but Gazprom's communication about the Ukrainian pipelines reaching the end of their service life and the cost of maintaining excessive trans- mission capacities hints that the two main connections between Russia and Europe will not coexist for long. We, therefore, think that the impact of NS2's construction is best illustrated by comparing the rst (Baseline) and last (Com- bined) scenarios. This will have a drastic eect on Eastern Europe and will incite interest in seeing whether TAP (and the already operational Trans-Anatolian Pipeline or TANAP) can compensate for the shift of the main East-West trans- mission channel to the North. The ongoing development of Balkan Stream will be an important contribution here.
In the following section, we present the data and results.
3 Data and calculations
The network of international pipelines form a connected network but, often, only via the national pipeline networks. We, therefore, use a number of simplifying assumptions (See also Csercsik, Hubert, Sziklai, and Kóczy, 2019)
Players are reduced to a node; the connecting arcs, where necessary, in- clude some segments of the national network.
In the case of Russia and North Africa, distances are measured from the borders. This makes no dierence for delivery prices.
LNG is added as a player with a pipeline of the same length as the liquifying-regasication costs.
Prices are estimates and the same for all consumers.
The cost of the alternative energy source is estimated at a at 600 M$/bcm.
Dierences in gas quality are ignored.
Data concerning national resources including natural gas are published reg- ularly by a number of reliable sources. Transmission capacities were compiled from the data sheet provided by the International Energy Agency (2020). Con- sumption and production data was gathered from BP's Statistical Review of World Energy (BP, 2020). Pipeline lengths were retrieved from the public database of the European Network of Transmission System Operators for Gas (ENTSOG, 2019) and other online sources.
4 Results
Our measure for supply security is based on the evaluation of the network with disrupted pipelines. We assume that all 150 pipelines face the same probability of incidents and for each country, we are concerned with the worst 10% of the cases, that is, the 15 (directed) pipelines whose removals give the highest cost increases for the country at hand.
Table 2: Expected shortfall values for the dierent network scenarios in winter (remaining values are constant over all scenarios). TAP and NS2 stand for a scenario where the Trans-Adriatic Pipeline and Nord Stream 2 are, respectively, operational, UA for the one where Russia-Ukraine pipelines are closed.
base TAP NS2 NS2+TAP NS2+UA All
Austria 2110 2110 2027 2027 4740 4740
Belgium 10440 10302 5211 5215 5100 5100
Bulgaria 954 835 954 835 1940 1096
Croatia 232 232 232 232 532 532
Czech Republic 2098 2098 2095 2095 2318 2318
France 26023 26023 20107 19111 25836 25836
Germany 21527 21542 20721 20738 23904 23904
Greece 2629 1755 2629 1755 3058 1736
Hungary 2032 2033 2032 2033 4817 4618
Italy 31092 27151 30263 26898 38385 38385
Netherlands 3569 3569 2387 2389 2282 2282
Poland 4541 4505 4456 4456 5255 5255
Romania 303 304 303 304 720 473
Serbia 647 647 647 647 1276 1276
Slovak Republic 1169 1169 1169 1169 2747 2747
Slovenia 237 237 237 237 541 541
Spain 19030 19030 19030 19030 19030 19030
Switzerland 1724 1574 1083 1094 1149 1149
Turkey 11996 10843 11996 10843 13342 11643
Ukraine 2042 2042 2042 2042 4283 4251
United Kingdom 23520 23520 22099 22099 23520 23520
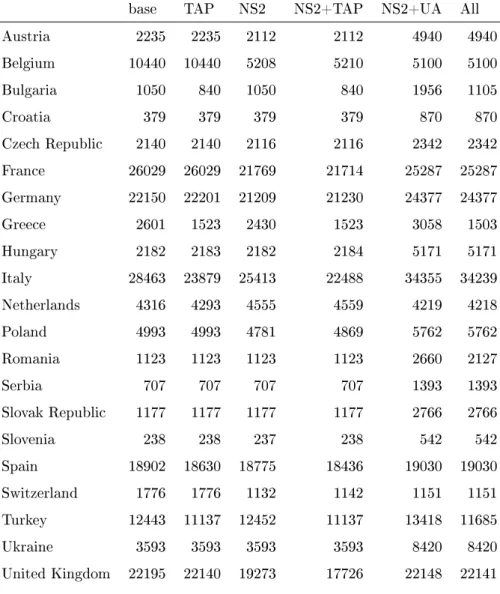
Table 3: Expected shortfall values for the dierent network scenarios in summer (remaining values are constant over all scenarios). As before, TAP and NS2 stand for a scenario where the Trans-Adriatic Pipeline and Nord Stream 2 are, respectively, operational, UA for the one where Russia-Ukraine pipelines are closed.
base TAP NS2 NS2+TAP NS2+UA All
Austria 2235 2235 2112 2112 4940 4940
Belgium 10440 10440 5208 5210 5100 5100
Bulgaria 1050 840 1050 840 1956 1105
Croatia 379 379 379 379 870 870
Czech Republic 2140 2140 2116 2116 2342 2342
France 26029 26029 21769 21714 25287 25287
Germany 22150 22201 21209 21230 24377 24377
Greece 2601 1523 2430 1523 3058 1503
Hungary 2182 2183 2182 2184 5171 5171
Italy 28463 23879 25413 22488 34355 34239
Netherlands 4316 4293 4555 4559 4219 4218
Poland 4993 4993 4781 4869 5762 5762
Romania 1123 1123 1123 1123 2660 2127
Serbia 707 707 707 707 1393 1393
Slovak Republic 1177 1177 1177 1177 2766 2766
Slovenia 238 238 237 238 542 542
Spain 18902 18630 18775 18436 19030 19030
Switzerland 1776 1776 1132 1142 1151 1151
Turkey 12443 11137 12452 11137 13418 11685
Ukraine 3593 3593 3593 3593 8420 8420
United Kingdom 22195 22140 19273 17726 22148 22141
Figure 3: The winter scenarios: Nord Stream 2 (left), this without Ukraine (right), both with TAP (bottom row) as compared to the
17
18
We observe a drastic dierence in the potential eects of NS2 in two parts of Europe: the East and West. While the construction of NS2 brings cheap gas and thereby substantial benets to Western Europe, South-Eastern Europe enjoys no benet at all. If NS2 is followed by phasing out the Ukrainian gas corridor, most of Central- and Eastern Europe is left with a highly concentrated supply path and, if any of the pipelines along that path are aected, the results will be catastrophic for the region, with substantial gas outages a surety. Interestingly, shortages are not restricted to the winter scenario. These risks, by far, outweigh the benets of lower transportation costs for the West.
The Trans-Adriatic Pipeline system alleviates the problem in the Southern part of Europe but the current plans do not extend the network to the North beneting only the few countries en route: Bulgaria, Greece and Italy. For some of these countries, the pipeline gives clear benets vis-a-vis the status quo regarding supply security.
How far do the benets of TAP reach? The average marginal contribution of TAP to risk is the highest for Greece and Bulgaria (-42 and -39%), high for Romania, Turkey and Italy (-21.4, -11.4 and -8.4%) and hits Poland most adversely at 0.16%.
A similar analysis for NS2 depends heavily on whether it is an additional pipeline or there is a shift in existing connections to the North. If the former is true, it brings massive benets to Switzerland, Belgium, France, the Netherlands and the UK as well as reduces risks in Italy, Austria, Germany and Poland. The highest losses will strike Hungary, Serbia, and Turkey at 0.02%. On the other hand, if NS2 comes in a bundle, disruptions may create massive shortages in Slovakia, Hungary, Croatia, Slovenia, Austria, Ukraine, Romania and Serbia, additionally harming Bulgaria, Italy, Poland and, to a smaller extent, Germany, the Czech Republic and Turkey, creating savings in Belgium, the Netherlands, Switzerland and France only.
These results are generally in line with the division between supporters and opponents of the project (see, for instance, de Jong et al., 2020). Note that Germany and Austria face increased risks as well, their supportive stance can be explained by their special roles as distributing hubs for Eastern Europe under these scenarios. This is better modelled by a cooperative game theory approach
(Sziklai, Kóczy, and Csercsik, 2020).
5 Conclusion
We have looked at the negative eect of the cost of disruptions in the system for each player. Our approach is very simple: by taking the same probability, we ignore dierences in political, environmental and terrorist risks or even in the size or signicance of a pipeline. Given the enormous observed dierences in supply risk, we are condent in having found the weak links. Concerning the methodology: The Value at Risk (VaR) and Expected Shortfall methods are the two most commonly applied risk measures. We chose the latter since, in contrast to VaR, it is a coherent measure (Acerbi and Tasche, 2002); furthermore, VaR has been heavily criticised recently, see e.g. (Embrechts, 2000) or (Sarykalin et al., 2014). Heckmann et al. (2015) oer a comprehensive review on measuring risks related to supply chains.
At the time of writing, it is not entirely clear yet whether Nord Stream 2 can actually be completed and politics may aect its operation later, too. Most likely, however, the pipeline will get completed with the described eects. We must realise, however, that network disruptions also harm Russia: the shortages mean less gas sold for Russia. Russia has already made steps to contain the damages with the construction of TurkStream and Balkan Stream. Whether these steps are sucient to compensate the region, we plan to investigate in another paper.
Acknowledgement
Our paper has beneted from extensive comments from Csaba Weiner and dis- cussions with Bert Willems. This work has been supported by the grants K 131545 (Csercsik), K 128573 (Kóczy) and K 119930 (Sziklai) of the Hungarian National Research, Development and Innovation Oce as well as the Higher Education Institutional Excellence Program 2020 of the Ministry of Innovation and Technology in the framework of the 'Financial and Public Services' research project (TKP2020-IKA-02) at Corvinus University of Budapest. Dávid Csercsik
is a grantee of the János Bolyai Research Scholarship of the Hungarian Academy of Sciences.
References
Acerbi, C., 2002, Spectral measures of risk: A coherent representation of sub- jective risk aversion, Journal of Banking & Finance 26, 15051518.
Acerbi, C. and D. Tasche, 2002, On the coherence of expected shortfall, Journal of Banking & Finance 26, 14871503.
Adam, A., M. Houkari, and J.-P. Laurent, 2008, Spectral risk measures and portfolio selection, Journal of Banking & Finance 32, 1870 1882.
Adomaitis, N. and T. Solsvik, 2020, Six Norway oil and gas elds shut as strike escalates.
Badida, J., 2014, Changing European gas map an opportunity or threat for Slovakia?, International Issues & Slovak Foreign Policy Aairs 23, 311.
Bartelet, H. and M. Mulder, 2020, Natural gas markets in the European Union:
Testing resilience, Economics of Energy & Environmental Policy 9.
Basel Committee on Banking Supervision, 2013, Fundamental review of the trading book: A revised market risk framework, Consultative document.
Biresselioglu, M. E., T. Yelkenci, and I. O. Oz, 2015, Investigating the natural gas supply security: A new perspective, Energy 80, 168176.
BP, 2020, Statistical review of world energy 2020 (London, UK).
Cabalu, H., 2010, Indicators of security of natural gas supply in Asia, Energy Policy 38, 218225.
Csercsik, D., F. Hubert, B. R. Sziklai, and L. A. Kóczy, 2019, Modeling transfer prots as externalities in a cooperative game-theoretic model of natural gas networks, Energy Economics 80, 355365.
Denault, M., 2001, Coherent allocation of risk capital, Journal of Risk 4, 139.
Doukas, H., A. Flamos, and J. Psarras, 2011, Risks on the Security of Oil and Gas Supply, Energy Sources, Part B: Economics, Planning, and Policy 6, 417425.
Embrechts, P., 2000, Extreme value theory: Potential and limitations as an integrated risk management tool, Derivatives Use, Trading & Regulation 6, 449456.
Energy Compass, 1997, Bomb disrupts algerian gas supplies , 2123.
ENTSOG, 2019, The European Natural Gas Network, Retrieved from https://www.entsog.eu/sites/default/files/2020-01/ENTSOG_CAP_
2019_A0_1189x841_FULL_401.pdf, Accessed: 2020-04-08.
Gas Matters, 2001, Arun challenges Asian LNG reliability rules, Gas Matters , 16.
Hassel, A. and C. Egenhofer, 2017, Lessons from the Baumgarten incident, CEPS Commentary , 1112.
Heckmann, I., T. Comes, and S. Nickel, 2015, A critical review on supply chain risk Denition, measure and modeling, Omega 52, 119 132.
International Energy Agency, 2020, Gas Trade Flows, Retrieved from https:
//www.iea.org/reports/gas-trade-flows, Accessed: 2020-04-08.
Jiru²ek, M., 2020, The attitude of the visegrad group countries towards russian infrastructural projects in the gas sector, Energy Policy 139, 111340.
de Jong, M., T. Van de Graaf, and T. Haesebrouck, 2020, A matter of pref- erence: Taking sides on the Nord Stream 2 gas pipeline project, Journal of Contemporary European Studies , 114.
Kruyt, B., D. P. van Vuuren, H. J. de Vries, and H. Groenenberg, 2009, Indica- tors for energy security, Energy Policy 37, 21662181.
Lu, W., M. Su, B. D. Fath, M. Zhang, and Y. Hao, 2016, A systematic method of evaluation of the Chinese natural gas supply security, Applied Energy 165, 858867.
Majidi-Qadikolai, M. and R. Baldick, 2016, Integration of N−1 contingency analysis with systematic transmission capacity expansion planning: ERCOT case study, IEEE Transactions on Power Systems 31, 22342245.
Pavlovi¢, D., E. Banovac, and N. Vi²tica, 2018, Dening a composite index for measuring natural gas supply security - the croatian gas market case, Energy Policy 114, 30 38.
Pirani, S., J. Stern, and K. Yamava, 2009, The Russo-Ukrainian gas dispute of January 2009: a comprehensive assessment, vol. NG 27.
Praks, P., V. Kopustinskas, and M. Masera, 2015, Probabilistic modelling of security of supply in gas networks and evaluation of new infrastructure, Re- liability Engineering & System Safety 144, 254 264.
Sarykalin, S., G. Serraino, and S. Uryasev, 2014, Value-at-Risk vs. Conditional Value-at-Risk in risk management and optimization, chap. 13, 270294.
Scotti, M. and B. Vedres, 2012, Supply security in the European natural gas pipeline network, in: M. Scotti and B. Vedres, eds., Networks in Social Policy Problems (Cambridge University Press), 237264.
Stern, J., 2002, Security of European natural gas supplies: the Impact of Import Dependence and Liberalization, The Royal Institute of International Aairs , 36.
Szegö, G., 2002, Measures of risk, Journal of Banking & Finance 26, 12531272.
Sziklai, B. R., L. Kóczy, and D. Csercsik, 2020, The impact of Nord Stream 2 on the European gas market bargaining positions, Energy Policy 144, 111692.
Tarnawski, M., 2015, Security of Gas Supply in the Countries of the Visegrád Group, Securitologia 21, 127142.
Tóth, B. T., P. Kotek, and A. Selei, 2020, Rerouting Europe's gas transit land- scape - Eects of Russian natural gas infrastructure strategy on the V4, En- ergy Policy 146, 111748.
Vainio, J., 2017, An explosion in the heart of the European gas system: What does the Baumgarten case tell about the resiliency of the system?, SARDINES 5, 7.
Vianello, C. and G. Maschio, 2014, Quantitative risk assessment of the italian gas distribution network, Journal of Loss Prevention in the Process Industries 32, 5 17.
Weisser, H., 2007, The security of gas supply-a critical issue for Europe?, Energy Policy 35, 15.
Wood, S. and O. Henke, 2021, Denmark and Nord Stream 2: A small state's role in global energy politics, Energy Policy 148, 111991.
World Gas Report, 1986, Norwegian gas customers unrued by production shutdown , 3.