Opportunity for a Real Time Control in Industrial Waste Water Systems
Péter Ivanics*, Jozsef Lakner*, Gábor Lakner** and Éva Hajnal*
* Óbuda University Alba Regia University Center, H-8000 Hungary Székesfehérvár, Budai Str. 45, Hungary
** Hidrofilt Water Treatment Ltd. H-8800 Nagykanizsa Magyar u. 191, Hungary
ivanicspeter92@gmail.com, lakner.jozsef@arek.uni-obuda.hu, lakner.g@hidrofilt.hu, hajnal.eva@arek.uni-obuba.hu Abstract—Environmental protection is one of the most
important topics nowadays in scientific and industrial way of thinking. Industrial firms are trying to reduce their emitted pollution, meanwhile increasing the profit. In our study a procedure was developed for the management of the waste water at a Hungarian pharmaceutical factory. The parameters of the waste water, which is flowing into the sewerage system, are generally below the permitted threshold value but sometimes they exceeded the limit. To improve the managing system an on-line measuring equipment set was applied, by which the chemical oxygen demand (later COD) can be estimated on the basis of BRIX method. A mathematical model was developed for the estimation of the COD value (which was possible only by using laboratory measures before), its integral, and the standard deviation. Furthermore a real time control module was developed, which keeps the parameters of the waste water under the threshold-value regarding the regulations ordained by the Ministry of Environmental Protection. The system works with three collecting tanks, and it controls the flow of the water into the tanks, lets down the water into the drain, or suggests the transportation of it for COD removal, if its parameters exceeded the limit. The equipment was tested for 45 days, and the measured data were used for the simulation of the control module. During the test period it was established, that the volume of the water transported became less by 50%, while no water, the parameters of which were above the threshold value, flowed into the drain.
To generalize our system, we started to develop a genetic algorithm which could be applied in many case of water direction systems.
I. INTRODUCTION
Nowadays environmental protection is one of the most important problems of private individuals and industry.
The management of waste water is a fundamental question in freshwater protection. Many studies deal with this topic [1, 2, 3, 4], and there are strict regulations that control the parameters of the waste water flowing into the drain in case of protecting the environment. In Hungary the 2004 order of the Ministry of Environmental Protection ordains the parameters of the waste water and the limits of the pH, Chemical Oxygen Demand (later COD), Biochemical Oxygen Demand, Total Nitrogen, Total Phosphorus, etc [5] which is allowed to let into the drain. In this study we discuss a possible waste water control system for a Hungarian pharmaceutical factory.
This waste water is channeled into the public drain and its main parameters are COD, conductivity and pH. The COD limit depends on the drain type, but in this case it is 1 000 mg/L. If the COD value of the water exceeds limit, the water must be transported for further treatment. It
cannot be flowed into the drain regarding the order mentioned above.
The current technology (Figure 1.) is using three tanks to collect the waste water, each volume is 24 m3. The first tank is used for PH equalization. The outflowing water, which is coming from this tank, fills the next two tanks alternately. These tanks are connected in parallel. When a tank becomes full, its water is pumped into the drain;
meanwhile the coming water is collected into the other one. This solution produces much water above the allowed COD limit.
It is difficult to improve of this system because the only way to measure the COD value of the water is the laboratory measure, and hugest problem with them is, that these analyzers work on the basis of measurement of specific chemical reactions, and their working time is long, at least 6-10 minutes which denies making real time decisions in controlling the water. The creation of a real time control system requires on-line measurement technics,
Figure 1. The scheme of the currently used solution
which can measure few parameters, and makes the estimation of COD value possible with good precision (~100 mg/L) especially near the limit (1 000 mg/L COD).
The pH measurement and adjustment has already been solved in another study.
The final purpose is developing a dynamic control and management system, which can calculate the current COD value of the coming water, and makes decision of the selection of the tanks depending on the actual water level and COD value of it. Our goal is to minimize the volume of generated the water, which is above the COD limit, and to maximize the mean COD value of this portion of water.
The minimization of the volume is reasoned by the cost of transportation. The water of which COD value is above 10 000 mg/L can be used for methane production.
II. MEASUREMENTS AND MODEL
The main part of the solved or solubilized compounds of the water comes from the washing of the pharmaceutical instruments of the factory when changing the manufactured medicine. It is a diluted covering solution for pills, and contains mainly sucrose, citric acid or its salts, tensids and talcum powder.
The base idea of our method is that the concentration of a sucrose solution can be measured by refractometrics and we expected a direct relation between BRIX and the COD value [3, 4]. The refractometric measurement can be applied on-line, and we thought that this measurement technic could be the basis of this control and measurement system.
The first step was to calculate the relation between the BRIX and COD values at different sucrose solutions relying on precise laboratory measurements. Sadly the precision of the correlation between the BRIX and COD was too low (R=0.7399).
After a lot of calculation, as a result we can say that we had to expand the calculations with the conductivity, because of the composition of the waste water. We searched the maximum value of the correlation between measured COD and BRIX* calculated by the first equation
C BRIX
BRIX * *
, (1)where BRIX* is the corrected value of the BRIX, BRIX is the measured value, C is the conductivity and is the questionable coefficient (
0.1).As we can see on Fig. 2, the logistic model fits better to the measured data than the linear.
The expected value of COD (k) and standard deviation () by this approximation, is a polynomial of degree n
n
i
i i
k
a
k g k
k
0
) BRIX*
( )
BRIX*
( ln
, (2)
n
i
σ
(BRIX) b
i(BRIX*) σ g
σ σ
0
ln
, (3)Figure 2. The relation between BRIX* and COD should be a logistic
(R=0.977) model instead of a linear (R=0.739)
where ai are the polynomial coefficients, k∞ is the asymptote of k, the standard deviation (σ) of the COD value is the difference of the squares of COD measurement and the expected value of COD (k), as a square function of the BRIX* and the fitted curve similar to equation 2, where bi are the polynomial coefficients, and similarly ∞ is the asymptote of .
The polynomial regression method was parameter variation in a least square sense, and the model was best at n=2 (R=0.9737).
The resulted coefficient values at the estimation of the k and the standard deviation are a0=-6.05, a1=1.09, a2=0.2, and k∞=72 000, (standard deviation) b0=-4.42, b1=1.38, b2=0.16, and σ∞=12 500.
The standard deviation values by the equation 3, evaluated at different BRIX* values may be quite large.
These values are in the same order of magnitude with the expected value of COD. Consequently, the temporary value of k is not suitable for the precise estimation of the temporary COD. Fortunately, the waste water is collected into tanks, by using the rules of statistics the integral value of the k may be more precise, because at calculation of standard deviation have to be summed the squares of these values. The mean value of k is
ji i
j
k
k j
1
1
(4) if we suppose that the sampling intervals are constant, the samples are independent from each other and the tank was empty at the beginning.
To achieve a 95% confidence interval, in the calculation of k+, the kj must increase with 1.64*j.
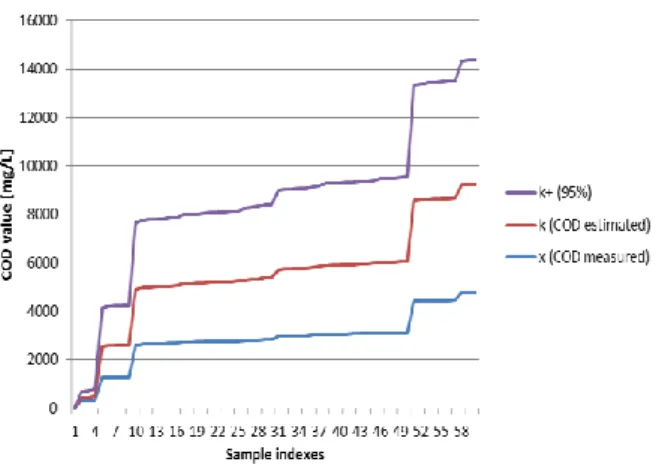
For the model check the mean of the estimated CODs by BRIX*(k), and the mean of the measured CODs (X) and the 95% confidence intervals (k+) of the mean COD for all three tanks. Each calculation was executed with 60 samples from the 45-day period measures. These samples were chosen either from the lower BRIX range, or from the higher BRIX range(Figure 3) and from the whole set randomly. In all cases the estimated values fitted to the measured values, and the mean of the standard deviation remains acceptable.
Figure 3. Calculation of the integral (cumulative) value of COD for the 60 highest result. Parallel on-line brix and laboratory COD
measurements were executed and the measured and estimated cumulative COD was compared.
As a result of the simulation we can say, the model is suitable for the estimation of the COD of the waste water which is collected in the tanks, and the decisions could be made on temporary values of the water. Thus a control system can be developed on the base of the measurement of BRIX*, and the estimation of the temporary and cumulative COD.
III. RESULTS
A system plan was developed on the basis of the mathematical model (Figure 2.). The system consists of three tanks, connecting pipes, pumps, the on-line measuring equipment (Figure 4.). and the two alternative types of control module later Direct Control Module (DCM) or Intelligent Control Module (ICM). The direction of the waste water is controlled by a decision making module, which keeps the COD of the first and second tanks below the limit, and collects the extremely high COD into the third tank in case of using it for methane production. The first and second tanks work alternately. The algorithm of the DCM module is below.
The current COD of the flowing waste water, and the mean COD of each tank are estimated, and the further decision depends on these values.
If the temporary COD is below 1 000 mg/L, then the system controls the water into that tank, which has lower mean COD value actually. If the COD is above the 1 000 mg/L limit, the system has to choose from three possibilities:
if the mean COD remains below the limit in each tanks, then the system chooses that tank whose mean COD is higher;
if each tank exceeds the limit with this portion of water, the control module directs it into that tank which would have a COD value under the limit or if it is not possible, flows it into the third tank, however it will dilute the water in it;
if the COD of the coming water is extremely high (>10 000 mg/L) the water is flowed into the third tank.
While a tank is filling up, the other tank may pump the waste water into the drain. To ensure the robustness of the
system, the tanks are not filled up to 100%, only until 70%. If the level of the third tank exceeds a volume limit, the control module sends a warning message about the necessity of transportation of the waste water. The algorithm makes an effort to collect the water up to near the limit (70%), and pump out the water till the tank is empty.
Figure 4. The scheme of the developed system
The work of the traditional method, DCM control module and ICM module was simulated with a dataset, which was collected during the 45 day test of the measuring module. The traditional method pumped 42 tanks (below limit) into the drain, and there was need to transport 24 tanks (above limit) (Figure 5. A.).
The developed DCM control system pumped 54 tanks into the drain and there was need to transport 12 tanks while no water above the limit was let to the drain using the same dataset. (Figure 5. B.) Extreme COD values did not occur during this period.
Figure 5. Performance comparison between the traditional system (A) and the developed DCM (B) and ICM (C)
Seeing this improvement we decided to look after a solution by which we could generalize the solution, so the algorithm could work at other similar management systems. This ICM module based on a genetic algorithm [6, 7], where we selected the volume of the transported waste water as the fitness value. This solution pumped 51 tanks into the drain and transported 15 tanks. This result is
nearly as good as the developed DCM, but it needs further improvement. This remains as a future plan of the project.
Unfortunately we could not test our system in real environment. Building the system is not executed yet, but in our estimations, it could save 1600 € every month after applying.
IV. DISCUSSION
For the real time direction of a sucrose content waste water of a pharmaceutical factory, a complex system was planned. The system contains an on-line measuring module, which can measure mainly the BRIX and conductivity values of the water. A mathematical model was developed for processing the measured data and two types of control module was developed to decide the flowing directions of the waste water. The received data series by the measuring module was used for proving the mathematical model and monitoring the control module.
The results show that the costly transportation and COD removal decreased by 50% with DCM solution and 30%
with ICM solution. However, the full validation of the control systems requires yet the measurement of the mean COD values of all tanks, and the comparison of them with the estimated mean COD values. The algorithm of the control module may be improved further, for further reduction of the cost.
ACKNOWLEDGMENT
We thank Marianna Machata for her helpful hints and Chinoin Sanofi Aventis for making possible and helping the measurements.
REFERENCES
[1] Benkő T, Sanyi Á, Mizsey P, Fonyó Zs, Environmental and economic comparison of wastesolvent treatment options, Cent.
Eur. J. Chem., 4 (1) 92-110. ,2006
[2] IPPC Reference Document on Best Available Techniques in Common Waste Water and Waste Gas Treatment/Management Systems in the Chemical Sector, 2003 - ftp://ftp.jrc.es/pub/eippcb/doc/cww_bref_0203.pdf (2011.04.04) [3] Mizsey P, Waste reduction in the chemical industry - a two level
problem, Journal of Hazardous Materials 37 1-13. ,1994 [4] Salgado A.M, Folly R.O.M, Valdman B, Biomass monitoring by
use of a continuous on-line optical sensor, Sensors and Actuators B: Chemical, Volume 75, Issues 1–2: 24-28, 2001
[5] Threasholds for water pollution 28/2004. (XII. 25.) KvVM rendelet a vízszennyező anyagok kibocsátásaira vonatkozó határértékekről és alkalmazásuk egyes szabályairól - http://www.complex.hu/jr/gen/hjegy_doc.cgi?docid=A0400028.K VV April 2012.
[6] Álmos A, Győri S, Horváth G, Várkonyiné Kóczy A, Genetikus Algoritmusok, Thypotex Kiadó,Budapest, 2003
[7] Futó Iván, Mesterséges intelligencia, Aula Kiadó, 2003