HOW TO MEASURE THE LEVEL OF HUMAN DEVELOPMENT AT REGIONAL LEVEL?
CASE STUDY IN THE COUNTRIES OF VISEGRÁD
Lampertné, Akócsi, Ildikó - Goda, Pál - Tóth, Tamás, PhD
Authors: Lampertné, Akócsi, Ildikó, Assistant Professor Collage of Dunaújváros
e-mail: icsoka@hotmail.com Goda, Pál, Assistant Professor e-mail: goda.pal@gtk.szie.hu
Tóth, Tamás, PhD, habil, Assoicate Professor, Vice Dean Szent István University, Faculty of Economics and Social Sciences Institute of Regional Economics and Rural Development
e-mail: toth.tamas.argi@gtk.szie.hu
Reviewers: Szűcs, István, DSc, Professor
Zsarnóczai, J. Sándor, CSc, Associate Professor
Keywords: Development level, Human resources, Human index, Principal component Statistical analysis, Cluster analysis
Abstract
The human factor has become one of the most important resources during the twenty-first century. Knowledge that creates and operates technological development has gained outstanding importance out of the other production factors.
The expanding importance of the human factor can be largely demonstrated by the fact that nowadays one unit of human resource is able to move ever-growing amount of resource value in the production, and it is able to create ever-increasing production value than before.
Consequently, the development level of human resources (DHR) is crucial regarding the performance of economic units, settlements, regions and countries. The DHR strongly influences the size of the created value, the level of development of a given area and its development potential.
These countries’ shared socio-political history, interlinked history and their simultaneous accession to the European Union raise many questions. What kind of similar attributes of DHR can be detected resulting from this multi-dimensional interlinkedness? Are there any similarities reaching beyond borders, or differences contrary to the closeness of these countries?
The first question of this research is which criteria can be used to measure the level of development of human capital. The second question is how regions can be grouped based on the DHR. Geographically the research covers the countries of Visegrád. This article aims to introduce a new Human Development Index based on multivariate statistical methods.
Regions of the countries of Visegrád were chosen as subjects to analyse, because these countries have co-operated for centuries in the spheres of the economy, culture, politics and trade.
Összefoglalás
A XXI. században az emberi tényező vált az egyik legfontosabb erőforrássá. A technológia fejlődésével, az azt létrehozó és működtető tudás kiemelkedett a termelés tényezői közül. Az emberi tényező szerepének növekedése legfőképp abban mutatkozik meg, hogy egy egysége napjainkban egyre nagyobb erőforrás értéket képes a termelésben megmozgatni és egyre nagyobb termelési értéket képes előállítani, mint korábban.
Az emberi erőforrás fejlettsége tehát fontos szerepet játszik egy gazdálkodó egység, egy település, egy régió, egy ország teljesítményében. Jelentősen befolyásolja a létrehozott érték nagyságát, a vizsgált terület fejlettségét és fejlődési lehetőségeit. A kutatás először azt a kérdést vetette fel, hogy milyen ismérvek mentén mérhető a humántőke fejlettsége. Továbbá azt is vizsgálta, hogy az emberi erőforrás fejlettsége alapján, hogyan csoportosíthatók a régiók.
A tanulmány, melynek vizsgálati területe a Visegrádi ország-csoport régiói, kísérletet tesz egy új humánfejlettségi index kidolgozására, mely figyelembe veszi a vizsgált terület sajátosságait. Az index kidolgozása többváltozós statisztikai módszereken alapul, továbbá ötvözi az UNDP által számított HDI mutató és a KSH által kidolgozott MHFM mutató előnyeit.
Introduction
In regional science the recognition of knowledge as key factor of regional development started only in the beginning of the nineties. However, human resources appeared already in the seventies as one of the endogenous factors defined by the endogenous development theory. Later, Romer (1990) 1, who is one of the most important representatives of the “new (endogenous) growth theory”, highlighted in his growth theory the importance of creation of knowledge. The argument of Romer was that knowledge is a determining form of capital and economic growth depends primarily on the level of the accumulation of knowledge. One of the most important attributes of knowledge based economies is that creation and employment of knowledge constitute the essence of the value creation process.
The concentration and qualitative characteristics of human capital can largely determine the opportunities of a given region. Both the attraction of highly qualified people (Zucker, L. G.
and Brewer, M. B, 1998) and the general standard of human capital (Glaeser, E. et al., 1992) are key elements among the external effects of knowledge. These processes are especially true for urban regions (Jacobs, J, 1969), where actors of the economic sector have broad opportunities to expand their relationships; hence, innovations and new ideas can be realized faster.
Data collection and research methods
The economic development can be understood as a structural change with changing qualitative conditions. So development is a qualitative transformation which generates better conditions for the operation of the economy and improves economic competitiveness.
Growth is based on four basic segments: population, natural resources, capital stock (domestic and foreign) and technology. Growth is a quantitative change, since its characteristics and level depend on its elements and it can be measured by the quantitative changes of its elements. Each segment can be described by different indicators. Human population can be described by the number of inhabitants in a given region and its changes (natural increase and population growth rate) or the level of the migration /emigration-immigration (Lengyel, I. - Rechnitzer, J, 2004).
The analysis of human resources cannot be limited to the examination of only one indicator like the changes of the number of inhabitants. (Káposzta, J. et al, 2010). This is only one component which influences a region’s human resources. The population and their changes can feature human resources, by the different components of the population, out of which the level of education and the quality of knowledge ie, the qualification is the most important.
Additionally, human factors can be analyzed by the size of the labour force, the level of activity, the structure of employment and its changes and realignment. Apart from human factors, quality of life can influence the development of human resources in a region.
Nowadays, it is obvious that the cultural level of the population of a region or the activity level of the civil society or the attachment to the region is a core element of development. Life
1Cited in Rechnitzer, 2008
circumstances and its territorial specifics, which can be described by incomes, consumption and settlements’ institutional infrastructure, are also relevant components of the human capital. Furthermore, the network of knowledge and knowledge transfer, which is the different educational levels (elementary, secondary, and higher), and R&D (research and development) and the existence of their institutions and experts are playing a remarkable role to develop the human resources of settlements and regions.
Finally, the milieu of innovation of a settlement as an environment and inspiration for renewal can be understood as a so called “human resource shell” (aura), which is permanently present and influences the life of settlements (Rechnitzer, J, 2008). It can be seen that defining the level of development of human resources is very complex. Several analyses pursued to measure it. Human Development Index (HDI) is one of the definitions and it comes from the United Nations Development Programme (UNDP), and it takes into account some key components to measure the development level of human resources of the countries of the World. One of the components of the HDI is the Gross Domestic Product (GDP) per capita, which indicates the life circumstances and level of economic development. The other component of the HDI is life expectancy at birth which indicates the health conditions of the population. The third component of the HDI demonstrates the quality of education.
The latter component integrates two indicators: adult literacy rate and schooling rate (rate of enrolment of pupils at school). The Hungarian Central Statistical Office (HCSO) developed the Modified Human Development Index. The component indices of the MHDI are: the taxable income per capita, the percentage of the graduates among people aged 25 years and over and the life expectancy at birth. All three components have the same weight in the composite indicator. The MHDI is suitable for monitoring and evaluating the development of countries, regions, counties and micro-regions in the long run.
In the case of developed, primarily European countries, the MHDI is more relevant to provide a method for quantitative measurement of the quality of life as compared to the UNDP’s index applied for all countries of the world which adopts the characteristics of the less developed countries as well.
The MHDI uses the taxable income (TI) per capita instead of the GDP per capita, because this data is available on micro-regional and even on settlement level every year. GDP as an indicator is calculated only on county and regional level. Nevertheless, strong correlation can be found between the GDP per capita and the TI per capita on regional and county level. The percentage of the graduates among people aged 25 years and over is applied as educational indicator, since the adult literacy index is probably almost 100% in the developed or European countries. Life expectancy at birth is the most reliable and precise indirect indicator to describe the public health conditions (Józan, P, 2008).
Following the model of János Rechnitzer (2008) the data has been collected from the database of the EuroStat2. Since principal component analysis requires that there should be five times more cases than the number of variables, we could use only limited number of indicators. As a starting point we used 13 indicators for the 35 regions (Table 1.). All the indicators are relative indicators, whereby the different sizes of the regions do not influence the results. The indicators were processed only after standardization, so that to avoid the mistakes coming from the different units and sizes. Five indicators characterize the human factors, two
2 http://epp.eurostat.ec.europa.eu/portal/page/portal/statistics/search_database
indicators describe the quality of life and two-two indicators describe the standards of life, the network of knowledge and the innovation milieu respectively.
Beyond descriptive statistical tools the methods of principal component analysis and cluster analysis were used in the research. The principal component analysis is used for compacting the information stored in the variables into few uncorrelated factors without losing too much content (Kovács, P. – Lukovics, M, 2006). This method is excellent to carry out statistical analysis in a transformed smaller dimension without wasting useful data.
This method can be used efficiently if there are numerous stochastically strongly correlated variables which contain redundant information (Ketskeméty, L. – Izsó, L, 2005). Cluster analysis is a multivariate statistical and data segmentation method which is suitable for grouping data into homogenous groups. The aim of cluster analysis is to class the examined cases in homogenized groups based on chosen variables. These examined cases have to be similar in one group and have to differ from the other groups (Szelényi, L, 2009).
Table 1. Dimensions of the human resource and Indicators Dimensions of the human
resource Indicators
Human factors
Unemployment rate (15 years and over) % Employment rates (15 years and over) %
Population aged 15 and over tertiary education % Students in tertiary education (ISCED 5-6) - as % of the population aged 20-24 years
Pupils and Students in all levels of education (ISCED 0-6) - as
% of total population
Quality of life Internal regional migration, excluding intra-regional migration per 1000 inhabitant
Net regional migration, excluding intra-regional migration per 1000 inhabitants
Standards of life Life expectancy at given at birth
Gross domestic product (GDP) Euro per inhabitant
Network of knowledge
Employment in technology and knowledge-intensive sectors % Lifelong learning - participation of adults aged 25-64 in education and training
Innovation milieu Human Resources in Science and Technology percentage of total population
Total R&D personnel and researchers percentage of total employment
Source: own editing
Only nine indicators satisfied the criteria related to multiple normality, homoscedasticity, linearity and multicollinearity necessary for conducting principal component analysis. The primary goal of the observation is to compact the information stored in the nine indicators used in the analysis into less, uncorrelated variables. Having fewer variables is useful when demonstrating the findings of the analysis, hence it improves perspicuity and interpretation.
After running principal component analysis, the variables of all the six years were grouped and integrated into three factors in a way that on the one hand the greatest proportion of the common variance of the variables is explained, and on the other hand the eigenvalues of all the three factors is greater than 1.
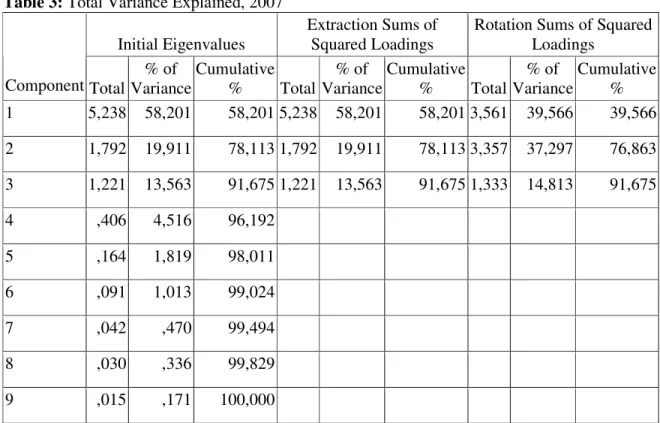
The explained common variance is more than 90% in all the six years, which means that the three factors could well preserve the information stored in the nine variables chosen by the analysis. (Table 2-3)
Table 2: Total Variance Explained in 2002
Initial Eigenvalues Extraction Sums of
Squared Loadings Rotation Sums of Squared Loadings
Component Total % of
Variance Cumulative
% Total % of
Variance Cumulative
% Total % of
Variance Cumulative
% 1 5,262 58,461 58,461 5,262 58,461 58,461 3,785 42,055 42,055 2 1,654 18,377 76,839 1,654 18,377 76,839 3,127 34,749 76,804 3 1,537 17,075 93,914 1,537 17,075 93,914 1,540 17,110 93,914
4 ,214 2,377 96,291
5 ,140 1,553 97,845
6 ,092 1,020 98,865
7 ,055 ,612 99,476
8 ,029 ,322 99,798
9 ,018 ,202 100,000
Extraction Method: Principal Component Analysis
Source: Own calculation and editing based on EUROSTAT, 2002.
The communality of all the nine indicators in all the six years is more than 0.9 except for a few cases. Communality is a coefficient of multiple determination from which the multiple correlation coefficient can be calculated. This coefficient shows the strength of connection between the factors as explaining variables and the original variables as criterion dependent variables. It confirms that the three factors compacted the information stored by the nine indicators well. (Table 4.)
Table 3: Total Variance Explained, 2007
Initial Eigenvalues Extraction Sums of
Squared Loadings Rotation Sums of Squared Loadings
Component Total % of
Variance Cumulative
% Total % of
Variance Cumulative
% Total % of
Variance Cumulative
% 1 5,238 58,201 58,201 5,238 58,201 58,201 3,561 39,566 39,566 2 1,792 19,911 78,113 1,792 19,911 78,113 3,357 37,297 76,863 3 1,221 13,563 91,675 1,221 13,563 91,675 1,333 14,813 91,675
4 ,406 4,516 96,192
5 ,164 1,819 98,011
6 ,091 1,013 99,024
7 ,042 ,470 99,494
8 ,030 ,336 99,829
9 ,015 ,171 100,000
Extraction Method: Principal Component Analysis
Source: Own calculation and editing based on EUROSTAT, 2007.
Table 4: Communalities
Extraction
2002 2003 2004 2005 2006 2007
Gross domestic product (GDP) Euro per inhabitant 0,914 0,935 0,953 0,953 0,952 0,948 Employment rates (15 years and over) % 0,972 0,972 0,965 0,966 0,930 0,963 Population aged 15 and over tertiary education 0,967 0,971 0,971 0,960 0,954 0,946 Life expectancy at given at birth 0,891 0,903 0,893 0,863 0,815 0,780 Employment in technology and knowledge-
intensive sectors
0,943 0,936 0,924 0,916 0,888 0,843 Total R&D personnel and researchers percentage
of total employment
0,942 0,936 0,925 0,923 0,928 0,932 Students in tertiary education (ISCED 5-6) - as %
of the population aged 20-24 years
0,949 0,946 0,942 0,936 0,928 0,926 Human Resources in Science and Technology
percentage of total population
0,942 0,962 0,968 0,961 0,961 0,968 Internal regional migration, excluding intra-
regional migration per 1000 inhabitants
0,932 0,927 0,920 0,922 0,926 0,945
Source: Own calculation and editing based on EUROSTAT, 2002-2007
If we examine which indicators determine the value of the factors, we will know which attribute or characteristic of the region is described by a given factor. The variable content of the three factors is similar in all the observed six years, and the variables that determine the value of the factors with the highest loadings are identical in all the six years. There is a discrepancy however, that the first two factors which defines the common variance of the variables in roughly identical proportion, change places in the second three years of the analysis. We paid attention to this during the analysis.
The variable “Internal regional migration” has the highest loading in determining the value of the third factor in all the six years. The value of the factor increases if the number of emigrants increases in a region. This factor is called “Migration factor”. The first two factors explain more than 75% of the common variance of the original variables in all the observed years. In the first three observed years, the value of the first component is explained by the indicators of “Population aged 15 and over tertiary education” and “Student in tertiary education as % of the population aged 20-24” with almost identical loadings.
Besides, also the indicators of “Total R&D personnel and researchers percentage of total employment” and “Human Resources in Science and Technology percentage of total population” have factor loadings higher than 0.7 in the value of the factor. Consequently, the first factor can be called the “Qualification factor” of human resource. In the second observed three years the value of the principal factor is determined mainly by the indicators of
“Employment rates” and “Employment in technology and knowledge-intensive sectors” (both indicators having factor loadings higher than 0.95). Hence, this factor can be considered the
“Employment factor” of human resource.
One of the aims of the research was to group the observed regions by the development level of human resource. On the basis of the hierarchical clustering four distinctive groups can be formulated.
The first cluster is a knowledge creator cluster. The regions belonging to this cluster have highly qualified human resource and outstanding scientific culture. These regions are characterized by high employment level, high living standards and high number of emigrants.
This cluster involves the Czech, the Hungarian and the Slovakian capitals with the surrounding regions (see the cluster analyse in detailed in case of Czech Republic, Széles, I. – Mubarak Rashid Al-Boainin – Zsarnóczai, J. S, 2010). The reason for the fact that the region of Mazowieckie around the Polish capital is not the member of this cluster is that due to its huge territory it is not capital-centred contrary to the other three countries.
Besides Warsaw, there are other big cities also with similar attributes, e.g. Gdansk, Krakow, and Poznan. Despite the high emigration the net migration rate is positive. GDP per capita in the cluster is twice the second clusters, and three times higher than the average value of the third and fourth clusters’. According to Martin’s grouping (2005) this cluster can be called knowledge-centre cluster, where the “production of knowledge” prevails robustly.
Furthermore, the central social, economic and public administrative processes are also concentrated in these regions, which phenomenon is probably further strengthened by the disproportionate usage of EU funds by these regions.
The members of the second cluster are efficient regions that adopt and apply knowledge. In these clusters it is not knowledge creation that constitutes the main source of competitiveness, but the efficient application of adopted knowledge. In the regions belonging to this group the
rate of emigration is low, the net migration is positive and life expectancy at birth is high.
High life expectancy at birth and low rate of students indicate the problem of aging population. Furthermore, this is the cluster where the share of graduates and the rate of students in tertiary education are the lowest. In the regions of this cluster the average level of employment can be considered good, it almost reaches the value of the first cluster’s, and the GDP per capita is 1.5 times higher than the average value of the third and fourth clusters’.
However, the level of unemployment is double the first cluster’s average level, i.e. 8.11% of the economically active population is unemployed. Seven Czech regions and the Zapadne Slovensko region belong to this cluster.
In the third cluster there are knowledge adopter, depressive regions. In the regions belonging to this cluster either there are no efforts done to improve human resources, either the return on investments is low. This cluster is characterised by lowly qualified human resource and underdeveloped scientific culture. The number of graduates, the number of students in tertiary education and the rate of students are only higher than the second cluster’s relevant figures. In these regions the level of employment is low as compared to the other regions in question. Six Hungarian regions belong to this cluster. In these regions migration propensity is high and life expectancy at birth is low. The attractiveness of these regions is low and the negative migration balance is the highest compared to the other regions.
The members of the fourth cluster are knowledge adopter, steady regions. The cluster is featured by applying the adopted knowledge with medium efficiency. In the cluster the human resource is highly qualified with developed scientific culture, but the employment rate and the living standards are low. All of the Polish regions and two Slovakian regions are situated in this cluster. The rate of emigrants is low and life expectancy at birth is high in the regions belonging to this cluster. The attractiveness of these regions is nonetheless low, which is demonstrated by the negative migration balance contrary to the low level of emigration.
We concluded that cluster membership did not change in the examined six years. It does not mean that the development level of these regions’ human resources did not change, not even that the differences between development levels were locked. One may only draw the conclusion that the regions belonging to a given cluster went through similar development paths concerning their human resources in the examined years.
In the spheres of regional science it can be deemed unusual that the formulated cluster margins hardly cross country borders, but in this case it can be rationally explained. The research has employed the factors of human resource as determinants of spatial organization, which are strongly influenced by national traditions, religion, historical traditions, the political system and other attributes that are strongly associated to the national demarcations. (Table 5- 6-7).
Analysing and illustrating the dynamics of the factor values of the clusters it can be seen that the values of the clusters are reflections of each other. Since the membership of the clusters did not change in the examined period, the fact above proves that the relative position of the clusters changed.
The level of qualification of human resources and the application of the accumulated knowledge in innovations and R&D are the highest in the three capitals making up the first cluster. The latter ability of the cluster was constantly improving during the examined period.
The decreasing value of the “Qualification factor” shows that in this aspect the advantages of
capital regions slightly decreased as compared to the other regions. In this cluster (except for the Central Hungary Region) the employment rate and GDP per capita was the highest and they improved in all the six years analysed. However, its position started to deteriorate from 2006 as compared to the other clusters. Despite outstanding level of qualification and employment circumstances, human resource is characterized by the second highest emigration rate. Depicting the factor, one can see that emigration increases from 2004.
Table 5: Final Cluster Centers, 2002. Table 6: Final Cluster Centers, 2007.
Cluster
1 2 3 4
Qualification and
scholarship 2,64990 -0,82692 -0,29693 0,02484 Employment and
living conditions 1,14886 1,24851 -0,37430 -0,62160 Negative quality of
life, depression
0,59761 -0,27639 1,82898 -0,58642
Cluster
1 2 3 4
Employment and
living conditions 1,37949 1,14053 -0,95512 -0,41844 Qualification and
scholarship 2,32874 -0,92291 -0,27020 0,11213 Negative quality of
life, depression
1,03746 -0,06603 1,65251 -0,69440
Source: own calculation and editing based on EUROSTAT, 2002-2007
Table 7: Cluster member ship of the regions, 2002-2007.
Country Region Cluster Country Region Cluster
SK Bratislavský kraj 1 PL Dolnoslaskie 4
HU Közép-Magyarország 1 PL Kujawsko-Pomorskie 4 CZ Praha 1 PL Lódzkie 4
CZ Jihovýchod 2 PL Lubelskie 4
CZ Jihozápad 2 PL Lubuskie 4
CZ Moravskoslezsko 2 PL Malopolskie 4
CZ Severovýchod 2 PL Mazowieckie 4
CZ Severozápad 2 PL Opolskie 4
CZ Strední Cechy 2 PL Podkarpackie 4
CZ Strední Morava 2 PL Podlaskie 4
SK Západné Slovensko 2 PL Pomorskie 4
HU Dél-Alföld 3 PL Slaskie 4
HU Dél-Dunántúl 3 SK Stredné Slovensko 4
HU Észak-Alföld 3 PL Swietokrzyskie 4
HU Észak-Magyarország 3 SK Východné Slovensko 4 HU Közép-Dunántúl 3 PL Warminsko-Mazurskie 4 HU Nyugat-Dunántúl 3 PL Wielkopolskie 4 PL Zachodniopomorskie 4 Source: own calculation and editing based on EUROSTAT, 2002-2007
One can see on the graphs that the factor values of the fourth cluster are almost the reflections of the first clusters. The value of the “Qualification factor” of the fourth cluster – which involves the Polish and the Middle and Eastern Slovakian regions – is the second highest among the clusters, and it increased during the first five years, and then slightly decreased by 2007. The employment rate of the cluster increased and it changed the cluster’s ranking from the last to the third place concerning this indicator. Migration is low and decreasing in the fourth cluster, which is explained by the improving employment and living conditions.
In the regions of the second cluster the value of the “Qualification factor” is the lowest out of the four clusters and it decreased slowly in the first five years, then in 2007 the value started to increase. In the regions of the second cluster high, but smoothly declining employment rate can be observed. The low migration propensity started to rise rapidly from 2004 in the cluster.
In the third cluster (the Hungarian regions) the value of the “Qualification factor” is low and decreasing, and the value of the “Employment factor” is low and drops sharply from 2003, which is due to the fact that foreign capital employing low-qualified labour force is gradually leaving the regions. Consequently, in these regions the rate of emigration is the highest, which nevertheless improves slightly from 2005 as compared to the other clusters. (Graph 1.)
Source: Own calculating and editing based on EUROSTAT, 2002-2007
Source: Own calculating and editing based on EUROSTAT, 2002-2007
Source: Own calculating and editing based on EUROSTAT, 2002-2007
Human Index
In the three factors produced by the principal component analysis the variables have different loadings, so the factors describe different attributes of the human resource of the regions in question. If we observe the ranking of the regions on the basis of the three factors, one can see that there is a very weak correlation between the ranking positions. Just to mention some examples, in the Middle Czech Region (Strední Cechy) the level of employment is high, the qualification level of the human resource is low and the rate of emigrants is high. In the region (Mazowieckie) surrounding the Polish capital the human resource is highly qualified, the level of employment can be deemed average as compared to the other regions, but low level of emigration can be observed. In Middle Hungary Region the human resource is well qualified with average employment rates, and the rate of emigrants is high. (Table 8)
On the basis of the afore-mentioned findings, we concluded that there is a need for an indicator that takes into account all the three dimensions of human resource. Factor analysis is usually the first step of a strategy of an analysis. Three methods developed in practice with regards to the employment of the findings. One of these methods is the method of factor value, which directly uses the factor values produced by the analysis. The second method is the method of aggravated scale, which integrates the original variables into one variable based on the factors given by the analysis. Finally there is the substitution method, which substitutes given factors with the variables that correlates with them the most.
By reason of the afore-mentioned, we have chosen the variables that have factor loadings higher than 0.9 in the factor value. Since there is only one variable that has factor loading higher than 0.9 in the case of the third factor, we substituted this factor with the standardized value of that variable. The developed three factors measure the employment rate, the qualification and the migration of the human resource of a given region.
Taking the average of the three new factors we obtain such an integrated indicator that describes all the three attributes. To compute the index the results of the analysis of variance can be used as loadings. The development level of human resource is determined by the computed factors with a loading equal to the percentage of the total variance of the examined variables explained by the factor value. On the strength of this, the calculation of the index is based on the following formula:
3 2
1
3 3 2
2 1
1
VAR VAR
VAR
VAR FAC VAR
FAC VAR
HI FAC
+ +
⋅ +
⋅ +
= ⋅
where:
FAC1: value of the first factor FAC2: value of the second factor FAC3 value of the third factor
VAR1 the fraction which is determined by the first factor from all of the variances VAR2 the fraction which is determined by the second factor from all of the variances VAR3 a the fraction which is determined by the third factor from all of the variances
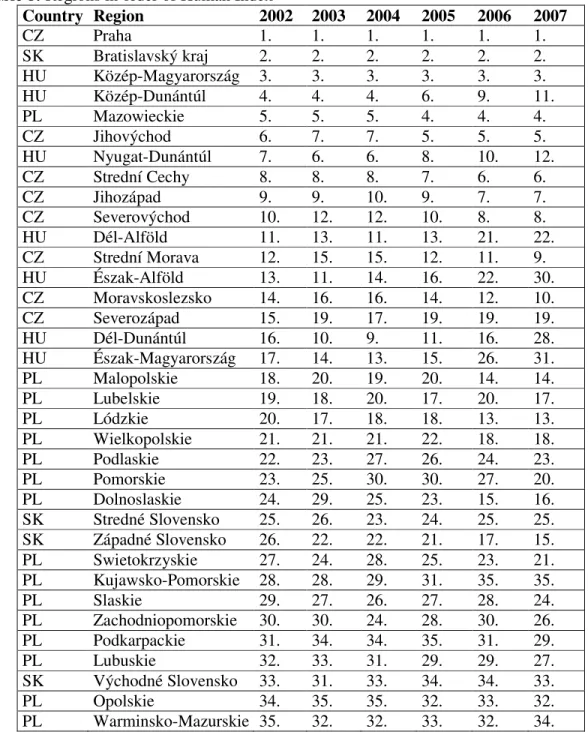
The established ranking based on this index shows that the capitals and the regions surrounding them have the most developed human resource. In this ranking the region around the Polish capital is already situated next the other three capitals on the 4th and 5th place. The sequence produced by the above illustrated human index and the relative changes in the regions’ placements call for further analysis, which exceeds the scope of this research.
Table 8: Regions in order of Human Index
Country Region 2002 2003 2004 2005 2006 2007 CZ Praha 1. 1. 1. 1. 1. 1.
SK Bratislavský kraj 2. 2. 2. 2. 2. 2.
HU Közép-Magyarország 3. 3. 3. 3. 3. 3.
HU Közép-Dunántúl 4. 4. 4. 6. 9. 11.
PL Mazowieckie 5. 5. 5. 4. 4. 4.
CZ Jihovýchod 6. 7. 7. 5. 5. 5.
HU Nyugat-Dunántúl 7. 6. 6. 8. 10. 12.
CZ Strední Cechy 8. 8. 8. 7. 6. 6.
CZ Jihozápad 9. 9. 10. 9. 7. 7.
CZ Severovýchod 10. 12. 12. 10. 8. 8.
HU Dél-Alföld 11. 13. 11. 13. 21. 22.
CZ Strední Morava 12. 15. 15. 12. 11. 9.
HU Észak-Alföld 13. 11. 14. 16. 22. 30.
CZ Moravskoslezsko 14. 16. 16. 14. 12. 10.
CZ Severozápad 15. 19. 17. 19. 19. 19.
HU Dél-Dunántúl 16. 10. 9. 11. 16. 28.
HU Észak-Magyarország 17. 14. 13. 15. 26. 31.
PL Malopolskie 18. 20. 19. 20. 14. 14.
PL Lubelskie 19. 18. 20. 17. 20. 17.
PL Lódzkie 20. 17. 18. 18. 13. 13.
PL Wielkopolskie 21. 21. 21. 22. 18. 18.
PL Podlaskie 22. 23. 27. 26. 24. 23.
PL Pomorskie 23. 25. 30. 30. 27. 20.
PL Dolnoslaskie 24. 29. 25. 23. 15. 16.
SK Stredné Slovensko 25. 26. 23. 24. 25. 25.
SK Západné Slovensko 26. 22. 22. 21. 17. 15.
PL Swietokrzyskie 27. 24. 28. 25. 23. 21.
PL Kujawsko-Pomorskie 28. 28. 29. 31. 35. 35.
PL Slaskie 29. 27. 26. 27. 28. 24.
PL Zachodniopomorskie 30. 30. 24. 28. 30. 26.
PL Podkarpackie 31. 34. 34. 35. 31. 29.
PL Lubuskie 32. 33. 31. 29. 29. 27.
SK Východné Slovensko 33. 31. 33. 34. 34. 33.
PL Opolskie 34. 35. 35. 32. 33. 32.
PL Warminsko-Mazurskie 35. 32. 32. 33. 32. 34.
Source: Own calculating and editing based on EUROSTAT, 2002-2007
Results and conclusions
During the research we firstly tried to define the attributes along which development level of human resource of a region can be described. We found that only few dimensions are not sufficient to describe the development level of the human capital, since it is a complex production factor with numerous features influencing the ability of value creation.
Beyond the level of knowledge and the adaptation ability it is crucial to take into account the human resource’s capability of income generation, the general heath conditions, the quality of life and the standards of living. By the means of principal component analysis we have chosen those indicators that we considered the most representative and then we created three factors out of them. The factors describe the „Qualification”, the „Employment” and the „Migration”
aspects of human resource.
We carried out the analysis using the data of the years from 2002 on for six years, and we received the same three factors for all the six years. By the means of cluster analysis the thirty-five regions were grouped into four clusters along the three factors. The demarcation between the groups is based on the similarities and differences of human resources, and not primarily on the development level of human resources.
We differentiated the knowledge creator, the efficient knowledge adopter, the depressive knowledge adopter and the steady knowledge adopter clusters on the basis of the characteristics of human resource. Cluster margins are almost identical with the country borders in all the six years, which is due to the fact that the characteristics of human resource are strongly linked to the historic, political and national attributes.
The final aim of the research was to create a new Human Development Index which is based on the results of the principal component analysis. Based on this new index we compiled the human development ranking of the regions of the countries of Visegrád. Though our analysis is suitable to conduct temporal comparison with the findings in the given six years and for the given regions, the research is only valid to type and rank the regions of the Visegrád countries on the basis of the development level of their human resource. We plan to compare the above- described ranking with the regions’ competitiveness ranking and to explore the connections.
Acknowledgement
Research was supported/subsidized by the TÁMOP-4.2.2.B-10/1 „Development of a complex educational assistance/support system for talented students and prospective researchers at the Szent István University” project.
References
Becker, G. S. (1964): Human Capital, National Burean of Economic Research, NewYork Farkasné, F. M. – Molnár, J. (2006): Mikroökonómia tankönyv, Szaktudás Kiadóház, Budapest Glaeser, E, - Kallal, H.D, - Scheinkman, J.D. - Shleifer, A. (1992) Growth in cities. Journal of
Political Economy 100, pp. 1126- 1152.
Jacobs, J. (1969): The Economy of Cities. Random House, New York.
Jankó, B. (2010): A tudás szerepe a gazdasági növekedésben – az alapmodellek bemutatása, Statisztikai Szemle, Vol. 88. Nr. 1., pp. 47-72.
Jánossy, F. (1966): A gazdasági fejlődés trendvonala és a helyreállítási periódusok. Közgazdasági és jogi Könyvkiadó
Józan, P. (2008): A módosított humánfejlettségi mutató (MHFM) és alkalmazhatósága az életminőség mérésében, Statisztikai Szemle, Vol. 86., Nr. 10-11.
Káposzta, J. –Nagy, H. – Kollár, K. (2010): Borsod-Abaúj-Zemplén és Szabolcs-Szatmár-Bereg megye leghátrányosabb helyzetű kistérségeinek településszerkezeti, foglalkoztatási jellemzői az EU-csatlakozás óta eltelt időszakban. Területi Statisztika, 50 (6.) 641-658 p.
Ketskeméty, L. – Izsó, L. (2005): Bevezetés az SPSS programrendszerbe, Módszertani útmutató és feladatgyűjtemény statisztikai elemzésekhez, ELTE Eötvös Kiadó, Budapest
Kovács, P. – Lukovics, M. (2006): Classifying Hungarian Sub-regions by their Competitiveness.“Globalization Impact on Regional and Urban Statistics” SCORUS 25th Conference on Urban and Regional Statistics and Research, Wroclaw.
Kozma, F. (1980): A termelési tényezők összetétele és népgazdasági szerepe. Statisztikai Szemle 1980. Nr. 8-9.
Lengyel, I. – Rechnitzer, J. (2004): Regionális gazdaságtan, Dialóg Campus Kiadó, Budapest-Pécs Lengyel, I. (2003): A regionális versenyképesség értelmezése és piramismodellje, Verseny és
területi fejlődés, JATEPress, Szeged
Lengyel, I. (2006.): A regionális versenyképesség értelmezése és piramismodellje, Területi Statisztika 9. Vol. (46.) Nr. 2., pp. 131-147.
Mátyás, A. (1999):A modern közgazdaságtan története. AULA Kiadó, Budapest
Mihalik, I. (1993): Nobel-díjas közgazdászok és a humánerőforrás. Ipargazdaság, október pp.11-12.
Nagy, H. – Káposzta, J. (2010): Social and regional aspects of the Structural and Cohesion Funds in the new EU member states between 2007-2013. In: Peter Bielik et al.: Economics, Social Policy and Citizenship in the European Union (Evidence of V4 countries and perspectives for Ukraine), Slovak University of Agriculture in Nitra, Nitra, pp. 148-167,
ISBN 978-80-552-0448-2
Obádovics, Cs.(2004): Területi információs rendszer adatfeldolgozás módszerei, SZIE GTK, Budapest
Pethő, Gy. (2004): A közgazdasági elmélet fejlődése, A gazdasági rend, Gödöllő
Rechnitzer, J.(2008): A regionális fejlődés erőforrásainak átrendeződése, új súlypont: a tudás. In:
Lengyel I. – Lukovics M. (ed.): Kérdőjelek a régiók gazdasági fejlődésében.
JATEPRESS Kiadó, Szeged, pp. 13-25.
Schultz, T. W. (1983): Beruházás az emberi tőkébe. Közgazdasági és Jogi Könyvkiadó Szelényi, L. (2009): Multivariate Methods of Econometrics, Cluster Analysis, Gödöllő Szelényi, L. (2009): Multivariate Methods of Econometrics, Discriminant Analysis, Gödöllő Szelényi, L. (2009): Multivariate Methods of Econometrics, Factor Analysis, Gödöllő
Szelényi, L. (2009): Multivariate Methods of Econometrics, Principal Component Analysis, Gödöllő
Széles, I. – Mubarak Rashid Al-Boainin – Zsarnóczai,. J. S. (2010): Territorial differences or territorial similarities? – The analysís of regional competitiveness examining the 8 statistical egions of Bohemia (Területi különbségek vagy területi hasonlóságok – regionális versenyképesség elemzése Csehország 8 régiójának statisztikai elemzése alapján), pp. 139- 169; Abstract p. 140, Összefoglalás pp. 140-141.
In Economics of Sustainable Agriculture. Scientific Book Series. The III. Volume.
Gödöllő, 2010. Szent István University, Faculty of Economic and Social Sciences, Doctorate School of Management and Business Administration. p. 251, Editing Board:
Szűcs István (főszerkesztő/ head of editing board); Zsarnóczai J. Sándor (felelős szerkesztő/managing editor of editing board); Molnár József; Benet Iván; Szabó Gábor;
Szabó Lajos; Villányi László; Hajós László; Lehota József; Farkasné Fekete Mária;
Kanizsay Endre; Khaled Karim; Mrs. Mária Kadlecíková (FAO/ Slovakia); Magdalena Hrabankova (Czech Republic); Alvaro Standardi (Italy); Francis Nwonwu (South Africa); Carlos Noéme (Portugal), Peter Bielik (Slovakia), Ajay Kumar Singh (India).
ISBN 978-963-269-145-9.
Szűcs, I. (2008) (ed.): A tudományos megismerés rendszertana, Gazdálkodás és szervezéstudományok, Szent István Egyetemi Kiadó, Budapest
Tóth, T. – Pupos, T. – Görög, M (2008): Területi tervezés és programozás. Ed.: Tóth, T. Szent István Egyetemi Kiadó Gödöllő, ISBN 978-963-269-027-8
Tóth, T. (2009) (ed.): Regionális gazdaságfejlesztés és menedzsment, SzIE Gödöllő Gazdaság- és Társadalomtudományi Kar, Gödöllő, pp. 37.-50.,79.-126.
Tóthné Sikora, G. (2000): Humán erőforrások gazdaságtana, Bíbor Kiadó, Miskolc
Zucker, L.G. és Brewer, M.B. (1998) Intellectual human capital and the birth of U.S. biotechnology enterprises. American Economic Review 88, pp. 290-306.
http://epp.eurostat.ec.europa.eu/portal/page/portal/statistics/search_database 14-03-2011 http://hdr.undp.org/en/statistics/indices/hdi/ 14-03-2011