Variations in exercise ventilation in hypoxia will affect oxygen uptake
J.A. LOEPPKY
1,2p, R.M. SALGADO
3, A.C. SHEARD
4, D.O. KUETHE
5and C.M. MERMIER
61Department of Health, Exercise and Sports Sciences, University of New Mexico, Albuquerque, NM 87131, Canada
2Research Section, VA Medical Center, Albuquerque, NM 87108, Canada
3United States Army Research, Institute of Environmental Medicine, Thermal and Mountain Medicine Division, Natick, MA 01760, USA
4School of Kinesiology and Nutritional Science, California State University, Los Angeles, CA 90032, USA
5New Mexico Resonance, Albuquerque, NM 87106, Canada
6Department of Health, Exercise and Sports Sciences, University of New Mexico, Albuquerque, NM 87131, Canada
Received: February 13, 2020 • Accepted: July 3, 2020 Published online: October 3, 2020
© 2020 Akademiai Kiado, Budapest
ABSTRACT
Reports of VO2response differences between normoxia and hypoxia during incremental exercise do not agree. In this study VO2andVEwere obtained from 15-s averages at identical work rates during continuous incremental cycle exercise in 8 subjects under ambient pressure (633 mmHg ≈1,600 m) and during duplicate tests in acute hypobaric hypoxia (455 mmHg≈4,350 m), ranging from 49 to 100% of VO2peak in hypoxia and 42–87% of VO2peak in normoxia. The average VO2was 96 mL/min (619 mL) lower at 455 mmHg (n.s.P50.15) during ramp exercises. Individual response points were better described by poly- nomial than linear equations (mL/min/W). TheVEwas greater in hypoxia, with marked individual vari- ation in the differences which correlated significantly and directly with the VO2difference between 455 mmHg and 633 mmHg (P50.002), likely related to work of breathing (Wb). The greaterVEat 455 mmHg resulted from a greater breathing frequency. When a subject’s hypoxic ventilatory response is high, the extra work of breathing reduces mechanical efficiency (E). Mean ΔE calculated from individual linear slopes was 27.7 and 30.3% at 633 and 455 mmHg, respectively (n.s.). Gross efficiency (GE) calculated from
pCorresponding author. Present address: 2725 7th Street South, Cranbrook, BC V1C4R8, Canada. Tel.:þ1 (250) 489 4597; fax:þ1 (250) 426 4440. E-mail: Loeppkyj@telus.net
mean VO2and work rate and correcting forWbfrom aVE–VO2relationship reported previously, gave corresponding values of 20.6 and 21.8 (P 50.05). Individual variation in VEamong individuals over- shadows average trends, as also apparent from other reports comparing hypoxia and normoxia during progressive exercise and must be considered in such studies.
KEYWORDS
altitude acclimatization, hypobaric hypoxia, incremental exercise, mechanical efficiency, normobaric hypoxia, work of breathing
INTRODUCTION
Sophisticated techniques have been employed to quantify the direct relationship between ex- ercise ventilation (VE) and VO2, suggesting that the work of breathing (Wb) should be taken into account when VO2response is the dependent variable (1, 2). This has been rarely considered when comparing exercise VO2 responses in normoxia and hypoxia in many situations and environments.
Studies comparing the amount of oxygen consumed in response to incremental or stepwise exercise between normoxia and hypobaric have received considerable attention by exercise physiologists. Inequality in the VO2 responses over the same work rate range has been attributed to differences in anaerobic metabolism (3–5), time lags in the rise time of VO2(6, 7), mechanical efficiency (8), and O2 stores (9). The VO2 response characteristics have also been used to assess changes with acclimatization to hypoxia and exercise training, with dis- similar results (10, 11). Investigators often assume a linear relationship between VO2and work rate (slope: mL/min/W) in these studies, often to calculate and compare delta efficiency (ΔE).
However, the average VO2or total O2consumed during incremental exercise can be obtained without the assumption of linearity to estimate gross efficiency (GE). A few reports have indicated that VO2 is lower during incremental exercise in hypoxia over the same power output (5, 12, 13), suggesting increased mechanical efficiency, but some disagree (14). In- spections of averaged data from many studies where VO2–work rate relationships during exercise in hypobaric hypoxia and normoxia are available favor a lower VO2and lower slope in hypoxia than normoxia (15–19).
Some studies have reported that the mechanical efficiency of exercise is reduced in acute hypobaric hypoxia (8, 20) or increased when breathing hypoxic gas mixtures (5) relative to lower equivalent altitudes. Findings are not consistent and discrepancies may be due to variations in exercise testing protocols, gas exchange measuring devices, differences in ventilatory responses and definitions of mechanical efficiency.
This study compares the total oxygen consumed in hypobaric hypoxia (455 mmHg) and normoxia (ambient: 633 mmHg) during incremental exercise in the same subjects over identical work rates from≈46 to 94% of VO2peak without assuming slope linearity. The focus is on the effect that variability among subjects in the hypoxic ventilatory response might have on the difference of the VO2response between normoxia and hypoxia.
Substantial variation in individuals’hypoxic ventilatory drive during exercise will affect the quantification of differences in pulmonary gas exchange between normoxia and hypoxia. This
432 Physiology International107 (2020) 3, 431–443
must be taken into consideration in studies of mechanical efficiency, evaluation of altitude acclimatization, and any exercise studies that involve hypoxia.
METHODS
These data were obtained during a research study previously reported with a different focus (21–
23). Eight male volunteers were cyclists and runners consistently performing an average of 6 hr/
wk of moderate and 2–3 hr/wk of vigorous exercise during the year prior to, and during the study. Means±SD for VO2peak, age and weight were 55±5 mL/min/kg, 28±6 yr and 75.4± 8.4 kg, respectively. All subjects resided between 1,500 and 1,600 m for at least 6 months before the study and during data collection. Written informed consent was obtained, as approved by the Human Research Review Committee at the University of New Mexico.
Each subject completed two incremental VO2peak tests. One test took place under ambient conditions at 633±3 mmHg (1,600 m) and one following acute exposure to reduced pressure in a decompression chamber at 455±1 mmHg, equivalent to 4,350 m according to the equation of West (24). All subjects first completed the test at 633 mmHg with hypobaric chamber doors open, and 6–9 days later performed the test at 455 mmHg. Subjects were tested at the same time of day at both pressures and refrained from strenuous exercise, caffeine, and alcohol for 24 hr prior to testing. The average ambient temperature for all tests was 22±28C. For tests at 455 mmHg the“ascent”rate was 20 mmHg/min; subjects then rested approximately 30 min prior to initiating exercise.
The VO2peak tests were performed on an electronically-braked cycle ergometer (Velotron DynaFit Pro, RacerMate, Spearfish, SD). Gas exchange was continuously measured breath-by- breath with a metabolic cart (ParvoMedics True One 2400, Sandy, UT). Heart rate (HR) was continuously monitored via telemetry (Polar Electro, model FS1, Woodbury, NY), while O2 saturation (SpO2) was measured by finger pulse oximeter (GO2 Pulse Oximeter, Philips Respironics, Andover, MA). Cycling at each subject’s preferred cadence began at 70 W for the first minute and the work rate then increased 35 W every minute until volitional fatigue or inability to maintain the work rate. The average exercise time to reach VO2peak was 9.5±1.4 min at 633 mmHg and 8.5 ± 1.5 min at 455 mmHg. The average of VO2 and associated ventilatory measurements over 15-s intervals from 33 to 100% of peak work rate were recorded.
Each 35-W work rate increment was divided into four quarters to coincide with the 15-s measurement intervals. The average number of recorded points for the 16 tests was 22 (range:
16–26). The measured values for the tests at 633 and 455 mmHg were then superimposed and compared at identical work rates. The analyzed points at 455 mmHg included those between 49 and 100% of VO2peak and at 633 mmHg those between 42 and 87% of VO2peak because of the 15% average reduction of VO2 peak by all subjects at 455 mmHg.
Calculations and statistics
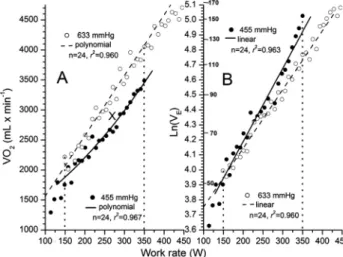
The average VO2,VE, and other gas exchange measurements within the work rate range for each subject was obtained by summing all values within the range and dividing by the number of points. These averages for each of the 8 subjects were compared at 633 and 455 mmHg by paired t-test. As an example, the VO2 values for one subject are shown in Fig. 1A and the
correspondingVEvalues inFig. 1B. The VO2curves shown inFig. 1Aare those obtained by a 2nd order polynomial equation (VO25AþBWþCW2) because retrospectively the integrated value of this equation divided by the work rate range closely approximated the averaged values, as the mean±SD of the absolute differences for VO2for the 16 curves was 2.6±1.6 mL/min.
The O2difference in mL between 455 and 633 mmHg is represented by the area denoted“X”in Fig. 1A. This value of 2,504 mL was obtained by multiplying the VO2difference (mL/min) between 455 and 633 mmHg by exercise time, i.e., [(2,606 3,042) 201W/35W/min)]. In Fig. 1Athe positive coefficient of theCterm at 455 mmHg indicates upward curvature and the small negative term in normoxia indicates downward curvature. The curves for VE were ob- tained by integration of the equation Ln(VE)5AþB(W), as the mean±SD of these absolute differences from the averaged values was 0.6±0.3 L/min.
The VO2 vs. work rate slope is utilized to obtain ΔE (25, 26), which is defined as, “the quotient of an amount of extra external mechanical power to the increase in metabolic power needed to overcome this amount of extra external mechanical power”(27). The VO2values are converted to metabolic power with the constant of 0.00505 Kcal/mL of O2 at RER 5 1.00 determined by Lusk (28). By multiplying VO2 (mL/min) by 4186 J/Kcal and min 60/s, the metabolic power in units of J/s is obtained and ΔE in percent is: 100 3 [1/(mL/min/W 3 0.3523)]. Thus, a decrease in slope indicates an increase inΔE. TheΔEis theoretically preferred to GE and net efficiency because of the difficulties in making baseline subtractions for VO2at rest for the latter (29).
Data are reported as means ± SD. Paired t-tests were used to determine significance of differences between gas exchange measurements at 633 and 455 mmHg. The significance of the linear slope differences between pressures was computed byt-test, as described by Crow et al.
(30). The significance of differences between linear and polynomialfits to the data was deter- mined by F-tests. The correlation coefficient between variables was obtained by least squares linear regression. The level of significance wasP ≤0.05.
RESULTS
Comparison of VO
2over equal work rate ranges at 455 and 633 mmHg
The average of mixed expired PCO2, PO2, and SpO2during the work rate range was significantly lower at 455 mmHg compared to 633 mmHg (24.4±3.1 vs. 31.0±3.8 mmHg and 60.9±3.6 vs.
90.4 ± 3.8 mmHg) and 76.7± 2.8 vs. 93.1 ± 2.4%, respectively. The average respiratory ex- change ratio (RER) and HR tended to be higher at 455 mmHg (1.01±0.05 vs. 0.95±0.05 and 151 ±12 vs. 141±15 b/min),P5 0.07 for both.
The individual values for the 8 subjects for O2 and ventilatory components are shown in Table 1as determined over the course of exercise as the average of the individual 15-s averages.
The corresponding linear slope values are also indicated. At 455 mmHg the average O2uptake was 619 mL lower than at 633 mmHg for 6 of the 8 subjects, but was not significant. These O2
differences were not significantly correlated with the differences in linear slopes (P 5 0.30).
However, VO2at both pressures correlated significantly withVE, and the work rate range, which is to be expected as the latter varied among subjects. TheVEwas better correlated with the work rate interval at 633 mmHg (r50.66,P50.07) than at 455 mmHg (r50.29,P50.49). The positive correlation between the differences between pressures inΔVO2andΔVEwas significant
434 Physiology International107 (2020) 3, 431–443
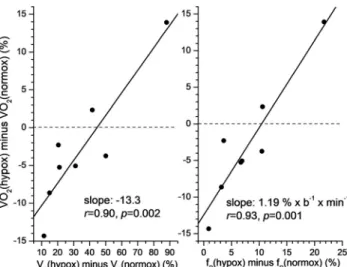
(P50.028). This is summarized inFig. 2Awhere percent changes for VO2andVEare shown to take into account body size differences.Fig. 2B shows that the breathing frequency differ- ence (ΔfR) also correlates highly with theΔVO2difference and is the main contributor to the variability ofΔVE, indicated by a coefficient of variation of 60%. This is also indicated by the r-value betweenΔVEvs.ΔfRof 0.96 (P< 0.001). The difference in tidal volume (ΔVT) also correlates significantly withΔVO2, but these changes are relatively small, as the increase in VE with hypoxia is≈97% due to fRincreases. The relationship betweenΔVT andΔfRwas negative (r 5 0.52), but not significant, suggesting that increases in ΔfR in hypoxia overrode possible increases inVT. The correlations ofVE,fR, andVTdifferences with linear slope differences in Table 1 were not significant, with r-values of 0.08, 0.26, and 0.44, respectively.
The values forΔE, calculated from the slopes inTable 1were 27.7±1.7% at 633 mmHg and 30.3±3.8% at 455 mmHg, but not significantly different (P50.13). TheΔEdifferences were not significantly correlated withΔVO2(r50.48,P50.23). GE was calculated from VO2as 1003ΔW31/(mL/min3418630.00505/60). These values are 19.5±1.4 and 20.3±2.5%
at 633 and 455 mmHg, respectively, and were also not different between normoxia and hypoxia (P50.23), but these differences correlated highly withΔVO2(r50.98), as expected. The GE values are lower than forΔEbecause VO2now includes that at rest and work before 33% of the maximum work rate where recordings began.
Fig. 1.VO2andVEmeasurements for subject 1. Panel A: VO2values are averaged over the same work rates from 149 to 350 W at 455 and 633 mmHg. At 633 mmHg: VO253,042 and at 455 mm Hg: VO252,606, for a difference of436 mL/min or2,504 mL (4363201/35) denoted as areaXas indicated inTable 1.
The difference between the integration of the bestfit polynomial equations at 633 mmHg [Y 5486þ 10.55(X)0.0012(X2)] and 455 mmHg [Y51,174þ3.36(X)þ0.0090(X2)] between the dotted lines gives corresponding values of 3,043, 2,603, and440 mL/min. Panel B: At 633 mmHg:VE578.9 L/min and at 455:VE588.0 L/min, for a difference of 9.1 L/min. Integration of the bestfit linear equations of Ln(VE) vs.W at 633 mmHg [Y53.3619þ0.0039(X)] and 455 mmHg [Y53.2126þ0.0049(X)] between the dotted lines
gives corresponding values of 78.7, 87.4, and 8.7 L/min
Table 1.Mean±1.0 SD values between5125±15 and 312±43 W for 8 subjects at 633 and 455 mmHg pressure VO2(mL/min)
Slope
(mL/min/W) VE(L/min BTPS) fR(b/min) VT(L BTPS)
Subject (ΔW) 633 455 Δ(mL) 633 455 Δ 633 455 Δ 633 455 Δ 633 455 Δ
1 (201) 3,042 2,606 2,504 9.97 7.85 2.12 78.9 88.0 9.1 25.8 26.7 0.9 3.06 3.30 0.24
2 (202) 2,778 2,843 375 11.29 8.97 2.32 81.8 115.9 34.1 27.2 37.8 10.6 3.01 3.07 0.06
3 (131) 2,128 2,424 1,108 10.21 10.90 0.70 57.8 108.7 50.9 24.0 45.7 21.7 2.41 2.38 0.03
4 (201) 2,606 2,381 1,292 9.44 9.40 0.04 70.3 80.8 10.5 25.0 28.2 3.2 2.81 2.87 0.05
5 (219) 3,000 2,848 951 10.41 8.32 2.09 84.5 110.8 26.3 27.4 34.3 6.9 3.08 3.23 0.15
6 (184) 2,787 2,640 773 10.32 9.05 1.27 97.9 118.6 20.7 33.7 40.4 6.7 2.91 2.94 0.03
7 (210) 3,092 2,976 696 11.01 10.63 0.38 73.9 110.9 37.0 26.6 37.1 10.5 2.78 2.99 0.21
8 (149) 2,265 2,213 221 9.60 10.87 1.26 52.8 63.6 10.8 21.0 24.6 3.6 2.51 2.59 0.07
Mean 2,712 2,616 619 10.28 9.50 0.78 74.7 99.7 24.9 26.3 34.4 8.0 2.82 2.92 0.10
SD 358 265 1,087 0.64 1.18 1.37 14.6 19.8 15.0 3.6 7.3 6.5 0.25 0.31 0.09
Pdiff. 0.15 0.15 0.002 0.010 0.020
rvs.ΔVO2 – 0.42 0.76 0.84 0.74
Sign. ofr – 0.30 0.028 0.009 0.037
ΔW: work rate range for each subject.
Δ(mL) is calculated as (VO2at 455–VO2at 633)3W/35W/min.
Bold:P<0.05.
436PhysiologyInternational107(2020)3,431–443
Comparison of combined VO
2vs. work rate measurements
The 179 points for all subjects at both pressures, each a 15-s average of VO2, are shown inFig. 3, with the curves of the polynomial equations that describe the two sets of data points, with linear
Fig. 3.Individual data points (179) for 8 subjects from≈46 to 94% of VO2peak at 455 and 633 mmHg. The lines calculated by bestfit polynomial and linear equations are indicated
Fig. 2.Panel A: Significant relationship between percent change in VO2andVEfrom 633 mmHg to 455 mmHg in 8 subjects. Panel B: Significant relationship between increase in fRand percent change in VO2
from 633 mmHg to 455 mmHg in 8 subjects
equations also indicated in the legend. The bestfit linear least squares regression slope at 455 mmHg (PIO2585 mmHg) is 8.90 and is significantly lower (P< 0.001,t55.27) than the 10.54 value at 633 mmHg (PIO2 5 123 mmHg). The polynomial fits to the data points suggest downward curvature at both pressures, barely noticeable at 633 mmHg, but more apparent at 455 mmHg. However, anF-test comparing the variances of the linear vs. polynomialfit at 633 mmHg resulted inP50.51 (F50.995) andP50.42 (F51.032) at 455 mmHg. Thus, there is no evidence that the polynomial fit is statistically superior at either pressure for the grouped points.
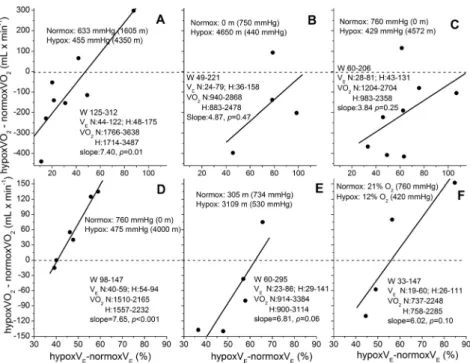
Fig. 4.Association of percent increases of VEin hypoxia over normoxia and corresponding VO2 dif- ference during incremental exercise from individuals in 6 studies. Data for VEand VO2for each study were analyzed as shown in Fig. 1A and B. Panel A: this study, with continuous ramp cycling in hypobaric hypoxia. Panel B: from Pugh et al. (16), with continuous and discontinuous ramp cycling at altitude. Panel C: from Sutton et al. (18) and Reeves et al. (36) in OEII, with continuous and discon- tinuous ramp cycling in hypobaric hypoxia. Panel D: from Stenberg et al. (37), with discontinuous cycling in hypobaric hypoxia. Panel E: from Reeves et al. (17), with discontinuous treadmill running at altitude. Panel F: from Hughes et al. (38), with continuous cycling with hypoxic gas mixture. All re- lationships are positive, indicating an average increase of 6 mL/min of VO2 above normoxia per one percent increase inVE. The average increase in peakVEwith hypoxia is 70%; indicating thatWbcould have contributed≈420 mL/min to peak VO2in hypoxia. The average minimum and maximum values for subjects in each study are noted for work rate (W),VEand VO2in normoxia (N) and hypoxia (H),
with linear slopes of regressions shown
438 Physiology International107 (2020) 3, 431–443
DISCUSSION
A large variation in individual’s VE response to hypoxia has been previously reported and characterized (31). Undoubtedly the increased work of breathing (Wb) contributes to the close correlation between differences inVEand VO2noted inFig. 2A. The O2cost of breathing can amount to 10% or more of total VO2 during maximal exercise hyperpnea as the cost rises exponentially with work rate (1, 2). For example, subject 2 inTable 1reached a maximalVEof 184 L/min at 455 mmHg, compared to 85 L/min at the same work rate at 633 mmHg. This difference in VE amounts to ≈322 mL/min of VO2 according to the Wb vs. VE relationship reported by Dominelli et al. (2), where VO251.04þ52.6 e(VE/84.3). Any reduction inWbfrom reduced air density at 455 mmHg is likely of minor influence because at 455 mmHg theVEis higher and bronchoconstriction (32) and interstitial pulmonary edema (19) due to hypoxia probably contribute toWb. The increased cost at 455 mmHg is likely further enhanced by the higherfRwhich may be above the optimal frequency to minimize Wb(33, 34). TheWbvs.VE
relationship above would reduce the mean VO2averages inTable 1by 138 and 190 L/min at 633 and 455 mmHg, respectively.
The VO2values shown inFig. 3are the same below≈175 W. This is not surprising, as the slope has been reported to be similar in normoxia and hypoxia during steady state submaximal exercises at lower work rates at simulated altitude (22) and with hypoxic gas mixtures (12).
Linear slopes of the curves in Fig. 3are generally similar to the average curves during incre- mental exercise utilizing hypoxic gas mixtures previously reported (13, 35). However, the sig- nificant difference in linear slopes between 633 and 455 mmHg in Fig. 3 is misleading as a general axiom because only 4 of the individual comparisons showed a significantly lower slope at 455 mmHg, with a higher slope at 633 mmHg occurring in 2 of 8 subjects (n.s.), with essentially no difference in 2 subjects. A polynomialfit to the individual VO2vs. work rate curves resulted in three positive values for theC term at 633 and two at 455 mmHg (upward curvature, pre- sumably related to enhancedWb) and 5 negatives values at 633 and 6 at 455 mmHg (downward curvature, presumably related to anaerobic metabolism). To avoid the questionable assumption of linearity it seems more appropriate to utilize the individual differences in VO2or O2(mL) in Table 1, rather than average curve slope shown in Fig. 3to quantify differences between the normoxia and hypoxia.
The direct relationship between VE and VO2 shown in Fig. 2is further supported by in- spection of other reported studies indicated in Fig. 4, where individual subject’s data were available for exercise in hypoxia and normoxia at the same work rates. These plots were con- structed fromfive studies where four or more points were reported for individual subjects as referenced in thefigure legend, using polynomialfits to VO2and linearfits to Ln(VE) vs. work rate as described in Fig. 1A and B. The change in VO2 from normoxia to hypoxia is clearly related to the percentage increase in VE(BTPS) by individuals in these diverse studies and subjects, even though statistical significance of the relationships is inconsistent, mainly due to the paucity of subjects.
VO
2differences in normoxia and hypoxia during incremental exercise
Table 1andFig. 4indicate thatΔVO2vs.Δwork rate slope differences between normoxia and hypoxia are mainly attributable to individual variations in theVEresponse to hypoxic exercise.
The VO2differences measured over a range of continuous or discontinuous incremental work rates, rather than the calculated linear slope of VO2seem more accurate for estimating differ- ences between hypoxia and normoxia because minor deviations from linearity will have an appreciable effect on the result. For example, if differences in efficiency at 633 and 455 mmHg are of interest, to avoid the assumption of linearity GE can be calculated from VO2values in Table 1for the 8 subjects and reducing VO2forVEpredicted according to the relationship by Dominelli et al. (2) above. These“non-respiratory”values are 20.6±1.6 and 21.8±2.6) and are now significantly different between 633 and 455 mmHg (P5 0.05). The corresponding mean GE values for thefive studies shown inFig. 4are 21.1±7.8 and 22.7±8.9% in normoxia and hypoxia, respectively.
Some studies report that an increase in anaerobic metabolism contributes to the lower VO2 rise during exercise in hypoxia because as exercise in hypoxia progresses there is an increasing contribution by this energy source (3–5, 13). Unless compensated for by increasedWb, this would tend to lower the VO2 vs. work rate slope at higher work levels and result in a lower overall slope and higherΔE, especially at 455 mmHg, which was not the case here. The present study suggests that a greater increase in VE will offset a decrease in VO2 in hypoxia during exercise because there was no greater downward curvature in 8 individuals in hypoxia, as indicated by theCterm in the polynomials being only slightly more negative at 455 mmHg than at 633 mmHg (t50.22,P5 0.89).
A time lag in VO2 during a ramp exercise while breathing hypoxic gas has also been pro- posed (4, 6, 7). These studies suggest that when the exercise stages during a continuous in- cremental exercise are too large the VO2will lag behind in response to each load increment, thus reducing the slope. In partial contradiction to this, and the proposed greater anaerobic meta- bolism in hypoxia, is the observation that the post-exercise O2consumption after peak intensity exercise is similar in hypoxia and normoxia (39–43).
Another consideration is that the O2 kinetics after the onset of exercise is affected by a reduction in body O2stores (9). This is important when beginning exercise in hypoxia, as in the present study, where the initial phase of exercise will exhibit a lower VO2at the mouth while body O2stores are utilized. This early reduction in VO2as blood O2saturation decreases would increase the overall VO2 vs. work rate slope.
The lower density of the inspired air in hypobaric hypoxia in this study requiredVE(BTPS) to increase over the average work interval by 44% to supply the same VO2, but the average VE(STPD) increased only 33%. This deficiency inVE(STPD) during acute hypoxia (presumably because of the acute nature of the hypoxia) may predispose the VO2to be lower in hypoxia. The actualVEresponse to maintain the O2requirements of the increasing workloads will vary with the sensitivity of the hypoxic chemoreceptors of the individual subjects. Ventilation during exercise increases at given work rates with altitude acclimatization (44, 45) and by affecting VO2 may also contribute to the inconsistent conclusions regarding the effect of acclimatization on efficiency estimates computed from the VO2–work rate slopes that was mentioned earlier.
In summary, these findings suggest that the variations in VE responses to exercise in hypobaric hypoxia may contribute substantially to the inconsistent results of previously reported comparisons of VO2 and computations of efficiency between normoxia and hypoxia during incremental exercise. These data suggest a slightly smaller VO2for the same work rate at 455 vs.
633 mmHg, but certainly studies with more subjects are required for confirmation. The variation ofVEresponses to hypoxia of selected research subjects must be taken into account in studies
440 Physiology International107 (2020) 3, 431–443
comparing gas exchange at different levels of PIO2and linear presumptions of VO2vs. work rate relationships can be misleading.
ACKNOWLEDGEMENTS
We thank Dr. P.D. Wagner, University of California San Diego, for providing gas exchange data for the individual subjects in the OEII studies summarized in references36and18. The opinions or assertions contained herein are the private views of the author(s) and are not to be construed as official or reflecting the views of the Army or the Department of Defence. Any citations of commercial organizations and trade names in this report do not constitute an official Depart- ment of the Army endorsement of approval of the products or services of these organizations.
The authors declare that they have no conflicts of interest.
REFERENCES
1. Aaron EA, Seow KC, Johnson BD, Dempsey JA. Oxygen cost of exercise hyperpnea: implications for per- formance. J Appl Physiol 1992; 72: 1818–25.
2. Dominelli PB, Render JN, Molgat-Seon Y, Foster GE, Sheel AW. Precise mimicking of exercise hyperpnea to investigate the oxygen cost of breathing. Respir Physiol Neurobiol 2014; 201: 15–23.
3. Engelen M, Porszasz J, Riley M, Wasserman K, Maehara K, Barstow TJ. Effects of hypoxic hypoxia on O2 uptake and heart rate kinetics during heavy exercise. J Appl Physiol 1996; 81: 2500–8.
4. Lador F, Tam E, Adami A, Kenfack MA, Bringard A, Cautero M, et al. Cardiac output, O2delivery and VO2
kinetics during step exercise in acute normobaric hypoxia. Respir Physiol Neurobiol 2013; 186: 206–13.
5. Prieur F, Benoit H, Busso T, Castells J, Denis C. Effect of endurance training on the VO2-work rate rela- tionship in normoxia and hypoxia. Med Sci Sports Exerc 2005; 37: 664–9.
6. Hughson RL, Kowalchuk JM. Kinetics of oxygen uptake for submaximal exercise in hyperoxia, normoxia, and hypoxia. Can J Appl Physiol 1995; 20: 198–210.
7. Murphy PC, Cuervo LA, Hughson RL. A study of cardiorespiratory dynamics with step and ramp exercise tests in normoxia and hypoxia. Cardiovasc Res 1989; 23: 825–32.
8. Noordhof DA, Schoots T, Hoekert DH, de Koning JJ. Is gross efficiency lower at acute simulated altitude than at sea level? Int J Sports Physiol Perform 2013; 8: 319–22.
9. Di Prampero PE, Boutellier U, Pietsch P. Oxygen deficit and stores at onset of muscular exercise in humans. J Appl Physiol Respir Environ Exerc Physiol 1983; 55: 146–53.
10. Latshang TD, Turk AJ, Hess T, Schoch OD, Bosch MM, Barthelmes D, et al. Acclimatization improves submaximal exercise economy at 5533 m. Scand J Med Sci Sports 2013; 23: 458–67.
11. Lundby C, Calbet JA, Sander M, van Hall G, Mazzeo RS, Stray-Gundersen J, et al. Exercise economy does not change after acclimatization to moderate to very high altitude. Scand J Med Sci Sports 2007; 17: 281–91.
12. Benoit H, Busso T, Prieur F, Castells J, Freyssenet D, Lacour JR, et al. Oxygen uptake during submaximal incremental and constant work load exercises in hypoxia. Int J Sports Med 1997; 18: 101–5.
13. Iba~nez J, Rama R, Riera M, Prats MT, Palacios L. Severe hypoxia decreases oxygen uptake relative to intensity during submaximal graded exercise. Eur J Appl Physiol Occup Physiol 1993; 67: 7–13.
14. Heubert RA, Quaresima V, Laffite LP, Koralsztein JP, Billat VL. Acute moderate hypoxia affects the oxygen desaturation and the performance but not the oxygen uptake response. Int J Sports Med 2005; 26: 542–51.
15. Bender PR, Groves BM, McCullough RE, McCullough RG, Huang SY, Hamilton AJ, et al. Oxygen transport to exercising leg in chronic hypoxia. J Appl Physiol 1988; 65: 2592–7.
16. Pugh LGCE, Gill MB, Lahiri S, Milledge JS, Ward MP, West JB. Muscular exercise at great altitudes. J Appl Physiol 1964; 19: 431–40.
17. Reeves JT, Grover RF, Cohn JE. Regulation of ventilation during exercise at 10,200 ft in athletes born at low altitude. J Appl Physiol 1967; 22: 546–54.
18. Sutton JR, Reeves JT, Wagner PD, Groves BM, Cymerman A, Malconian MK, et al. Operation Everest II:
oxygen transport during exercise at extreme simulated altitude. J Appl Physiol 1988; 64: 1309–21.
19. Wagner PD, Gale GE, Moon RE, Torre-Bueno JR, Stolp BW, Saltzman HA. Pulmonary gas exchange in humans exercising at sea level and simulated altitude. J Appl Physiol 1986; 61: 260–70.
20. Clark SA, Bourdon PC, Schmidt W, Singh B, Cable G, Onus KJ, et al. The effect of acute simulated moderate altitude on power, performance and pacing strategies in well-trained cyclists. Eur J Appl Physiol 2007; 102:
45–55.
21. Loeppky JA, Sheard AC, Salgado RM, Mermier CM. VESTPD as a measure of ventilatory acclimatization to hypobaric hypoxia. Physiol Int 2016; 103: 377–91.
22. Salgado RM, Sheard AC, Vaughan RA, Parker DL, Schneider SM, Kenefick RW, et al. Mitochondrial effi- ciency and exercise economy following heat stress: a potential role of uncoupling protein 3. Physiol Rep 2017;
5: e13054.
23. White AC, Salgado RM, Astorino TA, Loeppky JA, Schneider SM, McCormick JJ, et al. The effect of 10 days of heat acclimation on exercise performance in acute hypobaric hypoxia (4350 m). Temperature 2016; 3:
176–85.
24. West JB. Prediction of barometric pressures at high altitude with the use of model atmospheres. J Appl Physiol 1996; 81: 1850–4.
25. Coyle EF, Sidossis LS, Horowitz JF, Beltz JD. Cycling efficiency is related to the percentage of type I muscle fibers. Med Sci Sports Exerc 1992; 24: 782–8.
26. Gaesser GA, Brooks GA. Muscular efficiency during steady-rate exercise: effects of speed and work rate. J Appl Physiol 1975; 38: 1132–9.
27. Bijker KE, De Groot G, Hollander AP. Delta efficiencies of running and cycling. Med Sci Sports Exerc 2001;
33: 1546–51.
28. Lusk G. The elements of the science of nutrition. 3rd ed. Philadelphia, USA: W B Saunders; 1917 [Table, p.
61].
29. Stainsby WN, Gladden LB, Barclay JK, Wilson BA. Exercise efficiency: validity of base-line subtractions J Appl Physiol Respir Environ Exerc Physiol 1980; 48: 518–22.
30. Crow EL, Davis FA, Maxfield MW. Statistics manual. New York, NY: Dover; 1960. pp.160–1.
31. Eisele JH, Wuyam B, Savourey G, Eterradossi J, Bittel JH, Benchetrit G. Individuality of breathing patterns during hypoxia and exercise. J Appl Physiol 1992; 72: 2446–53.
32. Cruz JC. Mechanics of breathing in high altitude and sea level subjects. Respir Physiol 1973; 17: 146–61.
33. Bartlett RG, Jr., Brubach HF, Spect H. Oxygen cost of breathing. J Appl Physiol 1958; 12: 413–24.
34. Kennard CD, Martin BJ. Respiratory frequency and the oxygen cost of exercise. Eur J Appl Physiol Occup Physiol 1984; 52: 320–3.
35. Walsh ML, Banister EW. The influence of inspired oxygen on the oxygen uptake response to ramp exercise.
Eur J Appl Physiol 1995; 72: 71–5.
442 Physiology International107 (2020) 3, 431–443
36. Reeves JT, Groves BM, Sutton JR, Wagner PD, Cymerman A, Malconian MK, et al. Operation Everest II:
preservation of cardiac function at extreme altitude. J Appl Physiol 1987; 63: 531–9.
37. Stenberg J, Ekblom B, Messin R. Hemodynamic response to work at simulated altitude, 4,000 m. J Appl Physiol 1966; 21: 1589–94.
38. Hughes RL, Clode M, Edwards RH, Goodwin TJ, Jones NL. Effect of inspired O2on cardiopulmonary and metabolic responses to exercise in man. J Appl Physiol 1968; 24: 336–47.
39. Asmussen E, Dobeln WV, Nielsen M. Blood lactate and oxygen debt after exhaustive work at different oxygen tensions. Acta Physiol Scand 1948; 15: 57–62.
40. Consolazio CF, Nelson RA, Matoush LR, Hansen JE. Energy metabolism at high altitude (3,475 m). J Appl Physiol 1966; 21: 1732–40.
41. Fellmann N, Bedu M, Spielvogel H, Falgairette G, Van Praagh E, Coudert J. Oxygen debt in submaximal and supramaximal exercise in children at high and low altitude. J Appl Physiol 1986; 60: 209–15.
42. Raynaud J, Martineaud JP, Bordachar J, Tillous MC, Durand J. Oxygen deficit and debt in submaximal exercise at sea level and high altitude. J Appl Physiol 1974; 37: 43–8.
43. Shephard RJ, Bouhlel E, Vandewalle H, Monod H. Anaerobic threshold, muscle volume and hypoxia. Eur J Appl Physiol Occup Physiol 1989; 58: 826–32.
44. Dejours P, Kellogg RH, Pace N. Regulation of respiration and heart rate response in exercise response to altitude acclimatization. J Appl Physiol 1963; 18: 10–8.
45. Hansen JE, Vogel JA, Stelter GP, Consolazio CF. Oxygen uptake in man during exhaustive work at sea level and high altitude. J Appl Physiol 1967; 23: 511–22.