NEW METHODS FOR COMPUTER BASED BLOOD GLUCOSE LEVEL PREDICTION
Ph.D. Thesis
Rebaz Ahmed Hama Karim
Supervisors Dr. István Vassányi
Dr. István Kósa
Doctoral School of Information Science and Technology University of Pannonia
Veszprém, Hungary 2020
DOI:10.18136/PE.2021.794
New methods for computer based blood glucose level prediction
Thesis for obtaining a PhD degree in the Doctoral School of Information Science and Technology of the University of Pannonia
in the branch of Information Sciences Written by Rebaz Ahmed Hama Karim
Supervisor(s): Dr. István Vassányi and Dr. István Kósa
propose acceptance (yes / no) ………. ……….
(supervisor/s)
As reviewer, I propose acceptance of the thesis:
Name of Reviewer: …... …... yes / no
……….
(reviewer) Name of Reviewer: …... …... yes / no
……….
(reviewer)
The PhD-candidate has achieved …...% at the public discussion.
Veszprém, ……….
(Chairman of the Committee)
The grade of the PhD Diploma …... (…….. %) Veszprém,
……….
(Chairman of UDHC)
Table of Contents
Table of Contents ... iii
List of Figures ... v
List of Tables ... vi
List of Abbreviations ... vii
Statement of Original Authorship ... ix
Kivonat ...1
Abstract ...3
Astratto ...5
Chapter 1: Introduction ... 7
Chapter 2: Background and previous work ... 9
2.1 Glucose and insulin control in the human body ...9
2.2 Diabetes mellitus and its management ... 11
2.2.1 Insulin types ... 13
2.3 Glucose measurement ... 14
2.4 Mathematical models ... 15
2.4.1 Glucose absorption models ... 15
2.4.2 Glucose control and insulin absorption system ... 17
2.5 Assessment of prediction model errors ... 19
2.6 The Lavinia lifestyle mirror application ... 22
2.7 Clinical trials ... 24
2.7.1 The HK4 clinical trial ... 24
2.7.2 The HK5 clinical trial ... 25
2.7.3 Data availability ... 26
2.8 Problem statement ... 26
2.9 Overview of the chapters ... 26
Chapter 3: Examination of blood glucose response curves and diet relationship in a small scale study ... 28
3.1 Methods ... 28
3.2 Results ... 31
3.3 Discussion and conclusion ... 34
Chapter 4: Basal insulin management for blood glucose prediction modeling ... 35
4.1 Background ... 35
4.2 Related work ... 36
4.3 Materials and methods ... 37
4.4 Data sets ... 40
4.5 Results ... 41
4.5.1 Results for the 180-minute predictions ... 41
4.5.2 Wake-up BGL prediction ... 44
4.5.3 EGA evaluation ... 44
4.6 Discussion ... 45
4.7 Summary ... 46
Chapter 5: Blood glucose prediction using artificial intelligence ... 47
5.1 Introduction ... 47
5.2 Background ... 48
5.3 An overview of artificial neural networks used for BGL prediction ... 51
5.4 Methods ... 55
5.4.1 Training data and model training ... 57
5.4.2 FNN training and evaluation ... 58
5.4.3 Data used for training and validation ... 59
5.4.4 Ethical considerations ... 60
5.4.5 Data processing tools ... 60
5.5 Results ... 61
5.5.1 Comparison of FNN-NUT/FNN-NUT-GI to FNN-ABS ... 63
5.6 Discussion ... 66
5.6.1 Comparison to related work ... 67
5.7 Conclusion and future work... 69
Acknowledgments ... 71
Theses ... 72
Thesis 1. Characterizing the relationships between diet and BGL response in a small scale study (Chapter 3) ... 72
Thesis 2. Basal insulin management for blood glucose prediction modeling (Chapter 4) ... 72
Thesis 3. Blood glucose prediction using artificial intelligence (Chapter 5) ... 73
Applicability of new scientific results ... 74
Summary ... 75
References ... 77
List of Figures
Figure 1. Changes in the permeability (glucose permeability) of cell walls ... 10
Figure 2. Schematic/qualitative flow chart of global blood glucose control ... 11
Figure 3. Examples of physiologic insulin delivery ... 13
Figure 4. Ordinary fingertip blood glucose meter Continuous Glucose Monitoring device .. 14
Figure 5. Structure of the two-compartment glucose absorption model ... 16
Figure 6. Error grid analysis ... 22
Figure 7. Panels of the Lavinia lifestyle application ... 23
Figure 8. Sample of paper based diabetic dietary. ... 24
Figure 9. BGL response curve characterization ... 29
Figure 10. BGL response curves of the first 3 day’s breakfast for the 6 healthy volunteers .. 30
Figure 11. 282 meals for 20 patients form 3 clusters with respect to V1-V3 parameters... 31
Figure 12. Representation of the response curves for the 3 clusters ... 32
Figure 13. The core idea of the basal insulin management method ... 38
Figure 14. Comparison of Profile 1 and profile 2 ... 40
Figure 15. Normal cumulative prediction error distribution for the 4 insulin profiles... 42
Figure 16. Clark error grid. The result of a P15 patient’s dataset ... 44
Figure 17. Structure of the biological neuron. ... 49
Figure 18. Structure of the artificial neuron... 49
Figure 19. Glucose absorption in the blood of two alternative meals ... 56
Figure 20. Meal absorption curve represented by numerical parameters ... 57
Figure 21. FNN-NUT, FNN-NUT-GI and FNN-ABS model error comparison ... 64
Figure 22. Clarck Error Grid evaluation comparison for 1, 2 and 3 hrs. prediction horizons . 65 Figure 23. A typical meal’s measured BGL and predicted BGL values of the P03 patient ... 66
Figure 24. Prediction results compared with results from other studies ... 69
List of Tables
Table 1. Recommended target blood glucose level ranges for type 2 and type 1 diabetic. .. 12
Table 2. Glucose control model parameters (kgBW = weight in kilograms) [23] ... 18
Table 3. Total absolute error and MAE of BGL prediction with and without clustering ... 33
Table 4. MAE of BGL prediction with own cluster and with other cluster response. ... 33
Table 5. The parameter set of the four tested insulin profiles for the five basal insulin ... 39
Table 6. Patient characteristics. ... 40
Table 7. Average improvement, Biggest improvement and Worse results data ... 42
Table 8. Paired t-test result for prediction errors of the original method and new method . 43 Table 9. Recent studies on NN based BGL prediction ... 54
Table 10. Components of two meals and their nutritional values. ... 56
Table 11. Properties of the datasets used for the study ... 59
Table 12. Number of monitoring days and meals used for FNN training and validation ... 60
Table 13. Results of the FNN-ABS method for the five patients ... 61
Table 14. Results of FNN-NUT method for the five patients ... 62
Table 15. Results of FNN-NUT-GI method for the five patients ... 62
Table 16. Prediction accuracy gain of FNN-ABS over FNN-NUT ... 64
List of Abbreviations
ARNN Autoregressive Artificial Neural Network BGL Blood Glucose Level
CC Correlation Coefficient
CGMS Continuous Glucose Monitoring System
CH Carbohydrates
Cmax Maximum insulin concentration in plasma DDE Delay Differential Equations
DIAS Diabetes Advisory System DM Diabetes Mellitus
EGA Error Grid Analysis
EM Expectation Maximization
FNN Feed-forward Artificial Neural Network GA Genetic Algorithms
GI Glycemic Index
MAE Mean Absolute Error
MIRDC Pannon University, Medical Informatics Research and Development Centre
MLP Multilayer Perceptron
MSPE Mean Squared Prediction Error NN Artificial Neural Network RMSE Root Mean Square Error
RNN Recurrent Artificial Neural Network T1DM Type 1 Diabetes Mellitus
T2DM Type 2 Diabetes Mellitus Teff Effective half-lives
Tmax Maximal absorption time
Weka Waikato Environment for Knowledge Analysis
Statement of Original Authorship
The work contained in this thesis has not been previously submitted to meet requirements for an award at this or any other higher education institution. To the best of my knowledge and belief, the thesis contains no material previously published or written by another person except where due reference is made.
Signature: _________________________
Date: September 24, 2020
Kivonat
Jelen dolgozatban a vércukorszint-modellezés területén végzett tudományos kutatásomat ismertetem, az annak eredményeként megalkotott új módszereket, valamint a már meglévő modelleken végzett továbbfejlesztési javaslatokat, melyek célja a cukorbetegek vércukorszintjének pontosabb előrejelzése.
Kísérleti adatok segítségével bemutattam, hogy az egyéni vércukorszint- válaszgörbe alakulása a korábbi ismert válaszreakciók és egy-egy étkezés összetétele alapján milyen mértékben reprodukálható, jósolható.
Megmutattam, hogy ezek a válaszreakciók jellegzetesek mind az egyén, mind az étkezés típusa szempontjából. Ezek alapján kidolgoztam egy válaszfüggvény-alapú, rövid távú vércukorszint-előrejelzési módszert, és megmutattam, hogy a válasz klaszterek alapján történő jellemzéssel javítható a válaszreakció-alapú előrejelzés megbízhatósága.
Munkám során emellett továbbfejlesztettem egy életmód-tanácsadó szakértői rendszerbe integrált vércukorszint-előrejelző modellt, a bázis inzulinok hatásának pontosabb modellezésére. Ehhez egy olyan korrekciós eljárást dolgoztam ki, melynek alapja az, hogy a korábbi megközelítésben használt egyetlen nagyobb bázisinzulin-adag helyett kisebb bólusinzulin- adagok sorozata kerül felhasználásra. Kísérleti eredményekkel igazoltam, hogy a javasolt módszer több javulást hozott az éjszakai előrejelzések esetében és az ébredési vércukorszint-becslés pontosságán is.
Egy új, tápanyag-felszívódási modellre épülő módszert dolgoztam ki vércukorszint-előrejelző mesterséges neurális hálózatok tanításához. Ennek újszerűségét az adja, hogy a gyakran használt megoldással ellentétben a nyers szénhidrát értékek helyett a glükózfelszívódási modell által kiszámított görbét használom a tanítási bemenetként. Pontosabban, a felszívódási görbe numerikus jellemzőit, az alkalmazott inzulin dózisokkal és a mért vércukorszint értékekkel együtt. Az új modell előrejelzési pontossága minden olyan eddig közölt, akár modell, akár neurális háló alapú eredményt felülmúl, mellyel a javasolt módszer közvetlenül összehasonlítható.
Abstract
In this dissertation, the results of my research done in the field of blood sugar modeling are presented. I have introduced new methods and developed upgrades for existing models in order to predict blood sugar levels of diabetic patients more accurately.
I examined to what extent the individual blood glucose response curve could be reproduced and predicted based on previously recorded responses and diet logs. I have shown such responses are characteristic to both the individual and the type of meal consumed. I developed a short-term blood glucose prediction method based on the response function, and have shown that characterization based on response clusters can improve the reliability of response-based prediction.
I upgraded a blood glucose prediction model, integrated into a lifestyle counseling expert system, to model the effect of basal insulins more precisely.
I introduced a correction procedure that is based on using a series of smaller bolus insulin doses instead of a single larger base insulin dose. I demonstrated by experimental results that the predictions of the proposed method produced better results for the night periods and also improved the prediction accuracy of wake-up blood glucose.
I have developed a new method for blood glucose prediction by training artificial neural networks based on a nutrient absorption model. The novelty of my model is that the curve calculated by the glucose absorption model is used as the training input of the neural network, instead of raw carbohydrate values. More precisely, I used the numerical characteristics of the absorption curve, the applied insulin doses and the measured blood glucose values. The predictive accuracy of the new model exceeds all previously reported results, whether model or neural network, with which the proposed method can be directly compared.
Astratto
In questa dissertazione vengono presentati i risultati della mia ricerca svolta nel campo della modellazione della glicemia. Ho introdotto nuovi metodi e sviluppato aggiornamenti per i modelli esistenti al fine di prevedere i livelli di zucchero nel sangue dei pazienti diabetici in modo più accurato.
Ho esaminato in che misura la curva di risposta della glicemia individuale poteva essere riprodotta e prevista sulla base delle risposte registrate in precedenza e dei registri dietetici. Ho dimostrato che tali risposte sono caratteristiche sia dell'individuo che del tipo di pasto consumato. Ho sviluppato un metodo di previsione della glicemia a breve termine basato sulla funzione di risposta e ho dimostrato che la caratterizzazione basata su cluster di risposta può migliorare l'affidabilità della previsione basata sulla risposta.
Ho aggiornato un modello di previsione della glicemia, integrato in un sistema esperto di consulenza sullo stile di vita, per modellare l'effetto delle insuline basali in modo più preciso. Ho introdotto una procedura di correzione basata sull'utilizzo di una serie di dosi di insulina in bolo più piccole invece di una singola dose di insulina base più grande. Ho dimostrato con risultati sperimentali che le previsioni del metodo proposto hanno prodotto risultati migliori per i periodi notturni e hanno anche migliorato l'accuratezza della previsione del glucosio nel sangue al risveglio.
Ho sviluppato un nuovo metodo per la previsione della glicemia allenando reti neurali artificiali basate su un modello di assorbimento dei nutrienti. La novità del mio modello è che la curva calcolata dal modello di assorbimento del glucosio viene utilizzata come input di allenamento della rete neurale, invece dei valori dei carboidrati grezzi. Più precisamente, ho utilizzato le caratteristiche numeriche della curva di assorbimento, le dosi di insulina applicate e i valori di glicemia misurati. L'accuratezza predittiva del nuovo modello supera tutti i risultati precedentemente riportati, sia di modello che di rete neurale, con i quali il metodo proposto può essere direttamente confrontato.
Chapter 1: Introduction
The body balances BGL in the blood through a complex, coordinated regulatory mechanism in which insulin, the hormone produced in the beta cells of the Langerhans Islands, plays a key role. Insulin regulates the uptake of glucose by cells in the body. With the exception of the brain, all the cells in the body need sufficient and effective insulin to absorb glucose, the main energy source, from the blood. In addition, insulin is the main regulating hormone for the body's overall metabolism, both carbohydrate, fat, and protein. When there is not enough insulin in the body or if for some reason it is unable to work, the BGL is raised.
Diabetes mellitus (DM) is a widespread chronic metabolic disorder in which cells of the body are unable to take up glucose from the blood in sufficient volume, resulting in abnormally high blood glucose levels (BGL). The cause of this phenomenon is the absolute or relative lack of insulin. Accordingly, we can speak of type 1 or type 2 diabetes mellitus (T1DM or T2DM). The two types are significantly different in etiological (causal) terms. In T1DM, due to autoimmune disease, insulin production is virtually eliminated and must be replaced externally. In the case of T2DM, there is limited insulin production and/or increased insulin resistance, consequently, cells have limited ability to absorb circulating glucose. All T1DM and some T2DM patients use external insulin, most often in the form of subcutaneous injections, typically one injection for each main meal, and all DM patients must take special care of their diet to prevent overly low BGL (hypoglycemia), which can lead to an emergency, as well as overly high BGL (hyperglycemia), which may cause severe complications if it is sustained for a long time. In practice, this means that the patients on external insulin must estimate their insulin needs such that it matches their daily meals—for which they can rely on some general medical guidelines, frequent fingertip BGL measurements, and their personal experience.
The dissertation is structured as follows.
In chapter 2, background and related work are overviewed.
In chapter 3, a meal log based BGL prediction method is proposed. The results of two experiments are used to validate solely meal log based BGL prediction, without using mathematical models. The meal-wise responses characterized with three numerical parameters and the characteristics of the postprandial blood glucose response curves for meals and persons were examined.
In chapter 4, a new method for modeling long-acting (basal) insulin absorption is presented. The new method improves the accuracy of the BGL prediction model.
The proposed method simulates the absorption of basal insulin as a series of smaller insulin doses according to four alternative ‘dosing profiles’, such that the original time interval is divided into shorter subintervals with lower Maximal absorption times (Tmax). This approach is in contrast with the original approach of using a single big dose of bolus insulin.
In chapter 5, a neural network based prediction method is presented. The model uses a new training method for a neural network in which an absorption model is applied that uses the nutrient contents of meals. The numerical characteristics of the computed absorption curve are fed to the neural network as training inputs along with the applied insulin doses and BGL evolution measured by a Continuous Glucose Monitoring (CGM) system. For comparison, another version of the training in which raw carbohydrate values are used as dietary inputs has also been implemented.
Chapter 2: Background and previous work
This chapter provides a brief overview of glucose/insulin control processes in the human body, blood glucose level (BGL) measurement methods, and relevant earlier results achieved at the Medical Informatics Research and Development Centre (MIRDC). Specific background overviews will also be presented later in the relevant chapters.
2.1 GLUCOSE AND INSULIN CONTROL IN THE HUMAN BODY
Though the new scientific results presented in this thesis are in the field of informatics and it was not an objective of my work to improve or change the referenced, validated absorption and BGL regulation models, in this section I give a short overview of the underlying physiological processes for a better understanding of the problem domain.
Glucose is a source of energy for the cells that the body provides primarily from the carbohydrates it ingests. In physiological cases, the body tries to regulate glucose levels within a relatively narrow range (glucose homeostasis) through regulatory mechanisms. Increased blood glucose levels in the pancreas after a meal are sensed by β-cells in the so-called Langerhans Islands (in addition, there are many distributed sensors ranging from the taste buds to parts of the intestinal tract).
Upon sensing glucose levels, β-cells, on the one hand, deliver their "ready"
insulin molecules into the bloodstream (rapid response) and begin to produce additional insulin molecules (slow response). In the case of long-term glucose surplus, the number of working -cells increases, in part by increasing their life cycle, or according to other assumptions, by increasing their number [1]–[3].
The regulation (lowering) of BGL at the cellular level is achieved by the action of insulin hormone, which allows cells to take up glucose from the blood through the cell membrane, thereby reducing BGL. Insulin achieves glucose uptake by opening the cell membrane glucose uptake pathways. Most cells import glucose by
a process of facilitative diffusion mediated by members of the Glut family of membrane transport proteins. Human Glut family stand of 14 glut proteins and they include transporters for substrates other than glucose, including fructose, myoinositol, and urate. Gluts 1-4 have specific roles in cellular and whole body glucose homeostasis
GLUT1, the erythrocyte glucose transporter is the first GLUT isoform identified, and it is expressed at highest levels in the endothelial of barrier tissues such as blood vessels and the blood-brain barrier [4]. GLUT2 is found mainly in liver, pancreatic β-cells, intestine, kidney and hepatocytes [5]. GLUT3 is the major neuronal glucose transporter, and the brain highly relies on GLUT3 beside GLUT1 [6]. GLUT4 is the insulin-regulated glucose transporter found in adipose tissues, heart muscles, and skeletal muscles and it is responsible for insulin-regulated glucose disposal [4]. Figure 1 shows how insulin achieves glucose uptake by opening glucose uptake channels in the cell membrane through GLUT4 an insulin-regulated glucose transporter.
Figure 1. Changes in the glucose permeability of cell walls.
Symbolically, insulin through the cell membrane insulin receptor opens the “cellular gate” for the influx of glucose
molecules through an activated glucose transporter [7].
When blood glucose levels fall (e.g. due to physical activity), pancreas’s α-cells produce the hormone glucagon, which in the liver converts to glucose and then circulates in the blood to increase the amount of glucose. Figure 2 illustrates a
simplified process of blood glucose control (glucose homeostasis, the dynamic stability of the internal environment)[7].
Figure 2. Schematic and qualitative flow chart of global blood glucose control (L: low, N: normal, H: high BGL)[7].
The control system maintains the BGL between 4.0 to 5.9 mmol/l when fasting and under 7.8 mm/l 2 hours after meal.
2.2 DIABETES MELLITUS AND ITS MANAGEMENT
Experiments have shown that under normal physiological conditions, shortly after nutrition (2 minutes), the first, pulsed phase of insulin secretion begins, which stops after 10–15 min, when the second phase of insulin secretion starts.
Experimental studies have also shown that in the case of T2DM, an early sign of abnormal function is a lack of first-phase. This phenomenon has been explained by the fact that during the pre-diabetic state, an increased insulin resistance develops (i.e., an abnormal amount of insulin is required for a normal biological response). As a result, -cells are slowly “depleted” and this results in the disappearance of the first phase[8].
When the glucose control system is unable to maintain a state called homeostasis, pharmacological regulation may also be required beside nutritional restrictions and lifestyle development to manage the new situation. It is common that taking one medicine alone is not enough to achieve adequate BGL, in which
case it may be necessary to take more than one medicine at the same time, and it may be necessary to supplement the treatment with insulin therapy to keep the BGL in appropriate range. Insulin types are detailed in subsection 2.2.1.
Target ranges of BGL may differ depending on age, duration of diabetes, the type of used medication. Table 1 provides general guidance. An individual target set by a healthcare team is the one that patient should aim for.
Table 1. Recommended target blood glucose level ranges for type 2 and type 1 diabetic.
DM Type Before meal 2 hours after a meal Type 2 diabetes 4 to 7 mmol/l under 8.5 mmol/l Type 1 diabetes 4 to 7 mmol/l 5 to 9 mmol/l
In the case of T2DM, persistently improper nutrition and obesity are largely responsible for the development of the disease. It follows that prevention can also be achieved primarily through proper lifestyle/nutrition and physical activity. There are restrictions/recommendations on both food intake and physical activity for patients with T2DM. The regulatory task is to optimize food intake, limit/personalize carbohydrate intake in both quantity and quality. Carbohydrate-containing foods differ in their effects on blood glucose concentrations as the same carbohydrate content but a lower glycemic index (GI) intake will produce lower glucose concentration. In other words, the GI shows the BGL raising effect of a certain food, ranging from 0 (for water) to 140 (for glucose itself) [9].
The primary clinical objective is to keep the mean blood glucose level within the specified limits. In clinical practice, HbA1c levels are used to characterize/monitor mean blood glucose levels, which are monitored by measurements every three months on average. HbA1c, or glycated hemoglobin, is a form of hemoglobin found in red blood cells that stains blood red, in which it binds glucose to hemoglobin. The ratio of glucose-bound (glycosylated) hemoglobin to total hemoglobin (expressed as a percentage) is an important laboratory parameter in the treatment of diabetes. It can be used to determine the patient's average BGL over the past three months. The goal of diabetes treatment is to keep HbA1c below
6.5% so that long-term complications of diabetes should not occur until later or not at all.
Recent studies suggest that HbA1c alone does not characterize the condition of a T2DM patient, as a correct diagnosis and therapy also requires information about BGL variability. According to the research results, the therapy should keep not only the average BGL, but also the glucose variance value low [10].
2.2.1 Insulin types
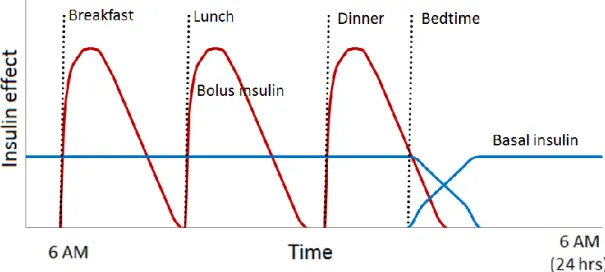
There are two major types of insulin products, fast acting insulins (bolus) and long basal insulin. Bolus insulin is specifically taken at meal times to keep blood glucose levels under control following a meal. Bolus insulin needs to act quickly; it is also known as short acting insulin or rapid acting insulin. According to current practice, insulin dependent diabetic patients use basal insulin injections typically once a day, to maintain a basic, continuous insulin level for the whole day (which is important especially during the night and the wake-up period), and bolus injections 3-4 times a day. Since the role of basal insulin is to keep blood glucose levels at consistent levels during periods of fasting, basal insulin need to act over a relatively long period of time. The goal of subcutaneous insulin therapy is to imitate both the normal prandial insulin secretion and the basal insulin levels as close as possible. An idealized insulin dosing regimen can be seen in Figure 3.
Figure 3. Effect of insulin administration. The red curve shows an idealized theoretical approximation of the effect of
the once-daily basal insulin that has ~ 24-hour duration of
action. Rapidly acting bolus insulins are used as prandial insulins that the patient administers at meal time (green
curve).
2.3 GLUCOSE MEASUREMENT
The BGL is the concentration of glucose present in the blood of humans.
Glucose is a simple sugar and approximately 4 grams of glucose is present in the blood of a 70-kilogram human at all times [11]. The international standard way of measuring blood glucose levels is in terms of the molar concentration, measured in mmol/l (millimoles per liter). The BGL measurement usually contains single or continuous values. The single point BGL values are measured by ordinary fingertip blood glucose meters, while the continuous BGL values are measured by Continuous Glucose Monitoring (CGM) systems (Figure 4). These latter devices measure tissue glucose level every 2 or 5 minutes, which results in a little time-shift compared to the fingertip blood glucose meter in terms of the current BGL value.
CGM sensors are not as accurate as fingertip blood glucose meters. Studies comparing CGM versus fingertip blood glucose meters demonstrated that CGM is affected by a distortion due to diffusion processes and by time-varying systematic under/overestimations due to calibrations and sensor drifts [12].
The CGMS is calibrated with the ordinary BGL meter’s value frequently, but still has worst case errors in the range of 3-4 mmol/l [13] compared to the 1 mmol/l [14] maximal error of the ordinary meter.
Figure 4. Ordinary fingertip blood glucose meter (left) and glucose monitoring with Continuous Glucose Monitoring device (right).
The exact BGL can be measured from blood taken intravenously in a laboratory (an invasive procedure) and the accuracy of blood glucose measuring devices is measured relative to this value.
It is important to note that since there were no intravenously BGL measurements in the clinical studies used for evaluation throughout the thesis, my goal was generally to predict the BGL value measured by a CGM calibrated from a fingertip device. This approach is in line with the methods widely accepted in the research community of outpatient diabetes care. Therefore, throughout the work when I write about BGL, I really mean the values measured by CGM.
2.4 MATHEMATICAL MODELS
The BGL related metabolism can be divided into two parts. One of them is the main glucose control process including insulin absorption and the reaction mechanism to the changing blood glucose level. This part is matched with the other subsystem including nutrient uptake and glucose absorption.
2.4.1 Glucose absorption models
There are many methods for modeling nutrient absorption proposed in the literature [15], the most well-known of which is the one used in the Diabetes Advisory System (DIAS) [16]. DIAS uses a one-compartment (stomach) absorption model, without considering the effect of the glycemic index of the various carbohydrates contained in the meal, nor the fiber and other nutrient content. In contrast, the two-compartment model due to Arleth et al. that I chose for glucose absorption modeling has a separate compartment for the intestine and it can model the timing of the absorption processes, such as the breakdown of starch to monosaccharide, in finer detail [17]. The structure of the model is shown in Figure 5. It should be noted that the real processes of the metabolism are naturally far more complicated.
Figure 5. Structure of the two-compartment glucose absorption model. Arrows show the transport and absorption
(transformation) of the nutrients in the two compartments.
In the first compartment, processing takes place in the stomach and in the second compartment, in the intestine.
Adopted from [18].
The Arleth model takes the consumed quantities of lipids, proteins, dietary fibers, monosaccharides and starch as inputs. An important feature of the model is the support of a Glycemic Index (GI) parameter that can be attached to a meal item or ingredient, by which it is possible to model ‘mixed’ meals. Modern dietary databases are expected to contain GI information for each ingredient containing carbohydrates, so a meal can be modeled as a ‘glycemic mix’.
The main input parameters of the model, shown in Figure 5, are the amounts of protein, fat, fiber, monosaccharide and starch consumed. The algorithm uses the simple material balance equations described in equations (1-5), shown in the same order as the food itself progresses. The exact values for the constants used in the equations are detailed in [18].
sProteins(ti+1) = sProteins(ti) + ∆mProteins(ti) − ∆eProteins(ti) (1) sLipids(ti+1) = sLipids(ti) + ∆mLipids(ti) − ∆eLipids(ti) (2) Fibres(ti+1) = sFibres(ti) + ∆mFibres(ti) − ∆eFibres(ti) (3) Monosac(ti+1) = sMonosac(ti) + ∆mMonosac(ti) ∗ CHOAvail
− ∆eMonosac(ti) + ∑ ∆sStarchGI(ti)
GI
(4) Monosach.
Strach Fiber Lipids
Proteins Monosach.
Starch Fiber
BLOOD
Excreted as faeces MEAL
MEAL MEAL
MEAL MEAL
STOMACH INTESTINE
sStarchGI(ti+1) = sStarchGI(ti) + ∆mStarchGI(ti) ∗ CHOAvail
− ∆eStarchGI(ti) − ∆sStarchGI(ti) (5)
Equations (1-5) refer to the gastric compartment, taking the present material amount (‘s’ prefix), the food consumed (‘m’ prefix) and the amount injected from stomach into the intestine (‘e’ prefix) into account. The CHOAvail constant represents the uptake rate of stomach monosaccharide and starch from the food consumed and is set to 0.76 [18]. The breakdown of starch to monosaccharide is represented by ∆sStarchGI(ti) in the equation (4). Further description of the model is given in reference [18].
2.4.2 Glucose control and insulin absorption system
The other important part of the combined model is the glucose control system that calculates the insulin evolution. A great overview about these methods is presented in [19]. Many of these algorithms are based on the original Minimal Model [20], which is a stable base of BGL estimation, but lacks in parameter set and model complexity, resulting in weaker prediction force. Other, more sophisticated methods include integro-differential [21], partial differential [22] and delay differential equations [23], often validated on a ‘virtual patient’ [24]–[26]. A common feature of these models is that they have been developed for inpatient care, where it is possible to measure several personal physiological model parameters. In general, more complex BGL regulation models describe the metabolism better, but are very hard to personalize for outpatients for whom invasive clinical measurements are not available. At the same time, even the most sophisticated models cannot account for such factors as the mental state.
Model personalization means to find the BGL model parameters individually for each patient. If the clinical measurement option is not viable, we can also use a historical lifestyle log with corresponding CGM data to estimate the parameter set (via a machine learning method), but only if the number of parameters is low i.e.
the model is not very complex. This was a basic consideration behind the previous BGL model personalization efforts of the Medical Informatics Research and Development Centre (MIRDC).
The simple model used in the earlier work at the MIRDC was created by P.
Palumbo et al. [23], [27] and is based on Delay Differential Equations (DDE). The main equations of the model are as follows.
𝑑𝐺
𝑑𝑡 = −𝐾𝑥𝑔𝑖𝐺(𝑡)𝐼(𝑡) +𝑇𝐺𝐻
𝑉𝐺 (6)
𝑑𝐼
𝑑𝑡= −𝐾𝑥𝑖𝐼(𝑡) +𝑇𝑖𝐺𝑚𝑎𝑥
𝑉𝐼 𝑓(𝐺(𝑡 − 𝜏𝐺)) + 1
𝑉𝐼𝑡𝑚𝑎𝑥,𝐼𝑆2(𝑡) (7) 𝑑𝑆2
𝑑𝑡 = 1
𝑡𝑚𝑎𝑥,𝐼𝑆1(𝑡) − 1
𝑡𝑚𝑎𝑥,𝐼𝑆2(𝑡) (8)
𝑑𝑆1
𝑑𝑡 = − 1
𝑡𝑚𝑎𝑥,𝐼𝑆1(𝑡) − 𝑢(𝑡) (9)
The above equations describe insulin transfer between S1 and S2
subcutaneous insulin depots (8,9), insulin (I) absorption into blood (7) and the role of insulin in blood glucose level (G) control (6) Function 𝑢(𝑡) describes the subcutaneous insulin input, while the 𝑓(𝐺(𝑡 − 𝜏𝐺)) function used in equation (7) represents the endogenous insulin production equation (10) The parameters of the model are also shown in Table 2 with a more detailed description.
𝑓(𝐺) = (𝐺 𝐺∗)𝛾 1 + (𝐺
𝐺∗)𝛾 (10)
Table 2. Glucose control model parameters in the Palumbo model (kgBW = weight in kilograms) [23].
Name Description Unit
𝐾𝑥𝑔𝑖 Rate of glucose uptake by insulin-dependent tissues
1/(𝑚𝑖𝑛 ∗ 𝑝𝑀)
𝑇𝐺𝐻 Net balance between hepatic glucose output and insulin-independent zero-order glucose uptake by brain
𝑚𝑚𝑜𝑙/(𝑚𝑖𝑛
∗ 𝑘𝑔𝐵𝑊)
𝑉𝐺 Apparent distribution volume for glucose 𝐿/𝑘𝑔𝐵𝑊 𝐾𝑥𝑖 Apparent 1st order disappearance rate constant for
insulin
1/𝑚𝑖𝑛
𝑇𝑖𝐺𝑚𝑎𝑥 Maximal rate of second-phase insulin release 𝑝𝑚𝑜𝑙/(𝑚𝑖𝑛
∗ 𝑘𝑔𝐵𝑊)
𝑉𝑖 Apparent distribution volume for insulin 𝐿/𝑘𝑔𝐵𝑊 𝜏𝐺 Apparent delay with which the pancreas varies
secondary insulin release in response to varying plasma glucose concentrations
𝑚𝑖𝑛
𝑡𝑚𝑎𝑥,𝐼 Time-to-maximum insulin absorption 𝑚𝑖𝑛
𝐺∗ The glycaemia at which the insulin release is half of its maximal rate
𝑚𝑚𝑜𝑙/𝑙
𝛾 The progressivity with which the pancreas reacts to circulating glucose concentrations
−
In our previous work [28], we implemented an outpatient blood glucose prediction model by combining the Arleth and Palumbo models described above.
The combination was achieved by changing the equation (6). As a result (11), the new equation contains the monosaccharide absorption through intestine wall (∆aMonosac(t)) calculated by the glucose absorption model.
𝑑𝐺
𝑑𝑡 = −𝐾𝑥𝑔𝑖 ∗ 𝐺(𝑡) ∗ 𝐼(𝑡) +𝑇𝐺𝐻
𝑉𝐺 + ∆𝑎𝑀𝑜𝑛𝑜𝑠𝑎𝑐(𝑡) (11)
2.5 ASSESSMENT OF PREDICTION MODEL ERRORS
In the field of model based BGL prediction, the prediction time frame, also referred to as ‘horizon’, typically lasts for 15 to 240 minutes and the prediction is usually started after a meal and insulin administration event. From the clinical point
of view, the practical goal of the prediction is to estimate the patient’s glycemia between two main meals of the day, so 15-minute predictions have limited applicability (though they can be used to assess model performance). The unit used for RMSE is either mmol/l or mg/dl; in this dissertation I’ll use only mmol/l for consistency.
There are several assessment methods and figures of merit used routinely in the literature to measure and analyze the strength and weakness of prediction models. The figures of merit include Mean Absolute Error (MAE), Correlation Coefficient (CC), the Root Mean Square Error (RMSE), and the ratio of acceptable error i.e. the percentile of the cases when the prediction error remained under 1 mmol /l or 3 mmol /l (margin of error of the measurement devices).
The MAE is the absolute difference between the predicted and the measured BGL values at all time instances for which a BGL measurement is available over a prediction time frame. MAE can be calculated with the following equation:
𝑀𝐴𝐸 =∑𝑛𝑖=1∣ (𝑥𝑖− 𝑦𝑖)∣ 𝑛
(12) where 𝑥𝑖 is the measured glucose value at the time instant 𝑡𝑖, 𝑦𝑖 is the predicted BGL at the same time instant, and 𝑛 is the total number of blood glucose measurements in each dataset.
The RMSE is a quadratic score that also measures the average magnitude of the error. It is the square root of the average of squared differences between prediction and actual measured values. RMSE can be obtained by using the following formula:
𝑅𝑀𝑆𝐸 = √∑𝑛𝑖=1(𝑥𝑖− 𝑦𝑖)2 𝑛
(13) The CC value statistically shows the strength of the relationship between the relative movements of actual measurement and the prediction. The values range between -1.0 and 1.0. A correlation of -1.0 shows a perfect negative correlation, while a correlation of 1.0 shows a perfect positive correlation. A correlation of 0.0 shows no linear relationship.
Besides MAE and RMSE, the clinical reliability of BGL predictions is often evaluated with Clarke’s Error Grid Analysis (EGA) [29]. The Clarke error grid approach is used to assess the clinical significance of differences between the predicted values and the blood glucose reference measurements. The method uses a Cartesian diagram, in which the predicted values are displayed on the y-axis, whereas the values from the reference method are displayed on the x-axis. EGA classifies predictions into 5 classes A-B-C-D-E with respect to the clinical outcome of an insulin dosing based on the predicted BGL. The worst scenarios (Classes D and E) is an overly high BGL prediction when the actual BGL of the patient is in the < 4 mmol/l range, because relying on such a prediction may lead to hypoglycemia, an emergency situation. Thus, the same absolute numerical error may be classified into various classes depending on the real BGL range and the sign of the error. A predicted value is termed ‘clinically acceptable’ if it is classified into either the A or B EGA class. For a graphical representation of the EGA regions, see Figure 6. CG-EGA is a variation of the EGA grid in which the ‘accurate’ domain is roughly equivalent to the EGA ‘clinically acceptable’ classification [30].
Figure 6. Clarke Error grid analysis. A: clinically accurate prediction, smaller than 20% error, B: error still resulting clinically acceptable decision, C: possibility of hypo- or hyper-
glycemia, D: sector of dangerous errors, E: resulting in opposite decision, endangers the life of the patient Adapted
from [29].
2.6 THE LAVINIA LIFESTYLE MIRROR APPLICATION
Diabetes is strongly linked with overweight and bad nutrition, the results of improper lifestyle. Lifestyle, however, is very hard to change, and since it is not expected that all patients endangered by, or already having diabetes could receive daily dietary advice from expert dietitians, there is a great need for personalized dietary advice and lifestyle support on mobile devices. A mobile application that provides instant feedback on the logged nutrition, physical activity and medication of a patient can effectively assist in learning the lifestyle related do's and don'ts for a diabetic or pre-diabetic person.
Advances in mobile technology make it now possible to keep reliable lifestyle logs including nutrition. Such logs can be a basis for smart services like BGL prediction for millions of diabetic patients in their daily life. It has been shown that patients can benefit from mobile Ambient Assisted Living [31] services for diabetes management [32].
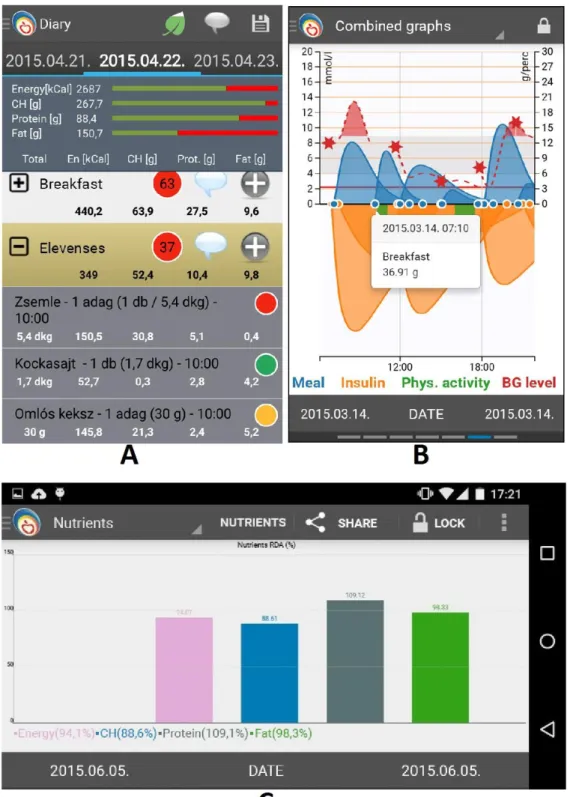
The Lavinia Lifestyle Mirror is an Android application supported by a dietary expert system backend, developed at the MIRDC [33], [34]. Screens of Lavinia application’s different modules can be seen in Figure 7. The main screen in Figure 7.A. shows the consumed meals on a given day and the aggregated nutritional values of all meals. In Figure 7.B the input data and the BGL values predicted by the integrated prediction model can be seen. Figure 7.C displays a chart of energy nutrient contents of the consumed meals.
An advantage of Lavinia over other mobile apps for DM management and lifestyle logging on the market is its support for instant numerical evaluation and visual feedback (see e.g. Fig. 7.B).
Figure 7. Panels of the Lavinia lifestyle application. A: Daily dietary log summary (‘Zsemle’: bread, ‘Kockasajt’: cream cheese, ‘Omlós keksz’: biscuits are items of the meal). B. The
computed absorption curves for insulin (orange) and meals’
carbohydrates (blue). The stars show the results of logged fingertip BGL measurements. BGL prediction is shown as a dashed red line. C. chart of nutrient contents of consumed
meals (adopted from [35], [36]).
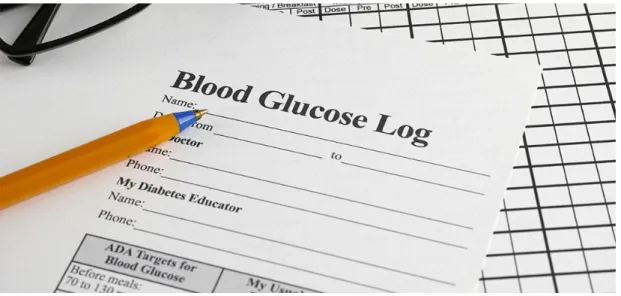
Figure 8 illustrates the traditional paper based lifestyle logging method. An obvious advantage of the digital method is the possibility of data processing by giving a response based on automated numerical analysis immediately. This cannot be done with a paper dietary. In the digital solution, the patient receives immediate feedback on the food entry and the patient has a better understanding of the relationships between diet and BGL development, thereby a better understanding of lifestyle as a motivating effect.
Figure 8. Sample of paper based diabetic diary
2.7 CLINICAL TRIALS
In my research I worked with datasets collected in the following trials.
2.7.1 The HK4 clinical trial
The clinical study was performed at the Cardiac Rehabilitation Institute of the Military Hospital, Balatonfüred, Hungary. The study was designed to simulate the real circumstances of the planned lifestyle counseling application. It started on 2014.09.17. For data entry Nexus 4 smartphone and Nexus 7 tablet, with the Lavinia application pre-installed was used. The patients were under continuous medical and dietary supervision and an informed consent was obtained from the patients as a prerequisite to enter the trial. The study protocol was approved 18 October 2013 by
the institutional ethical committee of the Military Hospital, Budapest, Hungary, chaired by Dr. László Kovács, under the submission number II/20-265-2013. The protocol was designed and implemented in compliance with the World Medical Association Declaration of Helsinki on Ethical Principles for Medical Research Involving Human Subjects.
The continuous BGL measurement data was provided by the Guardian Real- Time and iPro Continuous Glucose Monitoring Systems (CGMS) by Medtronic Company [37]. The summary of the trial:
22 T2DM patients (15 men and 7 women)
Age: 41-84, median 66.7
Tracking days per patient: 3-25, median 18, 369 in total
Meals logged per patient: 16-202, median 87.5, 1884 in total
Insulin administration events logged per patient: 8-102, median 69, 1397 in total
BGL values logged per patient
o Single value 18-112, median 55, 1307 in total o CGM 556-3285, median 1533, 31995 in total 2.7.2 The HK5 clinical trial
The clinical study was performed at the Cardiac Rehabilitation Institute of the Military Hospital, Balatonfüred, Hungary. The study included insulin-dependent T1DM and T2DM patients taking part in 3-week rehabilitation courses between April and August 2019, with daily activities similar to everyday life. The CGM system used was the Medtrum’s S7 EasySense CGM System [38], which registered subcutaneous glucose values every 2 minutes.
8 T2DM patients (3 men and 5 women)
Age 48-70, median 60.5
Tracking days 11-23, median 18.5, 142 in total
Meals 39-109, median 86, 640 in total
Insulin 44-92, median 72.5, 562 in total
BGL values
o CGM 5346-14558, median 6607, 66238 in total 2.7.3 Data availability
The detailed, anonymized data sets used for the research presented in this dissertation are available at request from the author. Other data related to the clinical trial may be released upon application to the institutional Ethical Committee of the Military Hospital, which can be contacted at Magyar Honvédség Egészségügyi Központ Intézményi és Regionális Kutatásetikai Bizottsága, Róbert Károly körút 44, 1134 Budapest, Hungary.
2.8 PROBLEM STATEMENT
My main objective is to predict BGL for the purpose of an educational and lifestyle management aid for DM patients. Characterizing and diagnosing the patient's current condition is not an objective of the work. The input for the predictions is limited to the data available from the clinical trials: fingertip BGL, CGM data, insulin log and detailed dietary log. The support for other factors influencing BGL like physical activity, stress and state of mind is left for future research.
The predictions should be applicable for DM patients, especially those on external insulin, by providing BGL predictions based on their dietary and insulin administration log. If the prediction is reliable and the method is integrated into a lifestyle management application like Lavinia, the patients could be warned of hypo/hyperglycemia in time to reconsider their insulin dosage or planned meal. It should be emphasized that in contrast to artificial pancreas research, my aim is not to give a recommendation for insulin dosing, I provide only a prediction—either as an educational aid or as a tool to test ‘what-if’ scenarios.
2.9 OVERVIEW OF THE CHAPTERS
Chapter 3 investigates the feasibility of providing BGL prediction for two hours period after meals based on a dietary log and a calibration measurement without using insulin information. The goal is to Develop an ‘impulse response’ type
prediction method by clustering patients upon the characteristic of postprandial glucose response profiles and using the calculated average BGL response for clusters to predict the glucose evolution of patients belonging to the clusters. If the new method produces accurate results, it can be applicable to support or replace the mathematical models in case of insulin independent patients.
The goal of the work presented in Chapter 4 was to adjust the mathematical model described in subsection 2.4 to support basal insulin in order to provide more accurate short term blood glucose prediction. The basic idea is to simulate the absorption of basal insulin as a series of smaller insulin doses according to four alternative ‘dosing profiles’, instead of using a single big dose of bolus insulin.
The objective of Chapter 5 was to develop a method for BGL prediction based on the baseline BGL, the insulin dosing and a dietary log using artificial neural network, without any mathematical BGL regulation model. As a novelty compared to other published neural-based BGL prediction results, the glucose absorption curve of the meal computed using the Arleth glucose absorption model (subsection 2.4.1) will provide the input training data for the neural network.
Chapter 3: Examination of blood glucose response curves and diet
relationship in a small scale study
One of the advanced Lavinia services is the log based short term BGL prediction. For this task, our research group previously developed a method [28]
that uses the combination of two state-of-the-art models reflecting the real process happening in the body. However, since this method runs mathematical models for the digestion and blood glucose control system, it is not feasible in pre-diabetes because the endogenous insulin production, an important input of the model, is hard to estimate. Pre-diabetes is a “pre-diagnosis” of diabetes which is characterized by an elevated BGL. Thus, the motivation of my work was to find an alternative way for personalized and log-based BGL prediction. The idea is based on the fact that the postprandial glucose profiles depend on meal’s absorption characteristics [39]. We therefore try to find the typical responses to characteristic meals and try to predict the BGL responses using a personalized training sample, recorded via a CGM device. If the response proves characteristic to the individual person and the meal type, this could be used as a starting point in short term postprandial blood glucose prediction.
3.1 METHODS
First I performed a pre-study with 6 healthy volunteers members of the MIRDC [2 female, 4 male, age 29.5 ± 8.5 years, body mass index 24.5 ± 5.4 kg/m2].
The study took place in June 2015 and the protocol involved 6 days with CGM measurement, with 3 days of standardized diet with 5 meals per day, and 3 days normal meals according to the individual eating habits. The ‘standardized diet’
means that the participants had the same breakfast, lunch, dinner and the 2 snacks for each day at the same time, designed by a dietitian expert. Meals were designed according to daily energy needs. There was a lower (2000 kcal) and a higher (2500
kcal) energy need group. The participants used the Lavinia dietary mirror application to log their meals. I characterized the postprandial glucose response profile with the following three numeric parameters (Figure 9):
the time to peak of BGL after a meal, in minutes
the BGL difference between the start and the peak in mmol/l
elapsed time to complete the BGL curve, in minute. The curve is considered complete when the BGL stops dropping.
Figure 9. BGL response curve characterization by V1, V2 and V3 numeric parameters.
I linked these 3 parameters to the carbohydrate content and the glycemic composition of the meals [9] for each investigated subject, thus setting up an
‘impulse response’ type method to predict the glucose concentration evolution for two hours after the meals. The characteristics and variability of the responses among the meal types and patients were also analyzed. 2 persons (P02, P06) were excluded due to incomplete or unreliable data. The results showed that 3 of the 4 persons with acceptable data had a rather characteristic (personal) BGL response to the meal, so the idea of relying solely on the dietary log for qualitative predictions is promising. Figure 10 shows the BGL responses of breakfasts in the standard meal days for the 6 healthy volunteers.
Figure 10. BGL response curves of the first 3 day’s breakfast for the 6 healthy volunteers. The curves show 2 hours BGL evolution measured by CGM. Zero minute is the moment of breakfast. PD02 and PD06 (shaded) were excluded because
of unreliable data.
Based on these findings, I extended and validated the method on a larger sample. The larger sample was drawn from the HK4 clinical study involving 22 patients with CGM for duration of 6 days. These participants were in general not so fully committed as those of the pre-study, so the collected data was less reliable.
The participants had a standardized menu with personal deviations and they used the Lavinia application to log their meals. A Guardian Real-Time CGM by Medtronic Company [37] was used for monitoring blood glucose concentration. I had three initial study hypotheses that I wished to validate:
1. The post-prandial responses to standardized meals show a typical, reproducible, but personal BGL curve
2. Characterizing the patients based on response clusters improves the reliability of the response-based prediction
3. Post-prandial glucose profile in the whole response set depends on meal’s dietary characteristics, e.g. fiber, fat, liquid intake
After the data collection phase, I performed a rigorous data cleaning process that included the identification and removal of possibly erroneous log records such as those with obviously incorrect timing. I also removed meal logs with insufficient or incorrect CGM data. The data cleaning process resulted in the exclusion of 7 patients. The Input data contained 439 breakfasts for 22 patients. Only 122 breakfasts for 20 patients had CGM. 79 breakfasts for 19 patients satisfied for 30 g CH ±20% (excluding those with too much deviation). After excluding visible
measurement errors and artifacts due to uncontrolled parameters (physical activity, incorrect timing, bad logs) 44 breakfasts for 15 patients remained.
I performed k-means meal-wise clustering on the whole record set with respect to the three numeric parameters, and also on the remaining meal logs and analyzed the characteristic differences among the clusters. I used the Waikato Environment for Knowledge Analysis (Weka) [40] framework for clustering. In Weka I chose the Expectation Maximization (EM) clustering algorithm that relies on maximizing the likelihood to find the statistical parameters of the underlying sub- populations in the dataset. EM parameterizes the k-means cluster so that the quality of the grouping is as good as possible, i.e. values of the mixture log likelihood to be the best. I used the default parameter set for the expectation maximization clustering algorithm.
3.2 RESULTS
The clustering on 282 meals separated the meal records into 3 distinct clusters for the breakfast, lunch and dinner Figure 11, suggesting that the meal type has a stronger influence on the BGL response than other factors. I therefore focused on the breakfasts only, assuming that it is the breakfast that is the least influenced by other meals.
Figure 11. 282 meals for 20 patients form 3 clusters with respect to V1-V3 parameters Cluster0 – lunch, Cluster1 –
breakfast, Cluster2 – dinner.
In the followings, I used the 44 breakfast responses of the 15 patients of the cleaned data set. Further clustering of breakfasts resulted in 3 distinct clusters, the
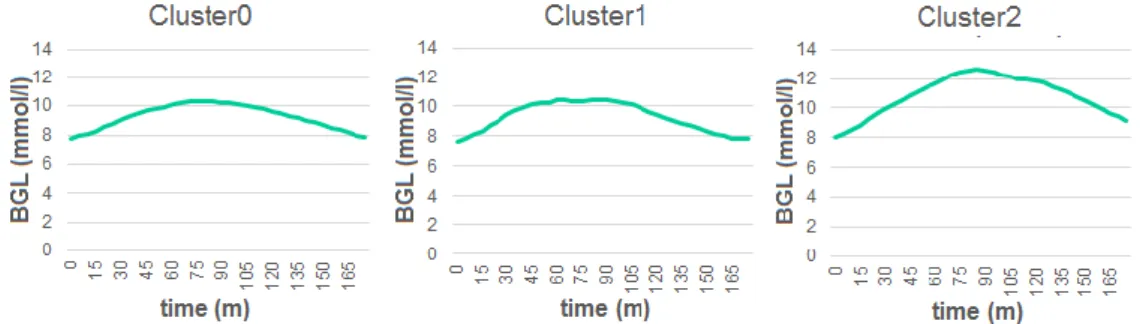
‘symmetrical’, 'flat top’ and ‘steep rising’ shaped curves for Cluster0, Cluster1 and Cluster2 respectively as it is shown in Figure 12. 18 responses (41%) were grouped in Cluster0, 12 responses (27%) in Cluster1 and Cluster2 included 14 responses (32%). The averaged response curves of the three clusters are shown in Figure 12.
By a simple visual inspection, Cluster0 is described as ‘symmetrical’, Cluster1 ‘flat top’ and Cluster2 ‘steep rising’.
An important result was that only 2 persons’ responses belonged to multiple clusters, all other patients were found cluster dependent, which supports the idea that patients can be characterized by clusters.
Figure 12. Representation of the response curves for the 3 clusters calculated as the average of the postprandial blood
glucose response curves of the patients in that cluster.
In order to check the predicting power of the clusters, I computed the total absolute error of the averaged curves compared to the CGM data, first using for each patient the averaged curve of all responses, then the cluster specific curve.
The cluster specific curve calculated by the average of all patients responses belong to the given cluster. MAE with a global response was 1.242 mmol/l which decreased to 1.146 mmol/l when using the response of the patient’s cluster. The improvement was 7.7% (p<001). The cluster-wise results are shown in Table 3.
Table 3. Total absolute error and MAE of BGL prediction with and without clustering and the improvement. p-values show
the significance level of the paired sample t-test.
Cluster No. of Patients (measurements)
Global response (mmol/l)
Cluster response
(mmol/l) %
improvement Total abs.
error
MAE Total abs.
error MAE
Cluster0 6 (648) 672 1.037 625 0.964 7%
p<0.01
Cluster1 5 (396) 580 1.465 575 1.451 1%
p<0.01
Cluster2 2 (432) 582 1.347 493 1.140 15%
p<0.01
To examine whether the clusters different from each other, and to quantify the difference between them I compared the prediction of blood glucose levels of the patient group in one cluster with the prediction of the impulse response function of another cluster. The difference between prediction using own cluster response and other cluster response based prediction support the uniqueness of the response functions. The results can be seen in Table 4.
Table 4. MAE (mmol/l) of BGL prediction with own cluster response and with other cluster response. The first data row
shows MAE of predicting BGL of patients in Cluster0 using the average response of Clusters in the column headers, same for the second and third data row. Bold values are MAE
values using response of own cluster for prediction.
Clusters Cluster0 Cluster1 Cluster2
Cluster0 0.964 1.022 1.376
Cluster1 1.460 1.451 1.672
Cluster2 1.546 1.534 1.140
In order to check the third hypothesis i.e. the response’s dependence on the meal composition, I also performed Paired t-tests on 19 standard breakfasts compared to 19 ‘modified’ breakfasts. I expected that a larger portion of the same meal would produce the same curve length with a higher peak, and that another
meal with the same CH content but with higher glycemic index would produce a shorter length with the same area under the curve. However, the test results did not show a significant difference (p>0.1).
3.3 DISCUSSION AND CONCLUSION
If there were more data per patient and we could assign typical trajectory curves to meal parameters and person customizable, these curves could be used to roughly estimate the postprandial blood glucose response. At present, insulin has not been addressed, assuming that there is no external insulin for example in the case of prediabetes patients or that the dose is always approximately the same. This would be the applicability of the method.
As the results show, most patients in the study can be clearly classified in a specific cluster based on their meal response characteristics, and this supports the hypothesis that the post-prandial responses to standardized meals show a typical, reproducible, but personal BGL curve. The reduction of the absolute error of the BGL prediction achieved by using patient clusters shows that the patient characterization based on response clusters improves the reliability of the response-based prediction. However, the meal responses of standard breakfasts compared to modified breakfasts did not show a significant difference, so I could not verify the third hypothesis. The cause for this may lie in uncontrolled factors such as stress and physical activity, but most of all, the small data set. The results are promising, but further work and possibly trials with more subjects are needed to integrate a clustering-based BGL prediction service into mobile lifestyle services.
![Figure 2. Schematic and qualitative flow chart of global blood glucose control (L: low, N: normal, H: high BGL)[7]](https://thumb-eu.123doks.com/thumbv2/9dokorg/871643.46876/16.892.226.776.224.478/figure-schematic-qualitative-chart-global-glucose-control-normal.webp)

![Table 2. Glucose control model parameters in the Palumbo model (kgBW = weight in kilograms) [23]](https://thumb-eu.123doks.com/thumbv2/9dokorg/871643.46876/23.892.178.710.219.468/table-glucose-control-model-parameters-palumbo-weight-kilograms.webp)